Fig. 1
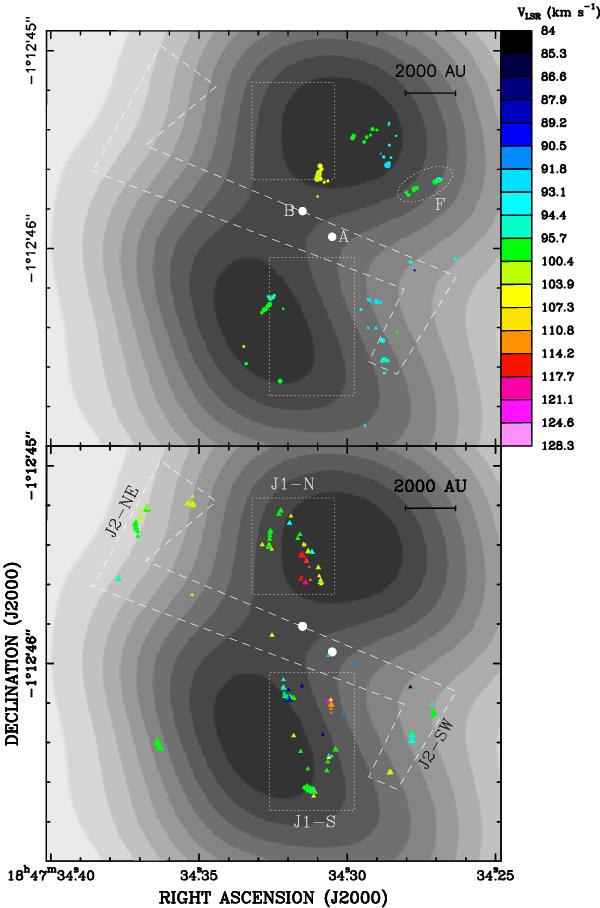
Lower and upper panels show the absolute position and LSR velocity of the 22 GHz water (filled triangles) and 6.7 GHz methanol (dots) maser features, respectively. Colors denote the maser VLSR according to the color–velocity conversion code shown on the right-hand side of the upper panel. Symbol area is proportional to the logarithm of the feature intensity. In both panels, the gray-scale map reproduces the integrated emission of the CH3CN (12-11) K = 4 line (at ≈221 GHz) observed with the SMA (beam ≈0 8) by Cesaroni et al. (2011). Contour levels are from 0.15 Jy beam-1 to 2.3 Jy beam-1 by steps of 0.27 Jy beam-1. The white big dots denote the position of the two VLA compact sources, named “A” and “B”, detected by Cesaroni et al. (2010). In both panels, the two dotted rectangles and the S-shape dashed polygon encompass the area where the “J1” and “J2” water maser groups distribute, respectively (see Sect. 3.1). The northern and southern “J1” clusters are named “J1-N” and “J1-S”, respectively. The water maser clusters at the southwestern and northeastern ends of the “J2” distribution are named “J2-SW” and “J2-NE”, respectively. In the upper panel, the dotted ellipse surrounds a cluster of 6.7 GHz methanol masers, identified with the name “F”, more detached from the area of water maser detection.
Current usage metrics show cumulative count of Article Views (full-text article views including HTML views, PDF and ePub downloads, according to the available data) and Abstracts Views on Vision4Press platform.
Data correspond to usage on the plateform after 2015. The current usage metrics is available 48-96 hours after online publication and is updated daily on week days.
Initial download of the metrics may take a while.