Fig. 5
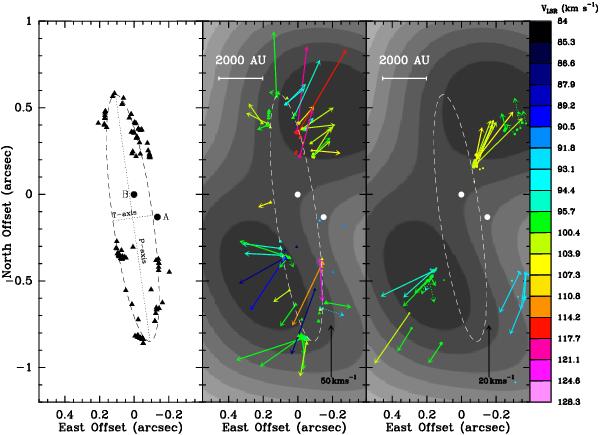
Each of the three panels shows the same area of the sky around the “J1” water maser group. Maser positions are always refered to the VLA source “B” (see text). In each panel, the dashed line shows the best-fit ellipse to the distribution of the “J1” water masers. Left panel: black triangles denote the positions of the “J1” water masers. The dotted lines trace the major (labeled “P-axis”) and minor (“T-axis”) axis of the best-fit ellipse. Black dots give the positions of the VLA sources “A” and “B”. Central and right panels: colored triangles and dots show the positions of the water (central panel) and methanol (right panel) masers, respectively. Symbol area is proportional to the logarithm of the feature intensity. Colors, the gray-scale map, the white big dots have the same meaning as in Fig. 1. Colored vectors indicate the direction and the amplitude of the maser proper motions. The black vector in the bottom right corner of the panels indicates the amplitude scale of proper motions in kilometer per second. Dotted vectors are used for the most uncertain proper motions.
Current usage metrics show cumulative count of Article Views (full-text article views including HTML views, PDF and ePub downloads, according to the available data) and Abstracts Views on Vision4Press platform.
Data correspond to usage on the plateform after 2015. The current usage metrics is available 48-96 hours after online publication and is updated daily on week days.
Initial download of the metrics may take a while.