Fig. 6
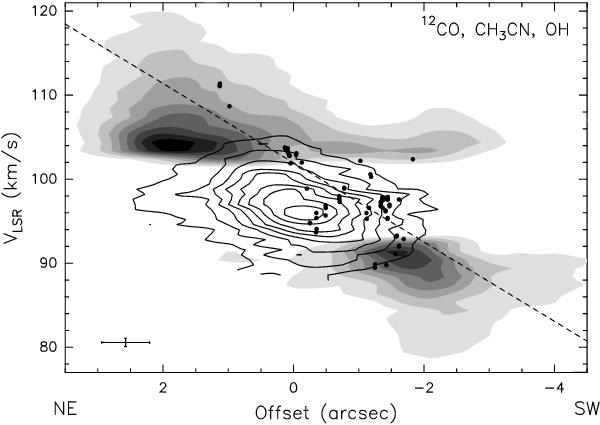
Position-velocity plots of the 12CO(2–1) (gray scale) and CH3CN(12–11) K = 4 line emission obtained with the SMA by Cesaroni et al. (2011). The offset is measured along the direction with PA = 68° passing through the HMC (see Fig. 3) and is measured from the phase center of the SMA observations (α(J2000) = 18h47m34 315, δ(J2000) = –01°12′45
 9), assumed positive toward NE. Contour levels increase from 0.2 in steps of 0.2 Jy beam-1 for CH3CN and from 0.24 in steps of 0.24 Jy beam-1 for 12CO. The cross in the bottom left denotes the angular and spectral resolutions of the SMA data. The solid dots represent the 1665 MHz and 1667 MHz OH maser features detected in our VLBA observations. The black dashed line gives the best linear fit of the OH maser VLSR versus corresponding positions.
Current usage metrics show cumulative count of Article Views (full-text article views including HTML views, PDF and ePub downloads, according to the available data) and Abstracts Views on Vision4Press platform.
Data correspond to usage on the plateform after 2015. The current usage metrics is available 48-96 hours after online publication and is updated daily on week days.
Initial download of the metrics may take a while.