Fig. 7
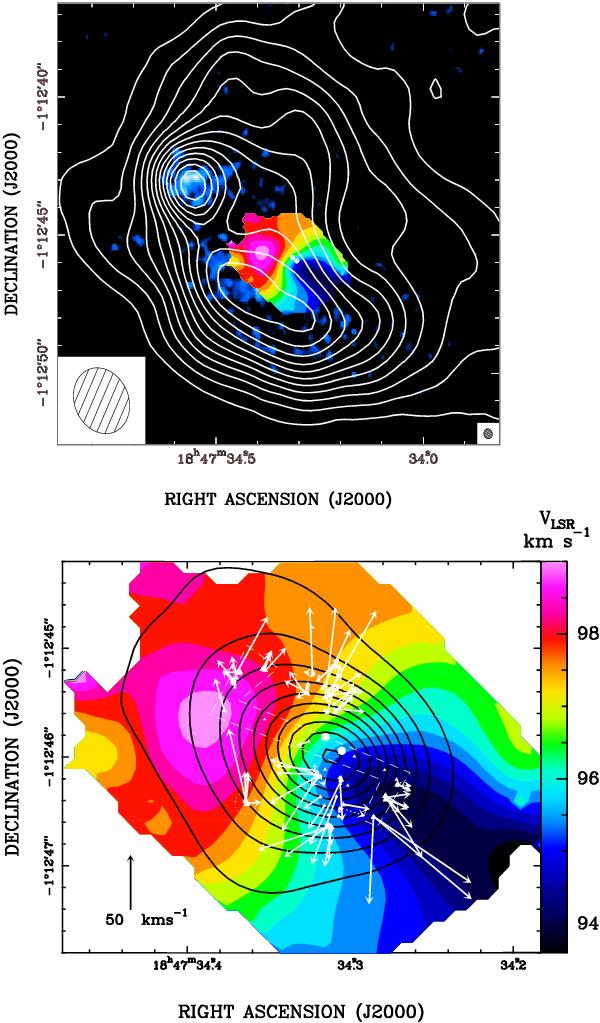
The G31.41 + 0.31 HMC (lower panel) and its environment (upper panel). Upper panel: the blue-tone image reproduces the VLA B-Array 1.3 cm continuum observed by Cesaroni et al. (1998), with blue hue varying logarithmically from a minimum level of 2 mJy beam-1 to a maximum of 7 mJy beam-1. The white contour plot gives the VLA combined C- & D-Array, 1.3 cm continuum from Cesaroni et al. (1994a): plotted contours range from 5 mJy beam-1 to 70 mJy beam-1 by steps of 5 mJy beam-1. The beams of the VLA B-Array and the merged C- & D-Array are shown in the inserts in the bottom right and left corner of the panel, respectively. Lower panel: zoom on the HMC. Overlay of the map of the 1.3 mm continuum emission (contours) on that of the CH3CN(12-11) line velocity (color scale). Contour levels range from 0.1 Jy beam-1 to 2 Jy beam-1 by steps of 0.2 Jy beam-1. The white dots denote the two VLA compact sources detected by Cesaroni et al. (2010). White filled triangles and white vectors give the absolute positions and relative proper motions (with respect to the “center of motion”, see Sect. 3.1) of the 22 GHz water masers. Triangle area is proportional to the logarithm of the maser intensity. The amplitude scale for proper motions is indicated by the black arrow in the bottom left corner of the panel. The S-shape dashed polygon encompasses the “J2” water maser distribution and the dotted circle surrounds the isolated cluster of water masers belonging to neither the “J2” nor the “J1” group.
Current usage metrics show cumulative count of Article Views (full-text article views including HTML views, PDF and ePub downloads, according to the available data) and Abstracts Views on Vision4Press platform.
Data correspond to usage on the plateform after 2015. The current usage metrics is available 48-96 hours after online publication and is updated daily on week days.
Initial download of the metrics may take a while.