Fig. 4
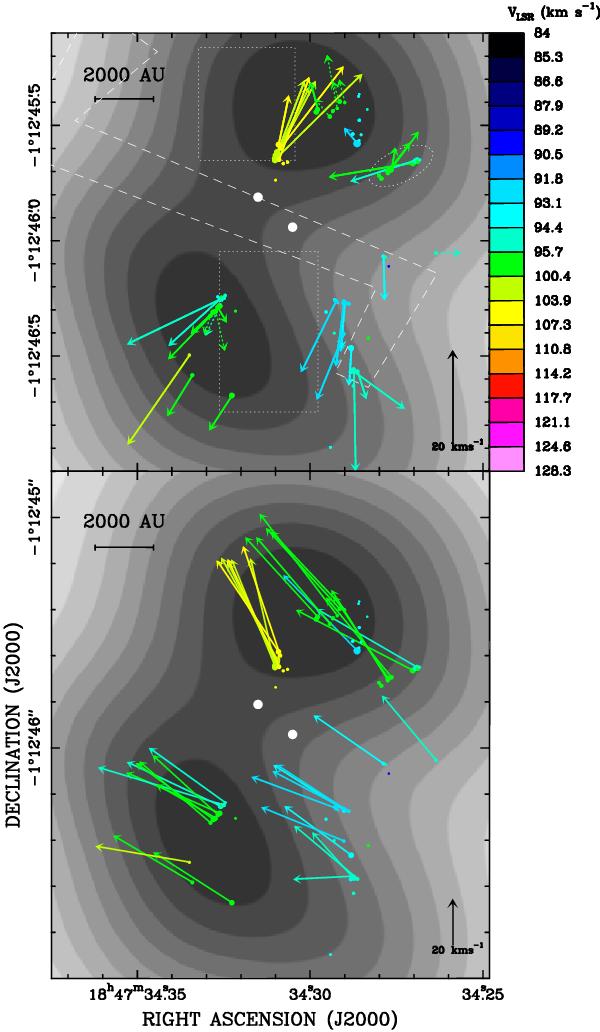
Upper and lower panels show the relative (referred to the “center of motion”) and absolute (corrected for the apparent motion, see Sect. 2) proper motions of the 6.7 GHz methanol masers, respectively. Colored vectors indicate the direction and the amplitude of the proper motions. The black vector in the bottom right corner of the panels indicates the amplitude scale of proper motions in kilometer per second. Dotted vectors are used for the most uncertain proper motions. Colors, symbols, the gray-scale map, the white big dots, the dotted rectangles, the S-shape dashed polygon, and the dotted ellipse, have the same meaning as in Fig. 1.
Current usage metrics show cumulative count of Article Views (full-text article views including HTML views, PDF and ePub downloads, according to the available data) and Abstracts Views on Vision4Press platform.
Data correspond to usage on the plateform after 2015. The current usage metrics is available 48-96 hours after online publication and is updated daily on week days.
Initial download of the metrics may take a while.