Fig. 3
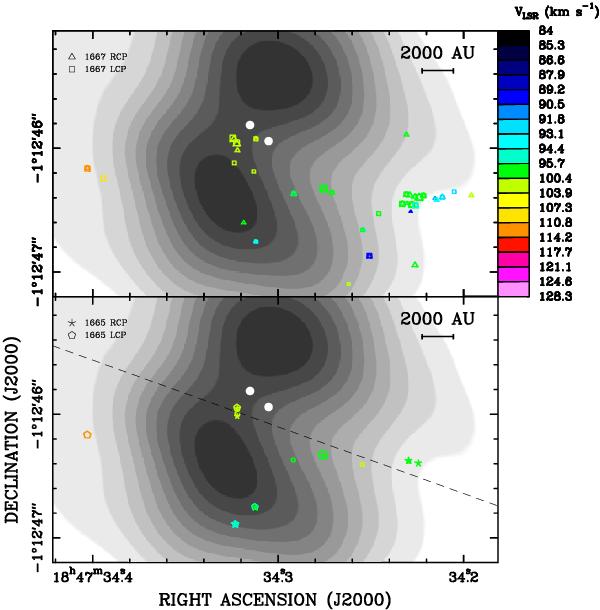
Lower and upper panels show the absolute position and LSR velocity of the 1665 MHz and 1667 MHz OH masers, respectively. For the 1665 MHz masers, the LCP and RCP features are indicated with empty pentagons and stars, respectively. Empty squares and empty triangles indicate the LCP and RCP features of the 1667 MHz masers, respectively. Symbol area is proportional to the logarithm of the feature intensity. The black dashed line in the lower panel shows the axis of projection of the OH maser positions to produce the position-velocity plot of Fig. 6. Colors, the gray-scale map, and the white big dots, have the same meaning as in Fig. 1.
Current usage metrics show cumulative count of Article Views (full-text article views including HTML views, PDF and ePub downloads, according to the available data) and Abstracts Views on Vision4Press platform.
Data correspond to usage on the plateform after 2015. The current usage metrics is available 48-96 hours after online publication and is updated daily on week days.
Initial download of the metrics may take a while.