| Issue |
A&A
Volume 544, August 2012
|
|
|---|---|---|
| Article Number | A105 | |
| Number of page(s) | 14 | |
| Section | Extragalactic astronomy | |
| DOI | https://doi.org/10.1051/0004-6361/201118256 | |
| Published online | 07 August 2012 | |
Unveiling the nucleus of NGC 7172⋆
1 I. Physikalisches Institut, Universität zu Köln, Zülpicher Str. 77, 50937 Köln, Germany
e-mail: This email address is being protected from spambots. You need JavaScript enabled to view it.
2 Max-Planck-Institut für Radioastronomie, Auf dem Hügel 69, 53121 Bonn, Germany
Received: 12 October 2011
Accepted: 2 March 2012
Abstract
Aims. We present the results of near-infrared (NIR) H + K European Southern Observatory SINFONI integral field spectroscopy (IFS) of the Seyfert 2 galaxy NGC 7172. We investigate the central 800 pc, concentrating on excitation conditions, morphology, and stellar content. NGC 7172 was selected from a sample of the ten nearest Seyfert 2 galaxies from the Veron-Cetty & Veron catalogue. All objects were chosen as test cases for adaptive optics (AO) assisted observations that allow a detailed study (at high spatial and spectral resolution) of the nuclear and host environments. NGC 7172 has a prominent dustlane crossing the central galaxy region from east to west, which makes it an ideal candidate to investigate the effect of obscuration by strong galactic extinction on (active) galaxies and their classification.
Methods. The NIR is less influenced by dust extinction than optical light and is sensitive to the mass-dominating stellar populations. SINFONI integral field spectroscopy combines NIR imaging and spectroscopy and provides us with the opportunity to analyze several emission and absorption lines to investigate the stellar populations and ionization mechanisms over the 4″ × 4″ field of view (FOV).
Results. We present emission and absorption line measurements in the central 800 pc of NGC 7172. The detection of [Si vi] and broad Paα and Brγ components are clear signs of an accreting super-massive black hole hiding behind the prominent dustlane at visible wavelengths. Hot temperatures of about 1300 K are indicative of a dusty torus in the nuclear region. Narrow components of Paα and Brγ enable us to make an extinction measurement. Our measures of the molecular hydrogen lines, hydrogen recombination lines, and [Fe ii] indicate that the excitation of these lines is caused by an active galactic nucleus. The central region of the galactic disk is predominantly inhabited by gas, dust, and an old K-M type giant stellar population. The gaseous, molecular, and stellar velocity maps show a related disturbed disk structure and similar velocities.
Conclusions. We find evidence of nuclear activity located behind the prominent dustlane crossing the central region of the galaxy. The nucleus of NGC 7172, which is optically classified as a Seyfert 2 nucleus without any trace of broad emission lines, is a Seyfert 1 nucleus either surrounded by a molecular dust torus or hidden behind the strong galactic extinction. Our observation provides support for the unified model scheme. However, an evolutionary scenario cannot be ruled out by our observation.
Key words: Galaxy: nucleus / Galaxy: stellar content / galaxies: Seyfert / infrared: galaxies
Based on the ESO-VLT STS-Cologne GTO proposal ID: 083.B–0620(A).
© ESO, 2012
1. Introduction
The discoveries that every galaxy with a significant bulge component appears to harbor a super-massive black hole (SMBH) (Magorrian et al. 1998; Kormendy & Kennicutt 2004; Ho 2008) and that the properties of the SMBH and the bulge of the host galaxy are correlated (Magorrian et al. 1998; Page et al. 2001; Tremaine et al. 2002) have renewed the interest in studies of active nuclei. The active phase of a galaxy is one of the most violent episodes of galactic evolution, which thus has a significant impact on the host galaxy. Hence it is unsurprising that the correlations found between the properties of SMBHs and their associated bulges indicate feedback mechanisms that regulate the growth of these two “partners”.
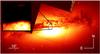 |
Fig. 1 Hubble Space Telescope (HST) F606W image of NGC 7172 (Malkan et al. 1998). The image shows the galaxy NGC 7172 in the visible at 6030 Å. The brightness scale is non-linear such that the edges of the galaxy can be recognized. The small square shows the 4″ × 4″ FOV of our SINFONI observation. The zoom in the upper left corner of the HST image shows this region on a linear brightness scale. Note that the brightest point in the detailed image is the brightest visible point of the galaxy. The dust lane crossing the central region is clearly visible as a dark lane. Note that north of the dust lane is very faint compared to the southern part. The dust lane itself shows 1/30 of the brightness of the brightest point in the visible. |
1.1. Activity in nuclei of galaxies
Since most galaxies harbor a central massive black hole, why are some nuclei more active than others? The unified model (UM) (Antonucci 1993) postulates that the observed differences in the properties of active nuclei are caused by variations in the orientation of the AGN with respect to the observer. Zhang & Wang (2006) and Wang & Zhang (2007) extended the UM by adding an evolutionary component. These authors attempt to explain and relate the known Seyfert 1 and Seyfert 2 galaxies with the narrow-line Seyfert 1 (NLS1) and non-hidden broad-line region (NHBLR) Seyfert 2 galaxies. NLS1 galaxies evolve by accretion onto the SMBHs into broad-line region Seyfert 1 (BLS1) galaxies. NHBLR Seyfert 2 galaxies evolve into hidden broad-line region (HBLR) Seyfert 2 galaxies. In ploarized light, the HBLR Seyfert 2 galaxies have broad emission lines (i.e. Hα), hence these galaxies are intrinsically Seyfert 1 galaxies viewed nearly edge-on, as the UM explains. The NHBLR Seyfert 2 galaxies have no broad emission lines in polarized light, although they have a high ionization potential that permits them to be classified as Seyfert 2 galaxies but the lack of an HBLR challenges the UM. Furthermore, it is often assumed that the fueling efficiency of active nuclei of galaxies depends on the disturbed morphologies of the host galaxies or bars. Hunt & Malkan (2004) report that normal galaxies and low-ionization nuclear emission-line regions (LINERs) have the smallest amounts of disturbed morphologies whereas H ii & starburst galaxies have the strongest deviations from smooth elliptical isophotes. Seyfert 2s have significantly more twisted isophotes than any other category, especially early-type Seyfert 2s, whose isophotes are significantly more twisted than those of early-type Seyfert 1s. This difference in morphology cannot be explained by orientation effects alone.
Star formation on scales of 0.1–1 kpc around the nucleus is an important process in all types of AGN (e.g. Cid Fernandes et al. 2004; Davies et al. 2006, 2007). Recent or ongoing circumnuclear star formation is frequently found in AGN in contrast to quiescent galaxies (e.g., Storchi-Bergmann 2006). Schawinski et al. (2007) suggest that the radiation field of nuclear outflows, which is stronger for the more massive SMBHs, quenches circumnuclear star formation. However, a large fraction of Seyfert 2 galaxies (40%) seem to have experienced a recent star burst (<1 Gyr) (Cid Fernandes et al. 2001; González Delgado et al. 2001; Storchi-Bergmann et al. 2001). Therefore, star formation in the torus has been included in star formation models (Wada & Norman 2002; Thompson et al. 2005). Star formation is connected to nuclear activity in either an amplifying or a quenching way or both.
Coronal lines are believed to be a direct AGN tracer, owing to their high ionization potential (Marconi et al. 1994; Prieto et al. 2005). They are attributed to clouds of high densities and a low volume-filling factor, that are photonionized by hard (AGN) radiation (Binette 1998). These clouds are believed to originate somewhere between the broad-line region (BLR) and the narrow-line region (NLR) (Murayama & Taniguchi 1998). Prieto et al. (2005) and Müller-Sánchez et al. (2011) discuss a correlation between radio emission and coronal lines.
Another interesting question is the connection between host galaxy orientation and Seyfert type. The UM says that the Seyfert classification is independent of the orientation of the host galaxy. Lately, Seyfert galaxy samples have been investigated with regard to the orientation of their host galaxy by various authors (Shen et al. 2010; Ramolla et al. 2011; Lagos et al. 2011). The results show that Seyfert 1 AGN hosts are predominantly face-on galaxies, whereas Seyfert 2 galaxies tend to be edge-on. This leads us to question the extent to which the extinction of the host galaxy is the cause of the Seyfert 2 phenomenon. This implies that galactic extinction cannot be neglected when considering the classification of Seyfert galaxies.
1.2. NGC 7172
NGC 7172 is an edge on early-type spiral galaxy with a prominent dustlane crossing the galaxy from east to west (see Fig. 1). It is a member of the Hickson compact group HCG 90 at a redshift of 0.0087 (Sazonov et al. 2007). Marshall et al. (1979) identified NGC 7172 with the X-ray source H2158-321. Rubin (1974) stated that NGC 7172 is a normal galaxy, however, Sharples et al. (1984) analyzed X-ray, optical, NIR, and radio data and concluded that NGC 7172 is far more than a normal galaxy. They detected a steep rise in the continuum from J band up to the L band and an NIR excess typical of Seyfert galaxies. Variable NIR emission was observed on a three-month timescale. Additionally, they registered a spatial offset in the flux peaks between the optical and NIR data. According to Sharples et al. (1984), the NIR flux peak is situated 2″−3″ north of the optical flux peak.
Veron-Cetty & Veron (1986) obtained optical spectra with the 3.6m ESO telescope. They classified NGC 7172 as a Seyfert 2 galaxy owing to its lack of broad emission wings of the Hα line. They found a large amount of inner absorption probably caused by the dust lane. Lumsden et al. (2001) measured no broad emission lines in polarized light, they classified NGC 7172 as a NHBLR galaxy with a questionmark, however, owing to the poor signal-to-noise ratio (S/N).
NGC 7172 has been observed several times in the X-ray (Turner & Pounds 1989; Smith & Done 1996; Turner et al. 1997; Guainazzi et al. 1998; Dadina et al. 2001; Akylas et al. 2001; Risaliti 2002; Awaki et al. 2006; Noguchi et al. 2009). Guainazzi et al. (1998) analyzed ASCA observations from 1996. They noted that the flux level of NGC 7172 was about three times lower than one year before (also an ASCA observation). Additionally, they measured a 30% variation in flux on scales of hours during their observation. This short-term variability supports the idea that NGC 7172 harbors a Seyfert 1 nucleus. Guainazzi et al. (1998), Dadina et al. (2001), Akylas et al. (2001), Risaliti (2002), Awaki et al. (2006) all found a column density of ≲ 1023 cm-2, in addition to a short-term variability and a subsequent decline in the flux level. Dadina et al. (2001) report that the FeKα line does not decrease with the continuum, hence rule-out an accretion-disk origin of the line, which would cause the line strength to depend on the continuum, leading to a constant equivalent width (EW). However, Akylas et al. (2001) report a variability of the Fe line flux by a factor of two following the power-law flux, which implies that the Fe line originates near the nucleus. Awaki et al. (2006) note that NGC 7172 displays absorbed hard X-ray spectra with photon indices larger than 1 and an EW of the Fe line similar to those of Seyfert 1 galaxies.
Mid-infrared (MIR) observations detect carbonaceous dust absorption at 3.4 μm (Imanishi 2000). The polycyclic aromatic hydrocarbon (PAH) emission at 3.3 μm is detected in Moorwood (1986), whereas in Imanishi (2000) it is not because of the aperture size used. Moorwood (1986) used an aperture of  , whereas the apertures of Roche et al. (1991) and Imanishi (2000) are smaller than 4″. The PAH emission detected by Moorwood (1986) can be attributed to star-bursts in the galactic plane. This is supported by the radio map of Unger et al. (1987), which shows extended radio emission in the east-west direction. Therefore, Imanishi (2001) concludes that NGC 7172 is powered by a highly obscured AGN and is not contaminated by the nuclear starburst.
Thean et al. (2000) present a radio contour map of NGC 7172, which may detect an outflow to the south-west. Although the beam is elongated, the shape is comparable to the 12 μm map of Roche et al. (2007).
In this paper, we present the results of an NIR study of the Seyfert 2 galaxy NGC 7172. The adaptive-optics (AO) assisted integral field spectrograph (IFS) SINFONI yields three-dimensional (3D) (both spatial and spectral) information about the central 800 pc. This allows us the simultaneous study of the chemical composition, kinematics, and morphology of the central engine (AGN and bulge) of NGC 7172 with an 800 pc × 800 pc field of view (FOV).
2. Observation and data reduction
The observation was carried out with the AO-assisted ESO integral field spectrograph SINFONI mounted at Unit Telescope 4 (UT4, Yepun) of the Very Large Telescope (VLT: ESO, Chile)(Eisenhauer et al. 2003). The “optical nucleus” was used to perform the AO guiding. The average seeing was  . A 3″ × 3″ FOV with the 50 mas pixel scale was used. To minimize the risk of dead pixels in critical areas of the FOV we used a dithering sequence during which most of the integration time was spent on the source centered in the FOV. The 1′′ dithering was done in eight directions with a displacement of 45 degrees. Hence, the FOV increased to 4″ × 4″, but, the high S/N area decreased to about 2″ × 2″. In this central FOV of 2″ × 2″, data was acquired for the full integration time. The observing sequence used was the ...TST... nodding sequence (T: target, S: sky), to increase the on-source time. The grating chosen for this observation was the H + K band with an average spectral resolution of RH + K ≈ 1500. The overall integration time on the target source is 1300 s with an additional 650 s on sky.
The G2V star HIP − 111838 was observed subsequent to the science target observation. The star was observed twice (star in opposite corners of the FOV) with an integration time of 0.8 s. The standard star was used to perform flux calibration and to correct for telluric absorption in the atmosphere (tellurics). No sky observation was carried out for the standard star. The standard star was therefore calibrated by (i) subtraction of the two standard star observations (A–B and B–A); and (ii) averaging the subtracted data cubes.
After calibrating the standard star, the science target cube is divided by the spectrum of the star to help remove the atmospheric absorption features. The intrinsic emission and absorption features of the G2V star are corrected using a high S/N solar spectrum (Maiolino et al. 1996). The solar spectrum was convolved with a Gaussian in order to match the SINFONI resolution. The wavelength range of the solar spectrum does not include the bandgap between H&K band, which we account for by interpolating this part of the spectrum using that of a black body for a temperature T = 5800 K. Additionally, we introduced a Paα absorption feature into the interpolating region, since an emission feature appeared at the rest-frame wavelength of Paα in the telluric-corrected science spectrum.
The telluric absorption spectrum was extracted by summing up the pixels in a radius of three times the full width at half maximum (FWHM) of the point spread function (PSF) (Howell 2000), centered on the peakcenter of a two-dimensional (2D) Gaussian fit. The flux calibration was performed during the telluric correction procedure. The standard star counts at 2.16 μm were taken as a reference for the science target. The standard star magnitude for KS was taken from the 2MASS All-sky Point Source Catalogue, namely the value KS = 7.964, and converted into flux density units – fKS2MASS = 2.8 × 10⁻¹⁰ erg s-1 cm-2 μm-1 – using the Spitzer Science Center Magnitude to Flux Density converter1.
The reduction and cube reconstruction were carried out using the ESO SINFONI pipeline version 2.2.3, including gasgano 2.4.0. The version 2.2.1 of the SINFONI pipeline was first used. This version was unable to correct for the wavelength-dependent shift of the PSF, which was visible in the standard star cube. Switching through the wavelength channels of that cube showed that the star “moved” most prominently in the east-west direction. A 2D Gaussian fit in the H-band was centered one pixel farther to the east than that of the K-band. The FWHM = 2.4 pixels of this 2D Gaussian fit, hence the shift of the star was clearly visible. Additionally, the black-body shape of a G2V star could not be recognized in the uncorrected standard-star spectrum.
Version 2.2.3 of the SINFONI pipeline includes a correction for atmospheric refraction. The standard star shows less movement after the correction2, but, after reconstructing the science target cube in this way, grids became visible in the cube. The “sinfo_rec_jitter” recipe seems to have problems in reconstructing the cube. We therefore reconstructed the cube manually using our own IDL routines. Additionally, the cube was smoothed spatially to yield a higher S/N, using a boxcar function with a width of three pixels.
We extracted spectra and line-maps from the reconstructed 3D cube with IDL. The stellar analysis fits were also done using IDL (see Sect. 3).
2.1. The point spread function
The AO guiding was performed on the nucleus in the optical wavelength regime. As seen in Sect. 1.2 and Fig. 3, the “optical nucleus” is far from being a point source and is ≈2′′ south of the NIR nucleus. The observed standard star is a point source hence the PSF measured from the standard star is a “point” spread function and therefore the signal received by the AO can be corrected into a PSF. This yields a FWHM for the standard star PSF of ≈2.5 pixels or ≈23 pc. The “optical nucleus” yields instead an “extended” spread function to the AO system, which in return tries to correct the received signal into a PSF. Since the received signal is not a PSF, this cannot work properly. Therefore, we cannot use the standard star for PSF estimation. The spatial resolution was derived instead using the broad components of the Paα and Brγ emission lines. The BLR is assumed to be unresolved, hence the broad line emission is the most point-like emission within our FOV. We fitted a Gaussian function to the radial profiles of the detected lines. The result can be seen in Fig. 2. To choose the center of the linemaps, a centroid was fit first and the center was used as the central coordinate for the azimuthal average. The results show the expected improvement in the AO-corrected PSF from shorter to longer wavelengths since the AO is more effective at longer wavelengths. As seen in Fig. 2, a broad Brγ line has the most narrow radial profile. As the only line in H-band, [Fe ii] λ1.64 μm seems to have a narrower profile than the broad Paα line. However, Fig. 14 shows that the fit for [Fe ii] did not work very well. We therefore ignore [Fe ii] here, but display its fit in Fig. 2 for completeness.
The FWHM of broad Brγ is ≤ 9 pixel or  , which corresponds to physical scales of about 80 pc. This supports the detection of the BLR in NGC 7172 as seen in Sect. 3.2.1 and enables us to estimate the PSF, because the BLR has a typical size of <0.1 pc and therefore cannot be resolved in our observation. The major and minor axes of the PSF are aligned along the astrometric axis with a tilt of less than three degrees. This was evaluated by a 2D Gaussian fit, which also provides a low ellipticity of f ≈ 0.2 for the PSF whose major axis appears to be in the east-west direction. This is also reflected in Fig. 14 in the dispersion of the datapoints. Although we did have good weather conditions during the observation and used AO guiding, the PSF is quite broad. This can be attributed to the non-point-source character of the AO-guiding source. The AO loop was closed on the optical brightness peak of this galaxy, which is not a point source (see Fig. 3) but is extended. The AO has still improved the spatial resolution of the observation since the seeing was about (see Sect. 2).
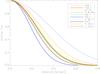 |
Fig. 2 Radial profiles of all detected emission lines and of the non-stellar H- and K-band continua at 1.6 μm and 2.2 μm, respectively. All profiles were normalized to a peak value 1. The radial profile data superimposed on the fits is presented in Fig. 14. |
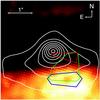 |
Fig. 3 SINFONI 4″ × 4″ FOV extracted from the HST F606W image (Malkan et al. 1998) overplotted with J-, H-, and K-band 2MASS contours (Jarrett et al. 2003). Blue, green, and red contours indicacte the J-, H-, and K-band flux when higher than the 99% flux peak contours. White shows the H-band contour of our observation at ≈ 1.6 μm. The contour levels describe the 10% level steps of the flux peak. |
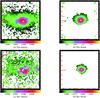 |
Fig. 4 Linemaps of Paαλ1.875 μm and Brγλ2.16 μm. The colorbar represents the flux in units of 10-16 Wm-2 μm-1. The X- and Y-axis show the right ascension and declination, respectively. a) and b) show the spatial distribution of Paα, whitespace falls under the 3-sigma criterion. c) and d) show Brγ, whitespace falls under a 1-sigma border. |
3. Results and discussion
The imaging spectroscopy of VLT SINFONI allows us to study the central 800 pc of NGC 7172 with a spatial resolution of about 80 pc. Several emission lines were identified in this observation (e.g. hydrogen recombination lines, molecular rotational/vibrational hydrogen lines, forbidden transitions of [Fe ii], and the coronal line [Si vi]). We analyze the continuum in the visible wavelength regime and in the NIR. Furthermore, we investigate the linemaps of the emission lines and the velocity maps of selected emission lines. A stellar population analysis of the observed region based on the composition of the continuum and stellar absorption lines (e.g. CO(2–0) λ2.29 μm, CO(6−3) λ1.61 μm, Si i λ1.59 μm) follows.
3.1. Continuum
The nuclear region (peak continuum flux) has a very red continuum in the spectrum of NGC 7172, which increases between the H- and K-band by about a magnitude. The K-band continuum at 2.2 μm is also more compact than the H-band continuum at 1.6 μm. The H-band continuum peaks in the same spatial region as the K-band continuum but has a much stronger contribution to the southern part of the FOV owing to the bright stellar emission.
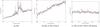 |
Fig. 5 Rest-frame single-pixel spectra around Paα and Brγ. Flux density is given in 10-16 Wm-2 μm-1. In a), Paα narrow and broad component were fitted simultaneously with two Gaussians, and for the continuum a linear fit was used. b) shows the same for Brγ with an extra Gaussian fit for the H2 line. c) Off-centered spectrum to show the unbiased narrow component of Brγ. Note that Brγ is about one magnitude fainter than Paα. |
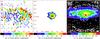 |
Fig. 6 AV maps determined in three different ways. Paα and Brγ line ratios were used for a) and b). Case B recombination was assumed for narrow and broad components. White space represents either negative extinction or we measured neither Paα nor Brγ flux. c) shows the extinction that was fitted by our routine (see Sect. 3.3). Note that it overlaps with the dustlane that crosses the galaxy from east to west (see Fig. 3). All colorbars have different scales. |
We can compare this with the 2MASS images in J-, H-, and K-bands (Jarrett et al. 2003). The pixel resolution of these images is 1″ per pixel and the spatial resolution is about 2″–3″ (Jarrett et al. 2003), although by overplotting the HST image with the contours of the J, H, and K 2MASS images, a shift of the nucleus becomes apparent (see Fig. 3). The nucleus moves to the north by more than 1″ going from the visible to the J-, H-, and K-band. We use the world coordinate system (WCS) to overplot the contours. In addition, we compare the contours of two foreground stars with those of the foreground stars in the HST image, finding that the contours of the former fit precisely those of the stars. The pointing accuracies of the VLT using SINFONI and of 2MASS are both about  . By overplotting the HST image with our K-band continuum contours, we note that our continuum peak lies again a few milliarcseconds to the north-east, although this can be attributed to the higher resolution of SINFONI (
 ) than for the 2MASS images (2″–3″). The nucleus of NGC 7172 appears to lie about 2″ north-east of the optical flux peak, as already mentioned by Sharples et al. (1984). This places the nucleus exactly behind the galactic dust lane, which makes it impossible for visible light to penetrate the dust.
Therefore, we conclude that observations in the visible (e.g., Veron-Cetty & Veron 1986) targeted either the outer parts of the narrow-line region (NLR), the extended NLR, or a starburst region, rather than the AGN of NGC 7172.
3.2. Emission lines
We discuss the observed emission lines in our H + K-band observation. We identified several emission lines in our spectra. The spectra have a resolution of R ≈ 2000 in K-band and R ≈ 1200 in H-band (measured from the atmospheric OH lines). All emission lines were extracted using a Gaussian fit. In the case of blended lines, a multi-component fit was applied. Only Paα has a S/N that fulfills the 3-σ criterion and gives us a hint of the gas distribution. Any other line shown here was fitted with a 1-σ noise exclusion criterion.
3.2.1. Recombination lines
We have detected the two recombination lines, Paα and Brγ in our H + K-band spectra. For the first time, a broad component was detected in NGC 7172, superposed on the narrow emission line of Paα and Brγ. The Paα line at λ1.89 μm (in the observer frame) falls in the bandgap between the H- and K-bands. Nevertheless, we had very stable observing conditions and the telluric correction worked very well. The noise in the bandgap region is still higher than in the bands, but the broad Paα line is clearly resolved (see Fig. 5a).
Figure 4a indicates the structure of the narrow component of Paα. East-west emission (wings in the linemap) is visible which follows the galaxy plane. The clumpy central region is brightest in emission in its south-western region. The wings are probably unaffected by nuclear activity. The central region, however, is much brighter than the wings, which is indicative of either a massive starburst in the central region or high AGN activity. The bandgap is, however, quiet noisy, but since Paα is very prominent the fit works very good (see Fig. 5a). In Fig. 5b, the Brγ narrow and broad component and H2(1–0)S(1) were fitted simultaneously, together with a linear continuum. The Brγ line has a similar structure to the Paα line. The wings in Paα can only be estimated for Brγ (see Fig. 4c). The brightest region is again a clumpy central region that is even more elongated towards the south-west than seen in Paα. The Paα broad component peaks in the same region as the continuum peak. The Brγ broad component peaks one pixel to the west because of the shift mentioned in Sect. 2. Figure 5 shows single pixel spectra of the brightest continuum pixel. The Paα, Brγ narrow and broad components and the molecular hydrogen H2(1–0)S(1) line were fitted. The residuals in the bandgap region lead to an overestimation of the FWHM of the Paα broad component. Therefore, we took the value from the central pixel (best S/N) and fixed the FWHM at 0.0356 μm = 5700 km s-1 for the line fits. The peak center was also fixed, since no variation is expected for the broad line on these scales. Owing to the low S/N in the Brγ region, we fixed the FWHM again to 0.0356 μm = 5700 km s-1 and the peak center of the broad component to 2.166 μm. The fixed values improved the fits visibly (i.e. the broad Brγ peak flux moves spatially closer to the continuum and the broad Paα peak flux, and the error improves by 10%).
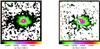 |
Fig. 7 Linemaps of the two molecular hydrogen lines at 1.95 μm and 2.12 μm. The colorbar represents the flux density in units of 10-16 Wm-2 μm-1. H2(1–0)S(1) is detected in a larger aperture around the central region. However, both linemaps look similar, with a peak around the nuclear region and elongated structures to the south-west. Whitespace falls under the 1-σ detection limit. |
Extinction estimation.
Using the hydrogen recombination lines, we estimated an extinction factor for the FOV of our observation. We followed Cardelli et al. (1989) using 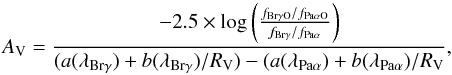 (1)with fBrγO,PaαO the observed flux, fBrγ/fPaα = 0.083, case B flux ratio for an electron density ne = 104 cm-3 and effective temperature T = 104 K (Osterbrock 1989), RV = 3.1, a(λ) = 0.574 × λ-1.61 and b(λ) = −0.527 × λ-1.61 are wavelength-dependent coefficients. Using the formula above, we created the extinction maps in Fig. 6. In the central region, the extinction is about 15–20 AV. A few pixels off-center to the south-west, the extinction values range from about 10 AV up to 40 AV. This high extinction in the off-centered parts would explain that Paα does not extend so far in that direction as Brγ does. The average extinction in the available region (i.e. where Brγ is detected and the ratio L(Paα)/L(Brγ) ≤ 12) is about 10 AV. This seems reasonable since the optically thick dustlane crosses exactly the available region. Similarly, we created an extinction map for the broad components. The formula in Eq. (1) was used, although the case B flux ratio had to be changed to fBrγ/fPaα = 0.087 for an electron density of ne = 108 cm-3 and a temperature of T = 104 K (Dopita & Sutherland 2003), since the electron density in BLRs reaches 109 cm-3. The extinction in the broad-line emission region reaches 35 AV. Figure 6c shows the extinction values from the continuum fit (see Sect. 3.3). The fitted values peak at about 11 mag, which is not as high as the extinction values estimated from the line ratios, but the fit obviously reproduces the dustlane spatially. Furthermore, except for the peaks, the linemaps in Figs. 6a and c do have similar values in the east wing of our FOV.
Black-hole mass estimation.
Longo et al. (1994) measured a stellar velocity dispersion of σ∗ = 180 ± 40 km s-1 and Awaki et al. (2006) a black hole mass of 8 × 10⁷ M⊙, whereas Bian & Gu (2007) inferred a black hole mass of 4.67 × 10⁷ M⊙ from a stellar velocity dispersion of 150–160 km s-1 (Garcia-Rissmann et al. 2005). We derived the black hole mass from the broad Paα component scaling the luminosity with our derived visual extinction value AV = 35 following Kim et al. (2010)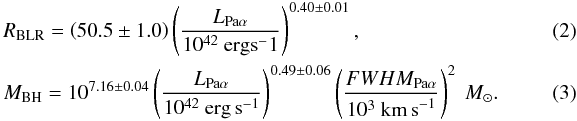 We calculated a luminosity for the broad Paα component of LPaα = 9.1 × 1041 erg s-1, which yields a BLR radius of 49 ± 1 light days. Furthermore, we used a FWHM of 5700 km s-1 to estimate the black hole mass of NGC 7172. We assumed 10% errors for both the luminosity and FWHM of Paα. The calculated black-hole mass is MBH = (4.5 ± 1.0) × 108 M⊙. This is a factor five higher than the mass derived by Awaki et al. (2006) and a factor ten higher than that of Garcia-Rissmann et al. (2005). However, Winter et al. (2009) gave a mass estimate of 2.04 × 10⁸ M⊙, which is in good agreement with our measurement. They used the M-L(star) relation to estimate the mass by disk-bulge decomposition with images from 2MASS.
 |
Fig. 8 The linemaps of [Fe ii] and [Si vi] are shown in panels a) and b), and the single pixel spectra and fits to these lines are shown in panels c) and d). A linear continuum contribution was assumed. The flux density is given in units of 10-16 W m-2 μm-1. The black contours in b) represent a VLA observation from Thean et al. (2000) at 8.4 GHz. The beam size is shown in the lower left corner (filled grey). |
3.2.2. Molecular hydrogen and forbidden line transitions
We detect two molecular hydrogen lines (H2(1–0)S(1)λ2.12 μm, H2(1–0)S(3)λ1.95 μm) and the forbidden line transitions of [Fe ii]λ1.644 μm and [Si vi]λ1.963 μm. Figures 8 and 5b show the spectra and the fits to these four lines, and the corresponding linemaps are shown in Figs. 7 and 8.
There are strong H2 emission lines in the central region. Faint emission in the east-western direction is detectable for H2(1–0)S(1). Both lines display a the typical south-western elongation, although the peak flux seems to be centered on the continuum and broad-line flux peaks (see Fig. 7). We note that H2(1–0)(S3) is spectrally in a noisier region than H2(1–0)(S1), as can be seen in the white space in the nuclear region and the spectrum (see Fig. 8d, 5b). As seen in Fig. 8, the forbidden line [Si vi] is very prominent and closely fitted, as seen in 8d (right-hand emission line). The left-hand line is the H2(1–0)S(3) line. The linemap (see Fig. 8b) shows a compact structure elongated to the south-west. The peak flux seems to be about 34 pc to the south-west from the continuum and broad-line flux peak. The detection of [Si vi] confirms the detection of the nucleus of NGC 7172 (Marconi et al. 1994) owing to its high ionization potential (>150 eV). We found that [Fe ii] is present but very faint. The linemap (Fig. 8a) shows a similar structure to [Si vi], but the S/N is not good enough to draw any conclusions. [Fe ii] is contaminated by the CO(7–4) absorption feature at 1.64 μm. Therefore, the fit shows high errors (>50%) which is visible in the noisy linemap. The line fit gives an error of about 30% only in the region around the brightest point visible in the linemap (see Fig. 8).
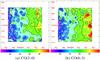 |
Fig. 9 Stellar velocity fitted to the two absorption features CO(2–0)λ2.29 μm and CO(6–3)λ1.62 μm. The FOV was masked to show the high S/N region, which gives comprehensible results. |
3.3. Stellar absorption lines
The H + K-band has some important absorption lines which are helpful in identifying the dominant stellar type (e.g. Mg i λ1.50 μm, Si i λ1.59 μm, CO(6–3) λ1.62 μm, Na i λλ2.206 μm,2.209 μm, Ca i λλ2.263 μm,2.266 μm, CO(3–1) λ2.323 μm).
The infrared is dominated by dust and stellar emission. For the H + K-band, the contribution of dust is mainly hot dust with a temperature from 800 K to 1400 K. The stellar types visible in the H + K-band are late stellar types (e.g. late G type stars, K and M type giants, and supergiants). These stars have photospheric temperatures from 3000 K to 5000 K and contribute with their red tale to the continuum. A power-law component might also have been detected in the continuum, since NGC 7172 is an AGN. However, the contribution will be rather small and constant in H + K-band, since the power law is only prominent at wavelengths shorter than 1 μm.
NGC 7172 is classified as a Seyfert 2 galaxy, which means, according to the UM, we should be looking at the torus from the outside (Antonucci 1993). However, the steep, red continuum observed in the continuum peak region (see Fig. 5) can only be produced by hot dust. This implies that we look through the torus to its inner region. The continuum fit was composed of the three probable continuum contributors: (hot) dust, starlight, and a power law. In addition, we included extinction. We used the screen model for extinction fitting  (4)where τ(λ) is the optical depth at wavelength λ. Following Cardelli et al. (1989), we used
 ![Mathematical equation: \begin{equation} \tau(\lambda)=-\frac{A_{\rm V}}{1.086}\times\left[\frac{0.574}{\lambda^{1.61}}-\frac{0.527}{\lambda^{1.61}R_{\rm V}}\right] , \end{equation}](/articles/aa/full_html/2012/08/aa18256-11/aa18256-11-eq106.png) (5)with RV = 3.1, which is the standard value for a diffuse interstellar medium. For the hot dust contribution, we used the Planck function
(5)with RV = 3.1, which is the standard value for a diffuse interstellar medium. For the hot dust contribution, we used the Planck function  (6)with a scale factor phd. For the nuclear contribution, we used a simple power-law fit
  (7)with the power-law index α and scale factor ppl. For stellar contribution, we fitted a stellar template to the spectrum. This makes the fit more accurate than a pure-black body stellar contribution because the scale of this spectrum is the only additional parameter. The power-law contribution is very low, but non-zero, and almost constant. We used the stellar templates from the NASA Infrared Telescope Facility (IRTF) spectral library for cool stars (Rayner et al. 2009). The library consists of 210 spectra of F, G, K, and M spectral type stars. The spectra cover a wavelength range from 0.8 μm to 5 μm at a spectral resolution of about 2000 and are not normalized.
The stellar spectrum has to be convolved with a Gaussian to account for the possible shifts and broadening of the absorption lines (i.e. Doppler displacement and broadening due to velocity dispersion). We therefore fit the stellar spectrum by convolving it with a Gaussian  The fitting was done using IDL and an AMOEBA minimization. The fit function used was
 ![Mathematical equation: \begin{eqnarray} conti_{fit}(A_{\rm V},p_{\rm hd},T,p_{\rm pl},\alpha,p_{\rm star},\sigma,\Delta\lambda)&=&\\ ext(A_{\rm V})\times[P(p_{\rm hd},T)+pl(p_{\rm pl},\alpha)&+&star_*(p_{\rm star},\sigma,\Delta\lambda)] \nonumber \label{eq:} \end{eqnarray}](/articles/aa/full_html/2012/08/aa18256-11/aa18256-11-eq112.png) (10)with the seven fitting parameters AV visual extinction, phd scale factor, T temperature of the hot dust black body, ppl power-law scale, α power-law coefficient, pstar scale factor for the stellar template, σ Gaussian sigma, and Δλ the Doppler displacement. We first fitted most of the stars to our galactic spectra to check which fit was the best. The supergiant HD 216946, which is an M0Iab variable star (Levesque et al. 2005; Messina 2007), matched all the absorption features such that the residual spectrum was flat. The predominant stellar type consists of old giants with a surface temperature of less than 4000 K (see also Cid Fernandes et al. 2004), which we expected since the H2(1−0)S(1)/Brγ ratio is too high for a starburst. However, local short-lived starbursts as found for instance by Davies et al. (2007) at less than 50pc from the nucleus cannot be excluded owing to the lack of spatial resolution. An example for the fits is shown in Fig. 11. The typical fractions on nucleus in the H-band are ≈7%, ≈20%−30%, and ≈60%−70% for a power-law, stellar, and (hot) dust contribution, respectively. In the K-band, for fractions of ≤5%, ≤20%, and ≥80% in the case of a power-law, stellar, and (hot) dust contribution respectively, we infer a higher dust and lower stellar fraction, the power law component is almost constant.
(10)with the seven fitting parameters AV visual extinction, phd scale factor, T temperature of the hot dust black body, ppl power-law scale, α power-law coefficient, pstar scale factor for the stellar template, σ Gaussian sigma, and Δλ the Doppler displacement. We first fitted most of the stars to our galactic spectra to check which fit was the best. The supergiant HD 216946, which is an M0Iab variable star (Levesque et al. 2005; Messina 2007), matched all the absorption features such that the residual spectrum was flat. The predominant stellar type consists of old giants with a surface temperature of less than 4000 K (see also Cid Fernandes et al. 2004), which we expected since the H2(1−0)S(1)/Brγ ratio is too high for a starburst. However, local short-lived starbursts as found for instance by Davies et al. (2007) at less than 50pc from the nucleus cannot be excluded owing to the lack of spatial resolution. An example for the fits is shown in Fig. 11. The typical fractions on nucleus in the H-band are ≈7%, ≈20%−30%, and ≈60%−70% for a power-law, stellar, and (hot) dust contribution, respectively. In the K-band, for fractions of ≤5%, ≤20%, and ≥80% in the case of a power-law, stellar, and (hot) dust contribution respectively, we infer a higher dust and lower stellar fraction, the power law component is almost constant.
3.4. Kinematics
NGC 7172 is seen almost edge on (see Fig. 1), hence we are able to derive velocity maps from several emission lines (i.e. Paα and H2(1–0)S(1)) and our stellar fit. All velocity maps show a rotation going from east to west (see Fig. 12). The Paα velocity map display disky rotation from east to west, whereas H2(1–0)S(1) the structure is more complex. The red side shows a strong gradient until about –150 km s-1, whereas the blue side shows an arm extending from the central region to the east. However, the arm is in a region of low flux. The FWHM of these lines shows no indication of a jet, i.e. neither intermediate broadening of emission lines nor blue/red shifted wings (e.g. in the south-west direction where most of the emission lines peak). There is an increase in the FWHM to the south-west, but the corresponding velocities are about 300–350 km s-1. [Si vi] shows a higher velocity region near the continuum peak flux of about 450 km s-1. The rotational velocity of [Si vi] is much lower than the velocity of H2 but is similar to Paα in the detected region (mainly the negative velocity wing). Since [Si vi] can only be ionized close to the nucleus and in a low electron density environment the region lies somewhere between the BLR and NLR.
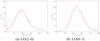 |
Fig. 10 Pixel distribution of the stellar velocity dispersion from our continuum fit. a) shows the σ ∗ fitted to CO(2–0) overlayed by a fitted Gaussian. b) shows the same but for the CO(6–3) fit. The fitted velocity dispersions were sorted and binned with a bin size of ten km s-1. The velocities at the Gaussian peaks were used for the black-hole mass estimation. |
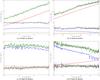 |
Fig. 11 The spectra show our continuum fit to the galactic spectrum. Shown are the galactic spectrum and the residual spectrum in black. The red line represents the black body fit for (hot) dust. The blue line represents the chosen stellar template. The yellow line was included to represent an almost not notable power law contribution. The green line shows the fit of these three components combined. We note that for the on nucleus spectra a) and b) the residual was moved from 0 to 5 due to presentation effects. |
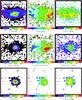 |
Fig. 12 From top to bottom Paα, H2 and Si vi are displayed. From left to right the flux, the line of sight velocity and the line of sight velocity dispersion are shown. The flux is given in units of 10-16 Wm-2 μm-1 and the velocities in km s-1. Note that the FWHM values were not corrected for instrumental broadening (see Table 1). The contours in the velocity maps represent –150, –100, –50, 0, 50, 100, 150 km s-1. |
The stellar velocity maps also display a rotation. The velocity distribution is similar to that of the gas implying that the gas follows the gravitational field induced by the stars. We find that the fitted stellar velocity dispersion distribution peaks at 245 ± 70 km s-1 for CO(6–3) and at 190 ± 70 km s-1 for CO(2–0) (see Fig. 10), the error is the measured Gaussian sigma of the best fit. A “central” velocity dispersion cannot be determined since the very strong and red continuum fills up the band heads precluding an accurate measurement (see Fig. 11a, b). The largest contiguous σ∗-region is measured in the south-western region (optical flux peak) because the continuum is least affected there. The K-band σ∗ does not have to be corrected for instrumental dispersion because the stellar template has a resolution of 2000, which is similar to our K-band resolution. Nevertheless, the H-band data have to be corrected since the resolution there is only about 1200. For our σ∗ of CO(6–3), this means a velocity dispersion of 210 ± 70 km s-1. Both values agree with the literature values of Longo et al. (1994) and Garcia-Rissmann et al. (2005) within the error bars, but seem to be systematically higher. Using the equation from Merritt & Ferrarese (2001), we can derive a black hole mass from the M-σ∗ relation 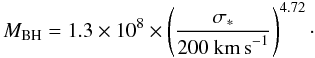 (11)Using the σ∗ given above, we derive an upper limit to the black hole mass of MBH ↓ = 3 × 10⁸ M⊙ for CO(2–0) and 5 × 10⁸ M⊙ for CO(6–3). This is in good agreement with our former estimation of the black hole mass of 4.5 × 10⁸ M⊙ from the luminosity and FWHM of the broad Paα line (see Sect. 3.2).
We also estimate a value for the dynamical mass Mdyn. We assume a fully edge-on disk and purely rotational velocity in the velocity maps in Fig. 9a, and use the velocity dispersion estimated above (see Fig. 10). We use the virial theorem and correct for the velocity dispersion (e.g., Davies et al. 2007) 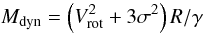 (12)where R is the radius of the enclosed mass and γ the gravitational constant. We determine a dynamical mass Mdyn = 9 × 10⁹ M⊙ for a radius of
  corresponding to ≈ 280 pc in physical scales, a rotational velocity of 150 km s-1, and a velocity dispersion of σ∗ = 200 km s-1 (which is the average of the values for CO(2–0) and CO(6–3)). We note that this is only a rough estimate of Mdyn, since we make critical a priori assumptions about the rotation and the disk structure. We, therefore, assume an error of 1 mag3.
4. Summary and conclusions
In the NIR (H + K-band), we have detected the active nucleus of NGC 7172 behind the galactic dust veil crossing the galaxy in the east-west direction. The assumption is supported by the detection of the [Si vi] and broad emission lines of Paα and Brγ. We have shown that the nucleus of the galaxy appears to be displaced by up to 2″ between optical and NIR wavelengths, illustrating the capabilities of NIR observations to penetrate dust clouds. This explains the low ionization lines in the optical spectra of Veron-Cetty & Veron (1986), since the pointing of their observation was systematically biased towards a part of the extended NLR or at a starburst region that is not hidden by the dust veil. In addition, the line ratio diagram of log ( [Fe ii] /Paβ) to log (H2/Brγ) (see Fig. 13) indicates an AGN ionizing mechanism. Furthermore, the velocity maps indicate that the nucleus (marked as a dark cross) lies on the 0 km s-1 contour line. However, the narrow emission lines do not peak spatially in the same region as the continuum and the broad emission lines. Their peak flux occurs about 35 pc (≈ ) to the south-west of the nucleus. Although, the PSF is twice as broad this may give a hint of the geometric appearance of the inner 50–100 pc of NGC 7172. Our kinematical analysis is consistent with our results. The black hole is located at the zero contour line in all the velocity maps except for Paα, which is in-between the 0 and 50 km s-1 line contours.
Emission lines.
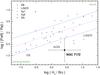 |
Fig. 13 Line-ratio diagram of log ([Fe ii] /Paβ) over log (H2/Brγ). The flux values are taken from a 0 |
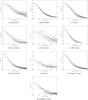 |
Fig. 14 The radial profile fits of all detected emission lines including non-stellar H- and K-band continuum at 1.6 μm and 2.2 μm. Crosses mark the data points and line plots are the fitted Gaussian to the shown data points. |
Owing to the qualitatively lower line-of-sight velocity of Paα than for H2(1–0)(S1), the question arises of whether these lines represent different rotational behaviors. The difference between the line velocity fields could be explained by the extinction of the galaxy. The Paα and H2(1–0)(S1) lines are separated by 0.25 μm. Taking into account that there is a significant amount of extinction, we would be looking deeper into the galaxy at the H2 line. However, the difference can also be attributed to radial motions, which would produce slightly different velocity fields. Further observations of hydrogen recombination and molecular lines and a modeling of the velocity fields of NGC 7172 is required – and in preparation – to study the kinematics of hydrogen and molecular clouds and dust. This will provide us with a clearer understanding of the structure of the innermost region of NGC 7172 and how the central black hole is fed.
The velocity dispersion of the stellar fit can reproduce the value of 180 ± 40 km s-1 from Longo et al. (1994) within the error bars, but is consequently higher at a maximum of about 210 km s-1 when measured for CO(6–3). The dispersion value seems to favor a higher velocity dispersion than the value by Garcia-Rissmann et al. (2005), who measured a dispersion of 154–160 km s-1.
We have estimated the black hole mass from the R − L relation (Kim et al. 2010) for the broad Paα line and from the M − σ∗ relation (Merritt & Ferrarese 2001) with consistent results.
We have detected a very red spectrum in the central region, which can only be produced by hot dust with effective temperatures of 900–1200 K and most probably originates in the torus surrounding the AGN (Antonucci 1993). The emission is dominated by the inner parts of the torus, where our fitted temperatures for the central region reach 1300 K, near the sublimation temperature for dust grains. The detection of the BLR in NGC 7172 implies that this galaxy is of Seyfert 1 type. The NLR and BLR fluxes do not peak in the same spatial pixel. This may be a consequence of the broad PSF in combination with a spatially varying extinction and a spatially extended NLR. The PSF smears out the photons coming from the NLR and shifts the peak flux to the south-west. An inclination of the torus is still required, since the NLR is smeared to the south-west and we see no emission in the northern region. The torus would then be slightly tilted so that one opening is directed to the south-west. From our data, the inclination of the torus structure cannot be assumed.
Thean et al. (2000) observed NGC 7172 as part of a sample of 87 mid-infrared selected AGN from Rush et al. (1993) at 8.4-GHz with the VLA A-configuration. The radio map shows, as in our NIR observation, an elongation to the south-west. The resolution of the VLA observation is at 0.25′′ similar to our observation. The VLA map indicates that the peak flux position is offset from that of our continuum peak flux by about 0 6. However, by aligning the VLA contour maximum with our continuum emission peak (see Fig. 8b), a correlation between the [Si vi] coronal line and the VLA observation becomes obvious. The VLA observation confirms our detection behind the dust veil (before and after aligning the contours). Furthermore, it resembles the south-west elongated structure of the emission lines, which is indicative of either a jet or outflow in this direction.
As already mentioned, the line ratio diagram in Fig. 13 presents evidence of AGN excitation (mixed shock- and photoionization). The H2 emission is far more intense than that of Brγ to be excited by an intense starburst, although local starbursts may be responsible owing to the limited spatial resolution. The flux ratio lies outside the 1-σ prediction band. However, the data point was not corrected for extinction, which would yield a higher [Fe ii] flux and therefore move the data point towards the 1-σ prediction band. In addition, [Fe ii] is heavily contaminated by CO(7–4) absorption (see Fig. 8c), whose correction would again push the data point further towards the 1-σ prediction band.
We do not recognize any sign of a massive starburst e.g., as given by an H2/γ < 0.5 ratio, in bright off-centered continuum sources. Therefore, we exclude starbursts on scales of >100 pc in the central region. Nonetheless, nuclear starbursts similiar to those described by Davies et al. (2007) on spatial scales of <50 pc cannot be excluded. There seem to be up to two regions within these scales that have a higher stellar luminosity than their vicinity, but both regions are spatially unresolved, hence no attempts were made to study these regions in more detail.
These results now classify NGC 7172 as a Seyfert 1 galaxy. Hence, following the UM, the torus has to be aligned face on and therefore the galaxy cannot be aligned towards the observer. Following this argumentation, galactic extinction caused by the dustlane is the reason for the lack of broad lines (e.g., Hα and Hβ) in the optical (Veron-Cetty & Veron 1986). The slight offset of the narrow line peaks with respect to the broad components, however, indicates that the torus is at least not fully face on but has some inclination. This suggests that the torus is inclined in such a way that the NLR appears to be shifted from being centered on the nucleus to the south-western direction. We also note that NGC 7172 was classified as an NHBLR galaxy (Lumsden et al. 2001) probably due to the lack of collimated dust grains along the line of sight, supporting our thesis that the torus is almost face-on and the extinction comes from the host galaxy.
Shen et al. (2010) and Lagos et al. (2011) show that there are more Seyfert 2 galaxies in edge-on host galaxies than Seyfert 1’s and studying NGC 7172 in the optical yields a Seyfert 2 galaxy. However, a BLR may still be hidden behind the dustlane. The detection of a BLR in an NHBLR galaxy raises the question of how biased samples of Seyfert 2 galaxies are. At least for some edge-on galaxies where the galactic plane extincts and heavily reddens the spectrum from the nucleus (i.e. high column density towards the nucleus), this may be a non-negligible fraction. Therefore, this work and others (i.e., Blanco et al. 1990; Davies et al. 2007) has some implications for the results of optical studies such as the results of Shen et al. (2010) and Lagos et al. (2011). Further investigation of this type of galaxies should be made using optical and NIR data.
The correction helps to remove the movement of the star but does not do so completely.
Our first bulge-disk decompositions performed using BUDDA (de Souza et al. 2004) yield a half-light radius of RHL = 1.1 kpc. This gives a dynamical mass Mdyn of the order of 1010 to 1011 (Colina et al. 2005) with Mdyn(stars) > Mdyn(gas). The decomposition was done on the 2MASS K-band image of Jarrett et al. (2003).
Acknowledgments
The authors kindly thank the anonymous referee for fruitful comments and suggestions. This work was supported in part by the German Deutsche Forschungsgemeinschaft, DFG project number SFB 956 and by the German Bundesministerium für Forschung und Bildung, BMBF project number 05A08PKA.
References
- Akylas, A., Georgantopoulos, I., & Comastri, A. 2001, MNRAS, 324, 521 [NASA ADS] [CrossRef] [Google Scholar]
- Antonucci, R. 1993, ARA&A, 31, 473 [Google Scholar]
- Awaki, H., Murakami, H., Ogawa, Y., & Leighly, K. M. 2006, ApJ, 645, 928 [NASA ADS] [CrossRef] [Google Scholar]
- Bian, W., & Gu, Q. 2007, ApJ, 657, 159 [NASA ADS] [CrossRef] [Google Scholar]
- Binette, L. 1998, MNRAS, 294, L47 [NASA ADS] [CrossRef] [Google Scholar]
- Blanco, P. R., Ward, M. J., & Wright, G. S. 1990, MNRAS, 242, 4P [NASA ADS] [CrossRef] [Google Scholar]
- Cardelli, J. A., Clayton, G. C., & Mathis, J. S. 1989, ApJ, 345, 245 [NASA ADS] [CrossRef] [Google Scholar]
- Cid Fernandes, R., Sodré, L., Schmitt, H. R., & Leão, J. R. S. 2001, MNRAS, 325, 60 [NASA ADS] [CrossRef] [Google Scholar]
- Cid Fernandes, R., Gu, Q., Melnick, J., et al. 2004, MNRAS, 355, 273 [NASA ADS] [CrossRef] [Google Scholar]
- Colina, L., Arribas, S., & Monreal-Ibero, A. 2005, ApJ, 621, 725 [NASA ADS] [CrossRef] [Google Scholar]
- Dadina, M., Bassani, L., Cappi, M., et al. 2001, A&A, 370, 70 [NASA ADS] [CrossRef] [EDP Sciences] [Google Scholar]
- Dale, D. A., Roussel, H., Contursi, A., et al. 2004, ApJ, 601, 813 [NASA ADS] [CrossRef] [Google Scholar]
- Davies, R. I., Thomas, J., Genzel, R., et al. 2006, ApJ, 646, 754 [NASA ADS] [CrossRef] [Google Scholar]
- Davies, R. I., Müller Sánchez, F., Genzel, R., et al. 2007, ApJ, 671, 1388 [NASA ADS] [CrossRef] [Google Scholar]
- de Souza, R. E., Gadotti, D. A., & dos Anjos, S. 2004, ApJS, 153, 411 [NASA ADS] [CrossRef] [Google Scholar]
- Dopita, M. A., & Sutherland, R. S. 2003, Astrophysics of the diffuse universe (Berlin, New York: Springer) [Google Scholar]
- Eisenhauer, F., Abuter, R., Bickert, K., et al. 2003, in SPIE Conf. Ser. 4841, ed. M. Iye, & A. F. M. Moorwood, 1548 [Google Scholar]
- Garcia-Rissmann, A., Vega, L. R., Asari, N. V., et al. 2005, MNRAS, 359, 765 [NASA ADS] [CrossRef] [Google Scholar]
- González Delgado, R. M., Heckman, T., & Leitherer, C. 2001, ApJ, 546, 845 [NASA ADS] [CrossRef] [Google Scholar]
- Guainazzi, M., Matt, G., Antonelli, L. A., et al. 1998, MNRAS, 298, 824 [NASA ADS] [CrossRef] [Google Scholar]
- Ho, L. C. 2008, ARA&A, 46, 475 [NASA ADS] [CrossRef] [Google Scholar]
- Howell, S. B. 2000, Handbook of CCD Astronomy (Cambridge University Press) [Google Scholar]
- Hunt, L. K., & Malkan, M. A. 2004, ApJ, 616, 707 [NASA ADS] [CrossRef] [Google Scholar]
- Imanishi, M. 2000, MNRAS, 319, 331 [NASA ADS] [CrossRef] [Google Scholar]
- Imanishi, M. 2001, AJ, 121, 1927 [NASA ADS] [CrossRef] [Google Scholar]
- Jarrett, T. H., Chester, T., Cutri, R., Schneider, S. E., & Huchra, J. P. 2003, AJ, 125, 525 [NASA ADS] [CrossRef] [Google Scholar]
- Kim, D., Im, M., & Kim, M. 2010, AJ, 724, 386 [Google Scholar]
- Kormendy, J., & Kennicutt, Jr., R. C. 2004, ARA&A, 42, 603 [NASA ADS] [CrossRef] [Google Scholar]
- Lagos, C. D. P., Padilla, N. D., Strauss, M. A., Cora, S. A., & Hao, L. 2011, MNRAS, 414, 2148 [NASA ADS] [CrossRef] [Google Scholar]
- Larkin, J. E., Armus, L., Knop, R. A., Soifer, B. T., & Matthews, K. 1998, ApJS, 114, 59 [NASA ADS] [CrossRef] [Google Scholar]
- Levesque, E. M., Massey, P., Olsen, K. A. G., et al. 2005, ApJ, 628, 973 [NASA ADS] [CrossRef] [Google Scholar]
- Longo, G., Busarello, G., Lorenz, H., Richter, G., & Zaggia, S. 1994, A&A, 282, 418 [NASA ADS] [Google Scholar]
- Lumsden, S. L., Heisler, C. A., Bailey, J. A., Hough, J. H., & Young, S. 2001, MNRAS, 327, 459 [NASA ADS] [CrossRef] [Google Scholar]
- Magorrian, J., Tremaine, S., Richstone, D., et al. 1998, AJ, 115, 2285 [NASA ADS] [CrossRef] [Google Scholar]
- Maiolino, R., Rieke, G. H., & Rieke, M. J. 1996, AJ, 111, 537 [NASA ADS] [CrossRef] [Google Scholar]
- Malkan, M. A., Gorjian, V., & Tam, R. 1998, ApJS, 117, 25 [NASA ADS] [CrossRef] [Google Scholar]
- Marconi, A., Moorwood, A. F. M., Salvati, M., & Oliva, E. 1994, A&A, 291, 18 [NASA ADS] [Google Scholar]
- Marshall, F. E., Boldt, E. A., Holt, S. S., et al. 1979, ApJS, 40, 657 [NASA ADS] [CrossRef] [Google Scholar]
- Merritt, D., & Ferrarese, L. 2001, ApJ, 547, 140 [NASA ADS] [CrossRef] [Google Scholar]
- Messina, S. 2007, New Astron., 12, 556 [NASA ADS] [CrossRef] [Google Scholar]
- Moorwood, A. F. M. 1986, A&A, 166, 4 [NASA ADS] [Google Scholar]
- Müller-Sánchez, F., Prieto, M. A., Hicks, E. K. S., et al. 2011, ApJ, 739, 69 [NASA ADS] [CrossRef] [Google Scholar]
- Murayama, T., & Taniguchi, Y. 1998, ApJ, 497, L9 [NASA ADS] [CrossRef] [Google Scholar]
- Noguchi, K., Terashima, Y., & Awaki, H. 2009, ApJ, 705, 454 [NASA ADS] [CrossRef] [Google Scholar]
- Nussbaumer, H., & Storey, P. J. 1988, A&A, 193, 327 [NASA ADS] [Google Scholar]
- Osterbrock, D. E. 1989, Astrophysics of Gaseous Nebulae and Active Galactic Nuclei (University Science Books) [Google Scholar]
- Page, M. J., Stevens, J. A., Mittaz, J. P. D., & Carrera, F. J. 2001, Science, 294, 2516 [NASA ADS] [CrossRef] [PubMed] [Google Scholar]
- Prieto, M., Marco, O., & Gallimore, J. 2005, MNRAS, 364, L28 [NASA ADS] [Google Scholar]
- Ramolla, M., Haas, M., Bennert, V. N., & Chini, R. 2011, A&A, 530, 147 [Google Scholar]
- Rayner, J. T., Cushing, M. C., & Vacca, W. D. 2009, ApJS, 185, 289 [NASA ADS] [CrossRef] [Google Scholar]
- Risaliti, G. 2002, A&A, 386, 379 [NASA ADS] [CrossRef] [EDP Sciences] [Google Scholar]
- Roche, P. F., Aitken, D. K., Smith, C. H., & Ward, M. J. 1991, MNRAS, 248, 606 [NASA ADS] [CrossRef] [Google Scholar]
- Roche, P. F., Packham, C., Aitken, D. K., & Mason, R. E. 2007, MNRAS, 375, 99 [NASA ADS] [CrossRef] [Google Scholar]
- Rodríguez-Ardila, A., Pastoriza, M. G., Viegas, S., Sigut, T. A. A., & Pradhan, A. K. 2004, A&A, 425, 457 [NASA ADS] [CrossRef] [EDP Sciences] [Google Scholar]
- Rodríguez-Ardila, A., Riffel, R., & Pastoriza, M. G. 2005, MNRAS, 364, 1041 [NASA ADS] [CrossRef] [Google Scholar]
- Rubin, V. C. 1974, ApJ, 191, 645 [NASA ADS] [CrossRef] [Google Scholar]
- Rush, B., Malkan, M. A., & Spinoglio, L. 1993, ApJS, 89, 1 [NASA ADS] [CrossRef] [Google Scholar]
- Sazonov, S., Revnivtsev, M., Krivonos, R., Churazov, E., & Sunyaev, R. 2007, A&A, 462, 57 [NASA ADS] [CrossRef] [EDP Sciences] [Google Scholar]
- Schawinski, K., Thomas, D., Sarzi, M., et al. 2007, MNRAS, 382, 1415 [NASA ADS] [CrossRef] [Google Scholar]
- Sharples, R. M., Longmore, A. J., Hawarden, T. G., & Carter, D. 1984, MNRAS, 208, 15 [NASA ADS] [CrossRef] [Google Scholar]
- Shen, S., Shao, Z., & Gu, M. 2010, ApJ, 725, L210 [NASA ADS] [CrossRef] [Google Scholar]
- Smith, D. A., & Done, C. 1996, MNRAS, 280, 355 [NASA ADS] [CrossRef] [Google Scholar]
- Storchi-Bergmann, T. 2006, Rev. Mex. Astron. Astrofis. Ser. Conf., 26, 135 [NASA ADS] [Google Scholar]
- Storchi-Bergmann, T., González Delgado, R. M., Schmitt, H. R., Cid Fernandes, R., & Heckman, T. 2001, ApJ, 559, 147 [NASA ADS] [CrossRef] [Google Scholar]
- Thean, A., Pedlar, A., Kukula, M. J., Baum, S. A., & O’Dea, C. P. 2000, MNRAS, 314, 573 [Google Scholar]
- Thompson, T. A., Quataert, E., & Murray, N. 2005, ApJ, 630, 167 [NASA ADS] [CrossRef] [Google Scholar]
- Tremaine, S., Gebhardt, K., Bender, R., et al. 2002, ApJ, 574, 740 [NASA ADS] [CrossRef] [Google Scholar]
- Turner, T. J., & Pounds, K. A. 1989, MNRAS, 240, 833 [NASA ADS] [CrossRef] [Google Scholar]
- Turner, T. J., George, I. M., Nandra, K., & Mushotzky, R. F. 1997, ApJS, 113, 23 [NASA ADS] [CrossRef] [Google Scholar]
- Unger, S. W., Lawrence, A., Wilson, A. S., Elvis, M., & Wright, A. E. 1987, MNRAS, 228, 521 [NASA ADS] [Google Scholar]
- Veron-Cetty, M., & Veron, P. 1986, A&AS [Google Scholar]
- Wada, K., & Norman, C. A. 2002, ApJ, 566, L21 [NASA ADS] [CrossRef] [Google Scholar]
- Wang, J., & Zhang, E. 2007, ApJ, 660, 1072 [NASA ADS] [CrossRef] [Google Scholar]
- Winter, L. M., Mushotzky, R. F., Reynolds, C. S., & Tueller, J. 2009, ApJ, 690, 1322 [NASA ADS] [CrossRef] [Google Scholar]
- Zhang, E., & Wang, J. 2006, ApJ, 653, 137 [NASA ADS] [CrossRef] [Google Scholar]
- Zuther, J., Iserlohe, C., Pott, J., et al. 2007, A&A, 466, 451 [NASA ADS] [CrossRef] [EDP Sciences] [Google Scholar]
All Tables
All Figures
|
Fig. 1 Hubble Space Telescope (HST) F606W image of NGC 7172 (Malkan et al. 1998). The image shows the galaxy NGC 7172 in the visible at 6030 Å. The brightness scale is non-linear such that the edges of the galaxy can be recognized. The small square shows the 4″ × 4″ FOV of our SINFONI observation. The zoom in the upper left corner of the HST image shows this region on a linear brightness scale. Note that the brightest point in the detailed image is the brightest visible point of the galaxy. The dust lane crossing the central region is clearly visible as a dark lane. Note that north of the dust lane is very faint compared to the southern part. The dust lane itself shows 1/30 of the brightness of the brightest point in the visible. |
| In the text | |
|
Fig. 2 Radial profiles of all detected emission lines and of the non-stellar H- and K-band continua at 1.6 μm and 2.2 μm, respectively. All profiles were normalized to a peak value 1. The radial profile data superimposed on the fits is presented in Fig. 14. |
| In the text | |
|
Fig. 3 SINFONI 4″ × 4″ FOV extracted from the HST F606W image (Malkan et al. 1998) overplotted with J-, H-, and K-band 2MASS contours (Jarrett et al. 2003). Blue, green, and red contours indicacte the J-, H-, and K-band flux when higher than the 99% flux peak contours. White shows the H-band contour of our observation at ≈ 1.6 μm. The contour levels describe the 10% level steps of the flux peak. |
| In the text | |
|
Fig. 4 Linemaps of Paαλ1.875 μm and Brγλ2.16 μm. The colorbar represents the flux in units of 10-16 Wm-2 μm-1. The X- and Y-axis show the right ascension and declination, respectively. a) and b) show the spatial distribution of Paα, whitespace falls under the 3-sigma criterion. c) and d) show Brγ, whitespace falls under a 1-sigma border. |
| In the text | |
|
Fig. 5 Rest-frame single-pixel spectra around Paα and Brγ. Flux density is given in 10-16 Wm-2 μm-1. In a), Paα narrow and broad component were fitted simultaneously with two Gaussians, and for the continuum a linear fit was used. b) shows the same for Brγ with an extra Gaussian fit for the H2 line. c) Off-centered spectrum to show the unbiased narrow component of Brγ. Note that Brγ is about one magnitude fainter than Paα. |
| In the text | |
|
Fig. 6 AV maps determined in three different ways. Paα and Brγ line ratios were used for a) and b). Case B recombination was assumed for narrow and broad components. White space represents either negative extinction or we measured neither Paα nor Brγ flux. c) shows the extinction that was fitted by our routine (see Sect. 3.3). Note that it overlaps with the dustlane that crosses the galaxy from east to west (see Fig. 3). All colorbars have different scales. |
| In the text | |
|
Fig. 7 Linemaps of the two molecular hydrogen lines at 1.95 μm and 2.12 μm. The colorbar represents the flux density in units of 10-16 Wm-2 μm-1. H2(1–0)S(1) is detected in a larger aperture around the central region. However, both linemaps look similar, with a peak around the nuclear region and elongated structures to the south-west. Whitespace falls under the 1-σ detection limit. |
| In the text | |
|
Fig. 8 The linemaps of [Fe ii] and [Si vi] are shown in panels a) and b), and the single pixel spectra and fits to these lines are shown in panels c) and d). A linear continuum contribution was assumed. The flux density is given in units of 10-16 W m-2 μm-1. The black contours in b) represent a VLA observation from Thean et al. (2000) at 8.4 GHz. The beam size is shown in the lower left corner (filled grey). |
| In the text | |
|
Fig. 9 Stellar velocity fitted to the two absorption features CO(2–0)λ2.29 μm and CO(6–3)λ1.62 μm. The FOV was masked to show the high S/N region, which gives comprehensible results. |
| In the text | |
|
Fig. 10 Pixel distribution of the stellar velocity dispersion from our continuum fit. a) shows the σ ∗ fitted to CO(2–0) overlayed by a fitted Gaussian. b) shows the same but for the CO(6–3) fit. The fitted velocity dispersions were sorted and binned with a bin size of ten km s-1. The velocities at the Gaussian peaks were used for the black-hole mass estimation. |
| In the text | |
|
Fig. 11 The spectra show our continuum fit to the galactic spectrum. Shown are the galactic spectrum and the residual spectrum in black. The red line represents the black body fit for (hot) dust. The blue line represents the chosen stellar template. The yellow line was included to represent an almost not notable power law contribution. The green line shows the fit of these three components combined. We note that for the on nucleus spectra a) and b) the residual was moved from 0 to 5 due to presentation effects. |
| In the text | |
|
Fig. 12 From top to bottom Paα, H2 and Si vi are displayed. From left to right the flux, the line of sight velocity and the line of sight velocity dispersion are shown. The flux is given in units of 10-16 Wm-2 μm-1 and the velocities in km s-1. Note that the FWHM values were not corrected for instrumental broadening (see Table 1). The contours in the velocity maps represent –150, –100, –50, 0, 50, 100, 150 km s-1. |
| In the text | |
|
Fig. 13 Line-ratio diagram of log ([Fe ii] /Paβ) over log (H2/Brγ). The flux values are taken from a 0 |
| In the text | |
|
Fig. 14 The radial profile fits of all detected emission lines including non-stellar H- and K-band continuum at 1.6 μm and 2.2 μm. Crosses mark the data points and line plots are the fitted Gaussian to the shown data points. |
| In the text | |
Current usage metrics show cumulative count of Article Views (full-text article views including HTML views, PDF and ePub downloads, according to the available data) and Abstracts Views on Vision4Press platform.
Data correspond to usage on the plateform after 2015. The current usage metrics is available 48-96 hours after online publication and is updated daily on week days.
Initial download of the metrics may take a while.