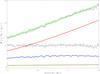
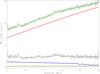
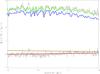
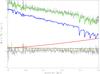
Fig. 11
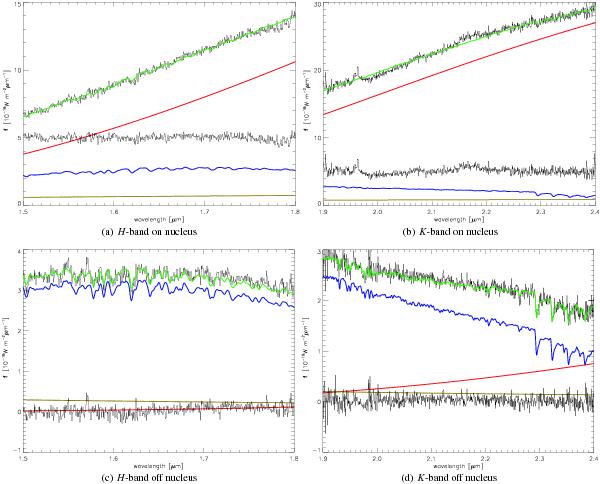
The spectra show our continuum fit to the galactic spectrum. Shown are the galactic spectrum and the residual spectrum in black. The red line represents the black body fit for (hot) dust. The blue line represents the chosen stellar template. The yellow line was included to represent an almost not notable power law contribution. The green line shows the fit of these three components combined. We note that for the on nucleus spectra a) and b) the residual was moved from 0 to 5 due to presentation effects.
Current usage metrics show cumulative count of Article Views (full-text article views including HTML views, PDF and ePub downloads, according to the available data) and Abstracts Views on Vision4Press platform.
Data correspond to usage on the plateform after 2015. The current usage metrics is available 48-96 hours after online publication and is updated daily on week days.
Initial download of the metrics may take a while.