Fig. 10
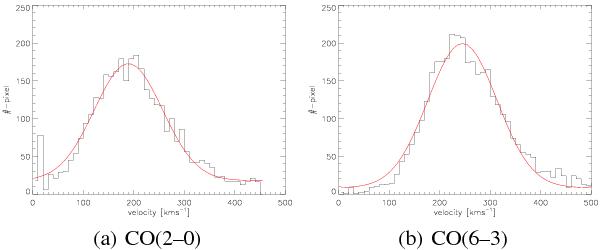
Pixel distribution of the stellar velocity dispersion from our continuum fit. a) shows the σ ∗ fitted to CO(2–0) overlayed by a fitted Gaussian. b) shows the same but for the CO(6–3) fit. The fitted velocity dispersions were sorted and binned with a bin size of ten km s-1. The velocities at the Gaussian peaks were used for the black-hole mass estimation.
Current usage metrics show cumulative count of Article Views (full-text article views including HTML views, PDF and ePub downloads, according to the available data) and Abstracts Views on Vision4Press platform.
Data correspond to usage on the plateform after 2015. The current usage metrics is available 48-96 hours after online publication and is updated daily on week days.
Initial download of the metrics may take a while.