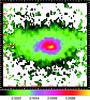
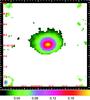
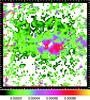
Fig. 4
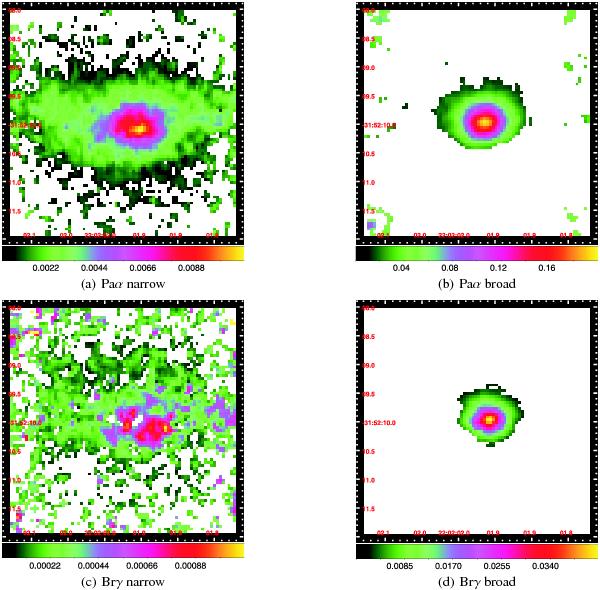
Linemaps of Paαλ1.875 μm and Brγλ2.16 μm. The colorbar represents the flux in units of 10-16 Wm-2 μm-1. The X- and Y-axis show the right ascension and declination, respectively. a) and b) show the spatial distribution of Paα, whitespace falls under the 3-sigma criterion. c) and d) show Brγ, whitespace falls under a 1-sigma border.
Current usage metrics show cumulative count of Article Views (full-text article views including HTML views, PDF and ePub downloads, according to the available data) and Abstracts Views on Vision4Press platform.
Data correspond to usage on the plateform after 2015. The current usage metrics is available 48-96 hours after online publication and is updated daily on week days.
Initial download of the metrics may take a while.