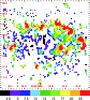
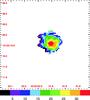
Fig. 6
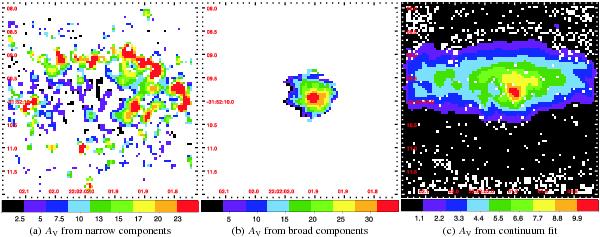
AV maps determined in three different ways. Paα and Brγ line ratios were used for a) and b). Case B recombination was assumed for narrow and broad components. White space represents either negative extinction or we measured neither Paα nor Brγ flux. c) shows the extinction that was fitted by our routine (see Sect. 3.3). Note that it overlaps with the dustlane that crosses the galaxy from east to west (see Fig. 3). All colorbars have different scales.
Current usage metrics show cumulative count of Article Views (full-text article views including HTML views, PDF and ePub downloads, according to the available data) and Abstracts Views on Vision4Press platform.
Data correspond to usage on the plateform after 2015. The current usage metrics is available 48-96 hours after online publication and is updated daily on week days.
Initial download of the metrics may take a while.