Fig. 13
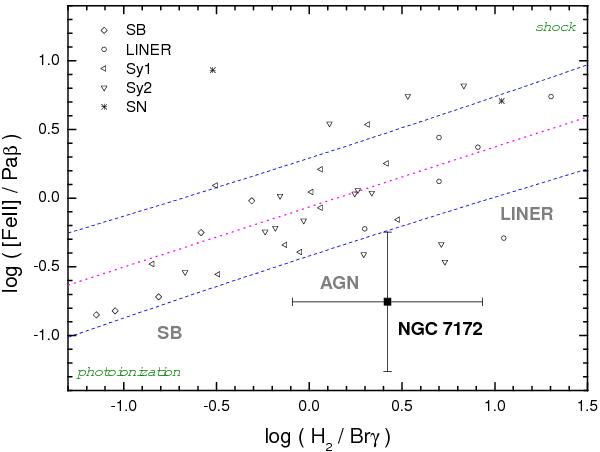
Line-ratio diagram of log ([Fe ii] /Paβ) over log (H2/Brγ). The flux values are taken from a 0 5 radius aperture centered on the main emission-line region to the south west of the continuum emission (see Table 1). The line flux of [Fe ii] λ1.257 μm was calculated from the line ratio [Fe ii]λ1.644/[Fe ii]λ1.257 μm = 0.74 (Nussbaumer & Storey 1988). Paβ was evaluated by assuming the case B line ratio Paα/Paβ = 2.05. Symbols represent literature data: rhombus symbols are from Dale et al. (2004) and representing starburst galaxies, circles represent LINERs and asterisks supernovae from Larkin et al. (1998), left hand triangles represent Seyfert 1 galaxies taken from Rodríguez-Ardila et al. (2004), and horizontally pointing triangles represent Seyfert 2s from Rodríguez-Ardila et al. (2005). The diagram shows the transition from pure photoionization (lower left corner) to pure shock ionization (upper right corner) (Rodríguez-Ardila et al. 2005). The dotted line represents a linear fit to the literature data where the 1-σ prediction band of the fit is shown in dashed lines (Zuther et al. 2007). The fit assumption is a linear relationship between the two line ratios.
Current usage metrics show cumulative count of Article Views (full-text article views including HTML views, PDF and ePub downloads, according to the available data) and Abstracts Views on Vision4Press platform.
Data correspond to usage on the plateform after 2015. The current usage metrics is available 48-96 hours after online publication and is updated daily on week days.
Initial download of the metrics may take a while.