Fig. 8
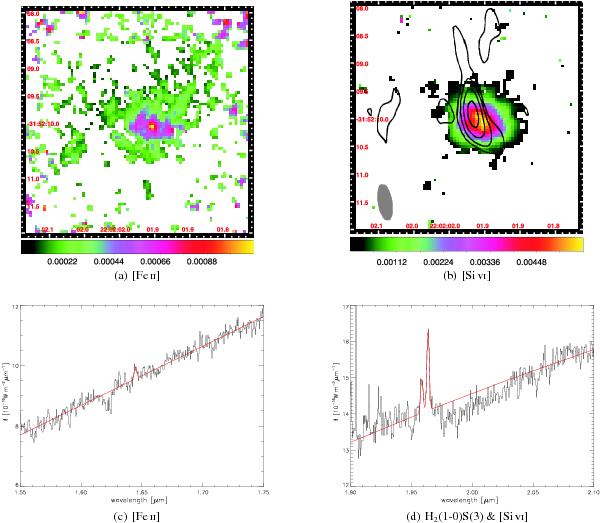
The linemaps of [Fe ii] and [Si vi] are shown in panels a) and b), and the single pixel spectra and fits to these lines are shown in panels c) and d). A linear continuum contribution was assumed. The flux density is given in units of 10-16 W m-2 μm-1. The black contours in b) represent a VLA observation from Thean et al. (2000) at 8.4 GHz. The beam size is shown in the lower left corner (filled grey).
Current usage metrics show cumulative count of Article Views (full-text article views including HTML views, PDF and ePub downloads, according to the available data) and Abstracts Views on Vision4Press platform.
Data correspond to usage on the plateform after 2015. The current usage metrics is available 48-96 hours after online publication and is updated daily on week days.
Initial download of the metrics may take a while.