| Issue |
A&A
Volume 529, May 2011
|
|
|---|---|---|
| Article Number | A135 | |
| Number of page(s) | 20 | |
| Section | Extragalactic astronomy | |
| DOI | https://doi.org/10.1051/0004-6361/201015763 | |
| Published online | 19 April 2011 | |
Optical and infrared properties of active galactic nuclei in the Lockman Hole⋆
1
Max Planck Institut für extraterrestrische Physik, Giessenbachstraße, 85748 Garching, Germany
e-mail: erovilos@mpe.mpg.de
2
Max Planck Institut für Plasmaphysik, Boltzmannstraße 2, 85748 Garching, Germany
3
Technische Universität München, Fakultät für Physik, James-Frank-Straße, 85748 Garching, Germany
4
Excellence Cluster Universe, TUM, Boltzmannstraße 2, 85748 Garching, Germany
5
Steward Observatory, University of Arizona, 933 North Cherry Avenue, Tucson, AZ 85721, USA
6
Institute of Physics, Eötvös University, Pázmány P. s. 1/A, 1117 Budapest, Hungary
Received: 15 September 2010
Accepted: 23 February 2011
We present the observed-frame optical, near-, and mid-infrared properties of X-ray-selected active galactic nuclei (AGN) in the Lockman Hole. Using a likelihood ratio method on optical, near-infrared or mid-infrared catalogues, we assigned counterparts to 401 out of the 409 X-ray sources of the XMM-Newton catalogue. Accurate photometry was collected for all the sources from U to 24 μm. We used X-ray and optical criteria to remove any normal galaxies, galactic stars, or X-ray clusters among them and studied the multi-wavelength properties of the remaining 377 AGN. We used a mid-IR colour–colour selection to understand the AGN contribution to the optical and infrared emission. Using this selection, we identified different behaviours of AGN-dominated and host-dominated sources in X-ray-optical-infrared colour–colour diagrams. More specifically, the AGN-dominated sources show a clear trend in the fx/fRC vs. RC − K and f24 μm/fRC vs. RC − K diagrams, while the hosts follow the behaviour of non X-ray detected galaxies. In the optical-near-infrared colour–magnitude diagram we see that the known trend of redder objects to be more obscured in X-rays is stronger for AGN-dominated than for host-dominated systems. This is an indication that the trend is more related to the AGN, which contaminate the overall colours, than to any evolutionary effects. Finally, we find that a significant fraction (~30%) of the reddest AGN are not obscured in X-rays.
Key words: galaxies: active / galaxies: Seyfert / galaxies: statistics / X-rays: galaxies / infrared: galaxies
Table 2 is only available in electronic form at http://www.aanda.org
© ESO, 2011
1. Introduction
Active galactic nuclei (AGN) are among the most energetic phenomena in the universe and responsible for a significant fraction (~15%) of its total luminosity (Elvis et al. 2002). The energy output of a single AGN can be as high as 1014 − 1015 L⊙ ≃ 1047 erg s-1 (e.g. Hopkins et al. 2007). The peak of their energy distribution is at high energies (UV / soft X-rays), hence X-ray surveys are the most efficient and the most widely used method to detect AGN (Brandt & Hasinger 2005), because of their small contamination by non-AGN sources.
However, to gain a complete picture of the properties of AGN, one needs to consider their full multi-wavelength energy distribution. While the ionising radiation of AGN can be directly detected in X-ray and ultra-violet wavelengths (Strateva et al. 2005), there are many cases where the line of sight is obscured by circumnuclear material. This may absorb the UV and soft X-ray photons in a quantity that depends on its column density. The fraction of obscured AGN is higher at non-local redshifts (La Franca et al. 2005; Treister & Urry 2006; Hasinger 2008), which is reflected on the characteristic shape of the X-ray background (Ueda et al. 2003; Ballantyne et al. 2006; Gilli et al. 2007). The obscured ionising photons are then re-emitted in infrared wavelengths, where the resulting SED will show a characteristic power-law spectrum (Neugebauer et al. 1979). The detection of AGN through this characteristic feature is a powerful and widely used method of detecting AGN (Lacy et al. 2004; Stern et al. 2005; Alonso-Herrero et al. 2006; Donley et al. 2007), while adding information from the optical bands can refine the selection (Richards et al. 2006). The infrared selection of AGN is particularly important for the detection of X-ray-obscured AGN whose soft X-ray and UV light are absorbed by circumnuclear dust (e.g. Lacy et al. 2007; Eckart et al. 2010).
Moreover, the evolution of the AGN cannot be thoroughly studied without taking into account the properties of the host galaxy, which emits predominantly in optical and infrared wavelengths. There is an observed correlation between host and AGN evolution (the M-sigma and M-bulge relations; Kormendy 1983; Magorrian et al. 1998; Ferrarese & Merritt 2000; Gebhardt et al. 2000; Tremaine et al. 2002; Häring & Rix 2004; Gültekin et al. 2009), and its origin and evolution with time is still under debate (Woo et al. 2008; Merloni et al. 2010). For the study of the properties of both the AGN and the host galaxy it is necessary to separate the observational characteristics of these two components. If the objects are at non-local redshifts, where their angular sizes are usually too small to be resolved by ground-based optical telescopes without the use of adaptive optics, the only way to do it is through detecting AGN and host galaxy characteristics in their broad-band spectra (see Merloni et al. 2010), therefore a multi-wavelength approach is essential.
In this paper we present observed-frame multi-wavelength results from the Lockman Hole survey, which is one of the deepest in X-ray wavelengths (Brunner et al. 2008) and also has broad coverage in optical, near-, and mid-infrared wavelengths with the most sensitive ground-based (LBT, Subaru, and UKIRT) and space (Spitzer) telescopes. In Sect. 2 we describe the multi-wavelength data used and in Sect. 3.1 we employ the likelihood-ratio method to find counterparts for the X-ray sources and construct the multi-wavelength catalogue. In Sect. 3.2 we identify any normal galaxies, stars, or X-ray clusters, which we remove from our sample, and in Sect. 4 we use the mid-infrared colours to assess the host-galaxy contribution in the optical-infrared flux. Finally, in Sect. 5 we discuss the different behaviours of the hosts and the AGN, and summarise our results in Sect. 6.
2. Data
2.1. X-rays
The X-ray observations of the Lockman Hole took place between April 2000 and December 2002 with XMM-Newton. The final catalogue of the inner 15′ of the survey contains 409 sources with flux limits of 1.9 × 10⁻¹⁶ erg cm-2 s-1, 9 × 10-16 erg cm-2 s-1, and 1.8 × 10⁻¹⁵ erg cm-2 s-1 in the 0.5−2.0 keV, 2.0−10.0 keV, and 5.0−10.0 keV bands respectively (Brunner et al. 2008). Low-resolution X-ray spectra have been extracted for the brightest 143 sources (Mainieri et al. 2002; Mateos et al. 2005), giving a mixed bag of obscured and unobscured sources, in terms of NH. Because these spectra and consequently the hydrogen column density information are available for only a fraction of the sources, in this paper we will use the X-ray hardness-ratio between the (0.5−2.0) keV and (2.0−4.5) keV bands as an indication of the X-ray absorption. Mainieri et al. (2002) use the X-ray and optical spectra of the X-ray-brightest AGN and find that optically type-2 AGN tend to have high hydrogen column densities (log NH > 21.5 cm-2). The dividing line in the hardness-ratio between obscured and unobscured sources is at HR = −0.4 (Fig. 3 in Mainieri et al. 2002; Hasinger et al. 2001), and this is the value we will use (see also similar results in Della Ceca et al. 2004; and simulations in Dwelly et al. 2005).
2.2. Optical
The optical observations of the Lockman Hole were conducted with the Large Binocular Telescope (U-B-V bands) and the Subaru Telescope (RC-IC-z′ bands). The LBT observations were taken from February 2007 to March 2009. The data and the analysis technique are described in Rovilos et al. (2009). The RC, IC, and z′ bands have been observed with the Suprime-Cam of the Subaru telescope between November 2001 and April 2002 (see Barris et al. 2004). The data were analysed using standard techniques and the final images cover an area of 0.5 deg2, which includes the entire LBT and XMM area. The FWHM of point spread functions (PSFs) of the final images is of the order of 0.85 arcsec.
To extract the optical magnitudes, we first register all optical images to a common frame, for which we used the SWIRE infrared extragalactic survey (Lonsdale et al. 2003), which has an astrometric accuracy of 0.2″ with respect to the 2MASS survey. The typical rms of the positional differences between the final positions of our sources and the SWIRE sources is one pixel, which corresponds to 0.2″, or one quarter to one fifth of the FWHM of the PSF of the optical images.
We extracted the sources of the optical images using sextractor (Bertin & Arnouts 1996) in dual mode with parameters similar to those described in Rovilos et al. (2009). As a detection image we used the RC image, which is the best in terms of seeing (0.9″) and depth, and measured the fluxes of the sources in 3″ diameter apertures. The largest PSF is that of the U-band image (FWHM = 1.06″) which is 17% larger than the best PSF. Because the seeing is relatively good, the total flux is included in 3″ apertures in all bands for point sources. Nevertheless, we ran simulations to find any needed residual aperture corrections and fine-tuned the final zero-points with the colour–colour track of stars. Details on the relative photometry will be given in a subsequent paper (Fotopoulou et al., in prep.).
2.3. Near- and mid-infrared
The region of the Lockman Hole which we study here has been targeted in both the near-infrared by the UKIRT and the mid-infrared by Spitzer-IRAC and Spitzer-MIPS. The UKIRT observations are part of the UKIDSS survey (Lawrence et al. 2007). We used the Data Release 5 (DR5) of the Deep Extragalactic Survey (DXS), which includes J- and K-band images and source catalogues of the Lockman Hole to a limiting magnitude of K = 21(Vega) in the deepest part of the survey.
IRAC on board Spitzer has observed the Lockman Hole in 3.6 μm, 4.5 μm, 5.8 μm, and 8.0 μm in April 2004 with a total integration time of 500 s per band (see details in Pérez-González et al. 2008). We used sextractor in dual mode, using the 3.6 μm image to detect sources and measured their fluxes in all four bands. We extracted aperture magnitudes with an aperture diameter of 3.8″ in all four bands and used standard aperture corrections (Surace et al. 2005) to derive the total magnitudes. The detection limit at 3.6 μm is 24.5 mag (AB). This method may cause an underestimation of the fluxes of extended sources, but our analysis shows that the number of affected sources is less than 20% of the 3.6 μm detections. Moreover, this aperture effect is less severe in the IRAC colours used in this paper owing to the similar PSF sizes of the IRAC channels 1−2 and 3−4.
The MIPS observations were conducted in November 2003, with a total integration time of 300 s pixel-1 (see Egami et al. 2004). New observations taken in April 2005 are integrated and standard MIPS procedures were used for the data reduction. The source extraction was made with DAOPHOT with a limiting magnitude of 20.3 mag (AB).
3. The sample
3.1. Sample construction
We started constructing the multi-colour catalogue of the XMM sources by cross-correlating the XMM catalogue with the UKIDSS K-band catalogue. Because the vast majority of the XMM sources are AGN, looking in the optical bands for counterparts to the X-ray sources would introduce a bias against red AGN, which show increased X-ray-to-optical ratios, but normal X-ray-to-near-infrared ratios (Mainieri et al. 2002; Brusa et al. 2005). Ideally we should have used the deeper IRAC 3.6 μm image, but we used the K-band because of its smaller PSF.
Various information of the different catalogues used in this work and the correlation of X-ray sources.
We used the likelihood-ratio method (Sutherland & Saunders 1992) to find K-band counterparts to the X-ray sources. The likelihood ratio (LR) of a possible K counterpart with magnitude m at a distance r from an X-ray source is defined as  (1)where f(r) is the combined probability distribution function of the positional errors of the two catalogues. Here, we assume Gaussian distributions and define
 where σ1 and σ2 are the uncertainties of the positions in the two catalogues. For the positional uncertainties, we used the published values of Brunner et al. (2008) for the X-ray sources, a fraction (1/4) of the FWHM of the source for the optical and IRAC sources, and a constant value of 0.5″ for UKIDSS. The distributions used to calculate the likelihood ratio in Eq. (1) are n(m), the surface density of UKIDSS objects with magnitude m( ± dm/2), and q(m) defined as
 is the probability that the counterpart is brighter than the magnitude limit of the K catalogue (practically the final ratio of X-ray sources with a K counterpart). real(m) is the expected magnitude distribution of “real” counterparts, defined as
 where total(m) is the total distribution of possible counterparts within the search radius rs. All the above distributions are shown in Fig. 1.
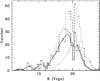 |
Fig. 1 Various distributions used for the calculation of the likelihood ratio of the K-band to X-ray counterparts. The histograms represent the total(m), |

Given the uncertainties in the positions of the X-ray sources (Brunner et al. 2008) we searched for K counterparts with an initial radius of 5″. The optimum likelihood-ratio threshold (LRth) we used to select reliable counterparts is the one that maximises the sum of the mean reliability and detection rate (see Luo et al. 2010). The reliability Ri of a possible counterpart (i) is defined as
 where j refers to the different K counterparts to a specific X-ray source, and the mean reliability is the mean of the reliabilities of all counterparts with LR > LRth. The detection rate is the ratio of the sum of the reliabilities of the counterparts with LR > LRth over the number of the X-ray sources. With LRth = 0.15, which yields a 89.01% reliability, we find counterparts for 380 X-ray sources. For X-ray sources without a K-band counterpart, we repeated the procedure described above using the RC-band optical catalogue, detecting additional 14 sources, and again for the IRAC and MIPS catalogues, detecting another seven sources.
We finally compiled a master catalogue with all the counterparts. We again used the likelihood-ratio method to find the correct optical associations for the near-infrared counterparts, and vice-versa, this time with an initial search radius of 3″. Finally, we visually inspected the optical and infrared images to spot any obvious mis-identifications and identified any sources that were missing from the catalogues, either because of unreliable photometry (e.g. saturation), or failure of the source-extracting algorithm (e.g. due to a nearby bright source). We also flagged some cases where the optical or infrared counterpart is a blend of two or more sources.
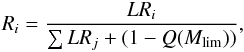
The detection rate of the X-ray sources in the various bands can be seen in Table 1. The highest detection rate is in the IRAC 3.6 μm band, and the optical RC-band has a higher detection rate than the UKIDSS K-band. However, the X-rays – RC associations are made through the K-band, or in other words, we used the RC counterparts of the K-band sources, which in turn are counterparts of the X-ray sources. On the other hand, the RC counterparts would not have a high LR in a direct X-ray-optical counterpart search owing to the large number of confusing optical sources. Note that some X-ray sources are not observed in all the available wavelengths. In Fig. 2 we can see the distribution of the X-ray sources in the sky with the areas covered by the different images that map the Lockman Hole area. We find a reliable optical, near-, or mid-infrared counterpart for 401/409 X-ray sources (98.0%). Of the eight sources for which we found no reliable counterpart, two are associated with diffuse X-ray sources (XID 2513, 2514) that mark the positions of galaxy clusters (Finoguenov et al. 2005), one (XID 101) is a low-reliability X-ray source (L = 11; Brunner et al. 2008), and one (XID 576) is an off-nuclear source. The remaining three are not detected in our images.
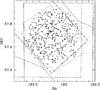 |
Fig. 2 Coverage of the Lockman Hole region that contains the XMM-Newton X-ray sources (plotted in crosses). The dotted, solid, dashed, long-dashed, and dot-dashed lines represent the borders of the LBT (U-B-V bands), Subaru (RC-IC-z′ bands), UKIDSS, IRAC, and MIPS exposures, respectively. |
3.2. Sample properties
In Table 2 we list the X-ray properties of the 409 XMM sources, the positions of their optical-infrared counterparts for 401 sources (the position of the optical counterpart in the RC Subaru image is given, unless stated otherwise), and some basic optical and infrared properties. Detailed optical and infrared photometry will be presented in a future paper together with photometric redshifts, which are not available at the moment (Fotopoulou et al., in prep.). For 118 sources spectroscopic redshifts are available either in literature (Hasinger et al. 1998; Schmidt et al. 1998; Lehmann et al. 2000, 2001; Mateos et al. 2005) or via a recent spectroscopic campaign at Keck/DEIMOS (PI: Scoville). For these sources the X-ray luminosities in Table 2 were calculated using the fitted value of Γ (Mainieri et al. 2002; Mateos et al. 2005) or Γ = 2.0 (see Mainieri et al. 2002) when this is not available.
In this paper we focus on the observed-frame multi-wavelength properties of X-ray-selected AGN, and therefore we make an attempt to characterise the X-ray sources. In all diagrams we avoid stellar objects that are identified by optical spectroscopy (nine sources with z = 0 in Table 2). One more source (XID 526) is flagged as a star, based on its low R − m3.6 μm colour (see Ilbert et al. 2009), low X-ray-to-optical ratio (log (fx/fopt) = −1.10), and soft X-ray spectrum (HR = −0.73). Normal galaxies are identified by their low X-ray luminosities (L(0.5−10) keV < 1042 erg s-1) in combination with their soft X-ray spectra (Bauer et al. 2004). If the X-ray luminosity is not known, they are identified by their low X-ray-to-optical ratio (Hornschemeier et al. 2003) and their soft spectra. Here, we define a soft X-ray spectrum as HR < − 0.4. To gain a clean AGN sample, we flag as galaxies those sources that have log (fx/fopt) < −1.5. This value is more conservative for the AGN selection than the usual limit (log (fx/fopt) < −2), and we used it to obtain a cleaner sample, knowing that some low-luminosity or very heavily obscured AGN may be lost. Finally, we excluded extended X-ray sources, which are related to galaxy clusters rather than AGN (11 cases; Finoguenov et al. 2005).
Our final sample consists of 377 X-ray AGN, of these 204 are likely unobscured and 173 are obscured based on the hardness-ratio classification between the (0.5−2.0) keV and (2.0−4.5) keV bands and a limit of HR = −0.4.
4. AGN-host contribution
To assess the host galaxy contribution to the optical and infrared flux of the AGN, we used the IRAC colours of the sources of our sample. The intrinsic mid-infrared spectral energy distribution of a purely AGN-dominated source is a power-law with a spectral index α ≤ −0.5 (Alonso-Herrero et al. 2006; Donley et al. 2007) and has characteristic MIR colours. Stern et al. (2005) define a specific region in the MIR colour–colour diagram, which contains a large fraction (90%) of the optically bright broad-line AGN and 40% of the narrow-line AGN.
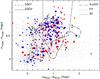 |
Fig. 3 XMM Lockman Hole sources plotted on the Stern et al. (2005) diagram. In blue and red circles are plotted the soft and hard X-ray sources according to their hardness-ratios, while large symbols mark sources with bright optical and mid-infrared fluxes (RAB < 21.5 and f3.6 μm > 12 μJy) to imitate the selection criteria used by Stern et al. (2005). Grey dots represent the mid-infrared colours of all IRAC detections in the Lockman Hole, and the lines are tracks of different SED templates with 0 < z < 4. This figure is available in color in electronic form. |
In Fig. 3 we plot the [3.6] − [4.5] vs. [5.8] − [8.0] colours of X-ray AGN with IRAC counterparts, marking the region specified by Stern et al. (2005) with a solid line. Red and blue symbols represent X-ray-obscured and unobscured AGN respectively, while larger circles mark sources bright both in the optical (RAB < 21.5) and in 3.6 μm (f3.6 μm > 12 μJy) to reproduce the sources used in Stern et al. (2005). The lines are tracks of different spectral energy distributions from z = 0 to z = 4 with black dots marking z = 0 and z = 2; the long-dashed line is the SED of Arp 220, a dusty starburst galaxy and the prototypical ULIRG, the dotted line is the SED of an elliptical, the dot-long-dashed line the SED of a S0 spiral, and finally the short-dashed and solid lines are broad-line QSO1 and QSO2 SEDs respectively. All SEDs are taken from the SWIRE template library1 (Polletta et al. 2007).
We can see in Fig. 3 that 277 out of the 377 X-ray-selected AGN are detected in all four IRAC bands, and they are evenly distributed inside and outside the “wedge” that defines typical mid-infrared colours of optically bright AGN. If we look into their X-ray spectral properties, 79/152 (52.0%) of the unobscured AGN with full IRAC photometry are inside the wedge and 73/152 (48.0%) outside. The numbers for obscured objects are 58/125 (46.4%) and 67/125 (53.6%) in and out of the mid-IR wedge, respectively. These numbers change dramatically if we consider only bright sources in the optical and near-infrared (RAB < 21.5 and f3.6 μm > 12 μJy) to reproduce the Stern et al. (2005) sample. The fraction of unobscured AGN inside the wedge rises to 27/37 (73.0%), while the fraction of obscured AGN inside the wedge falls to 2/15 (13.3%). Thus the Stern et al. (2005) criterion is reliable only in the bright unobscured AGN regime, as was already discussed by Barmby et al. (2006) in the AEGIS survey, where only 40% of the X-ray sources have red (α < 0) SEDs (see also Cardamone et al. 2008; Brusa et al. 2009, 2010).
We will use the position in the Stern et al. (2005) diagram not as a selection criterion for AGN, but as an indication of the relative contribution of the AGN in the optical and infrared colours. We assume that the AGN part of the SED is always a red power-law (see Elvis et al. 1994), being a combination of (thermal) emission from the heated dust of the circumnuclear torus and (non-thermal) nuclear emission (Rieke & Lebofsky 1981). Its IRAC colours would reside in the wedge independent of its obscuration for the vast majority of our AGN. The track of the QSO1 SED (dashed line in Fig. 3) is always in the wedge, whereas the QSO2 SED (solid line in Fig. 3) is in the wedge for z < 3.87; only 1/95 of our X-ray AGN with a spectroscopic redshift have z > 3.87. On the other hand, the non-AGN tracks are outside the wedge for z < 2.85, while only 7/95 (7.3%) of our X-ray AGN with a spectroscopic redshift have z > 2.85. Assuming that there is a link between X-ray and optical-infrared obscuration, a bright unobscured AGN will have its infrared colours dominated by the active nucleus, which explains the bright blue points in Fig. 3. Checking the AGN with spectroscopic redshift information we see that luminous AGN (with Lx > 1044 erg s-1) with full IRAC photometry are indeed predominantly unobscured (28/35) objects inside the wedge (32/35). Therefore, the (optically) bright AGN outside the wedge are low apparent X-ray luminosity (either obscured or intrinsically faint) AGN at lower redshift (z < 0.8), where the host galaxy contribution to the IRAC flux is not negligible both for obscured and unobscured objects. In the fainter regime, the AGN light is either intrinsically fainter, which makes the host contribution stronger even for unobscured systems, or we are at higher redshifts, where the host galaxy luminosity is increased (Lilly et al. 1996), diluting the observed-frame mid-infrared light of even brighter unobscured AGN, hence the faint unobscured AGN outside the wedge. On the other hand, the light of even an obscured AGN could prevail over a weak host, which would explain the faint obscured systems inside the wedge.
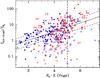 |
Fig. 4 X-ray-to-optical flux ratio versus RC − K colour of the X-ray AGN in the Lockman Hole. Blue and red colours represent hard and soft X-ray sources respectively according to their hardness-ratio, and different symbols represent the position of the IRAC counterpart in the Stern diagram (Fig. 3). Filled circles are sources in the wedge (with MIR colours typical of AGN), open circles are sources outside the wedge (with MIR colours typical of non-active galaxies) and asterisks are sources without full IRAC photometry, either because they are fainter than the IRAC limiting magnitude or because they are out of the field. The solid line is the best-fit line to the positions of the filled circles, while the dashed lines mark its 1σ limits. This figure is available in color in electronic form. |
We also tested whether the position of an X-ray source in the IRAC colour–colour diagram provides a hint about the contribution of the host galaxy by plotting the X-ray-to-optical flux ratio against the RC − K colour in Fig. 4, considering the RC − K colour to be a proxy of optical obscuration and extinction. We calculate the X-ray to optical flux ratio with 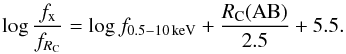 (2)Red and blue circles again mark obscured and unobscured AGN respectively, based on their X-ray hardness-ratio, and filled and open symbols denote the position of the source in the IRAC colour–colour diagram, with filled symbols representing sources filling the Stern et al. (2005) criterion. We can see that filled symbols follow a well defined trend in the fx/fRC-RC − K plane. Simultaneously there is a clear dichotomy between obscured and unobscured objects, obscured being redder in RC − K. We fitted a straight line to the positions of the filled circles in Fig. 4 using the orthogonal regression (Isobe et al. 1990) because we have uncertainties in both axes and we obtain
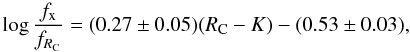 which we plot with the solid line, the dashed lines marking the 1σ area. The open symbols on the other hand seem to have a more random distribution, while thay generally have lower fx/fRC values for their respective RC − K. This is a hint that we are detecting a lower AGN contribution in sources outside the MIR wedge. There are also very few open symbols with RC − K < 3. This is an area occupied by unobscured QSOs.
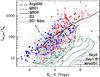 |
Fig. 5 Mid-infrared (24 μm) to optical (RC) flux ratio versus RC − K colour of the X-ray AGN in the Lockman Hole. The blue and red symbols are identical with those in Fig. 4, while the grey dots represent all optical-IRAC-MIPS sources in the Lockman Hole. The black lines are the tracks of QSO and Arp 220 SEDs with 0 < z < 3, while the violet lines are tracks of SED combinations between QSOs and host galaxies (non type-1 Seyferts). Green lines from right to left are tracks of elliptical, spirals, and irregular galaxies. This figure is available in color in electronic form. |
The different behaviour of the sources inside and outside the IRAC colour wedge is even more evident when we plot the 24 μm to optical (RC) flux ratio against the RC − K colour in Fig. 5. The blue and red symbols are identical to those in Fig. 4, while with grey dots we plot the 24 μm sources without X-ray detection. The black galaxy tracks are the same as in Fig. 3 and we also plot tracks of Seyfert-2 and Seyfert-1.8, as well as the Compton-thick AGN Mrk 231 with dashed, solid, and dot-dashed violet lines respectively. The 24 μm to optical flux ratio is often used to detect galaxies with dust obscuration, which enhances the 24 μm emission while blocking optical light. The most extreme cases, with f24 μm/fopt > 1000 are the “dust obscured galaxies” class (DOGs; Houck et al. 2005), which are usually found in sources with relative high redshifts (z ≃ 2; Fiore et al. 2008; Dey et al. 2008; Pope et al. 2008; Fiore et al. 2009).
In Fig. 5 we can see that the filled and open symbols follow different distributions. There is again a correlation between f24 μm/fRC and RC − K for filled symbols, which does not hold for open symbols; the latter seem to lie on the locus of spirals (moderately star-forming objects) or optically obscured Seyferts, which may be expected, assuming that their optical and infrared light is dominated by the host galaxy. The filled symbols in Fig. 5 can be fitted with QSO templates, QSO1 in low RC − K cases and QSO2 in high RC − K. There is a clear dichotomy between obscured and unobscured objects both in RC − K and in f24 μm/fRC.
Fractions of obscured (with HR > − 0.4) X-ray AGN with respect to their mid-infrared (24 μm) to optical flux ratio and RC − K colour.
In Table 3 we indicate the fraction of obscured objects of various populations in Fig. 5 according to their f24 μm/fRC or RC − K values. All sources taken into account are detected in all RC, K, IRAC and MIPS bands. We can see that the sources that comply with the Stern et al. (2005) AGN criteria have a high fraction of obscured objects if they have high f24 μm/fRC or RC − K values and a low fraction otherwise. The correlation of the hardness-ratios with f24 μm/fRC or RC − K is always significant, > 99% according to K-S tests. On the other hand, sources with IRAC colours that are incompatible with AGN do not show any correlation, and we assume that this is because of the dilution of their optical and infrared fluxes by the host galaxy, which smears out their positions in the f24 μm/fRC-RC − K diagram.
The optical-infrared colours of the host dominated AGN cannot be fitted with either QSO or passive galaxy templates (e.g. elliptical or S0). The passive templates have a very low f24 μm/fRC ratio and the QSO very high. A good fit is a combination of the two; Pozzi et al. (2007) used combinations of passive galaxy and AGN templates to explain the optical to 24 μm SED of a number of obscured quasars (see also Salvato et al. 2009; Merloni et al. 2010). The tracks of the Seyfert-1.8 and Seyfert-2 templates from Polletta et al. (2007), which are examples of moderately luminous AGN with a host galaxy contribution, explain the high end of the optical-mid-infrared colours of host-dominated AGN. Another possible alternative is a template with enhanced star formation. The solid green lines in Fig. 5 represent the tracks of S0, Sa, Sb, Sc, Sd, and Sdm templates, from right to left, simulating increasing star formation. A star-forming template with enhanced dust emission to resemble Arp 220 can also explain the most extreme cases, in RC − K colours, of host-dominated systems. A combination of a dusty starburst with AGN activity (Mrk 231) explains the high-f24 μm/fRC sources where both components contribute to the 24 μm flux. It is unclear if the 24 μm emission of the host-dominated sources (as well as the non-X-ray sources in grey dots) comes from AGN or a (dusty) starburst emission; a measurement of the mid and far-infrared properties to derive its temperature is needed to clarify this question.
5. Discussion
5.1. X-ray obscuration of red AGN
In Figs. 6 and 7 we plot the optical (RC) and near-infrared (K) magnitudes of the X-ray AGN with respect to their full-band (0.5 − 10) keV fluxes, making a distinction between X-ray obscured and unobscured objects, as well as between their position in the Stern diagram as in Figs. 4 and 5. The lines in Figs. 6 and 7 represent log (fx/fRC(K)) = + 1, − 1, − 2, calculated with Eq. (2) and
 There are 64 AGN whose optical to near-IR colours (RC − K > 5) put them in the extremely red objects (EROs) regime (Elston et al. 1988), and they are plotted with a cross in Figs. 6 and 7. EROs are examples of rapidly evolving galaxies, which contribute a significant fraction ( ≳ 10%) of the star-formation density of the universe (Georgakakis et al. 2006b). We can see that they are almost equally distributed between X-ray obscured and unobscured (39 vs. 25 sources) and tend to have high X-ray-to-optical flux ratios, but normal X-ray-to-near-infrared flux ratios; EROs have log (fx/fo) = 0.7 ± 0.7 and log (fx/fK) = −0.2 ± 0.7, while the numbers for the non-ERO AGN population are log (fx/fo) = 0.2 ± 0.6 and log (fx/fK) = 0.0 ± 0.7. This is a known property of EROs (Mainieri et al. 2002; Brusa et al. 2005) and it suggests that their red optical to near-infrared colours are caused by dust extinction, which affects the optical wavelengths, but not the near-infrared (or the X-rays to a great extent). It is characteristic that Mainieri et al. (2002) do not find any EROs in the bright XMM – Lockman Hole sample associated with a broad-line AGN; they do on the other hand find that a third of the ERO sample are unabsorbed in X-rays (NH < 1021.5 cm-2). Here, we expand the sample of Mainieri et al. (2002) by considering multi-wavelength information of the faintest X-ray sources.
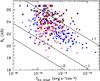 |
Fig. 6 Optical (RC-band) versus X-ray (0.5 − 10 keV) flux of the XMM-Newton sources. With blue and red symbols we plot the soft and hard X-ray sources respectively, which are characterised by their hardness-ratio, where HR = −0.4 is the dividing value. Different shapes are used according to the positions in the IRAC colour–colour wedge, similar to Figs. 4 and 5. Crosses mark the positions of EROs (with RC − K > 5) and lines mark log (fx/fo) = 1, − 1, and − 2. This figure is available in color in electronic form. |
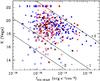 |
Fig. 7 Same as Fig. 6 with the UKIDSS K-band flux instead of RC. This figure is available in color in electronic form. |
As we can see in Figs. 6 and 7, there is a number of EROs in our sample that are associated with soft X-ray AGN, which amounts to 39.0% (25/64). We note here that there are two observational effects that might cause a low hardness-ratio of faint sources, without the source really being soft. The reason for the first effect is that faint sources have a small number of photons and the fact that XMM-Newton is more sensitive in the soft band. This might cause a hard X-ray source to be detected only in the soft band, even though the harder photons are more abundant. The reason for the second effect is the nature of photoelectric absorption; when the column density of the absorbing material is ≲ 1024 cm-2, photoelectric (or Compton-thin) absorption is the dominant mechanism and it soft X-ray photons are absorbed up to a characteristic energy depending on the surface density of the obscuring material, causing an absorption turnover in the X-ray spectrum. In high-redshift (and thus low-flux) objects this turnover might be redshifted beyond the energy bands where the hardness-ratio is calculated, causing an absorbed AGN to have a low hardness-ratio. This redshift effect becomes important at z ≳ 1.5 (see Kim et al. 2007). Only three soft EROs in our sample have a spectroscopic redshift (marked with a cross in Fig. 9) and their range is 0.805 ≤ z ≤ 1.018, while the typical median redshift for optically selected EROs in deep fields is z ≃ 1.2 (Moustakas et al. 2004).
To further check how the redshift and the “low X-ray counts” effects affect the number of hard EROs in our sample, we plot it with respect to the X-ray flux in Fig. 8; the dashed line indicates the fraction of all hard EROs with fx > 10-15 erg s-1 cm-2. We do not see any obvious decrease in the fraction of hard sources with decreasing X-ray flux, which we would expect if the redshift effect was severe (the most distant AGN are generally expected to have lower X-ray fluxes). We do see it for EROs with fx < 10-15 erg s-1 cm-2, and that is also owing to the higher efficiency of XMM in lower energies and the small number of photons. We therefore assume that the redshift effect has a limited effect in the fraction of EROs with HR < − 0.4, especially in the fx > 10-15 erg s-1 cm-2 regime. If we consider only sources with f0.5 − 10 keV > 10-15 erg s-1 cm-2, the fraction of X-ray soft AGN among the EROs is still relatively high (19/56; 33.9%).
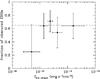 |
Fig. 8 Variation of the fraction of obscured (with HR < − 0.4) EROs with respect to X-ray flux. The dashed line is at 63.6%, where the overall fraction of obscured EROs with fx > 10-15 erg s-1 cm-2 is. We do not see any significant dependency of the fraction of obscured EROs with X-ray flux, except for sources with fx < 10-15 erg s-1 cm-2. The vertical error-bars are Poisson estimates, while the horizontal are the bin widths, which were chosen to contain the same number of sources. |
At higher fluxes (lower redshifts), a low hardness-ratio of an obscured source can be caused by a scattered or a thermal component (e.g. Turner et al. 1997), especially since the hardness-ratio we use probes relatively low X-ray energies up to 4.5 keV. This component is 1 − 2 orders of magnitude fainter than the emission from the accretion disk (intrinsic transmission component) and the absorption turnover would still be recognisable in higher energies. Hasinger et al. (2007) show that this “leaky absorber” spectrum has a higher “hard” hardness-ratio in the XMM-Newton bands (HR2 between the 2.5 − 4.5 and 4.5 − 10.0 keV bands), with HR2 > − 0.1 when the relative strength of the scattered component is < 10%. In Fig. 9 we plot the X-ray colour–colour diagram of the X-ray sources (see also Brunner et al. 2008), using the same symbols as in Figs. 6 and 7 and marking EROs with a black colour, the non-ERO AGN population plotted in grey. We can see that the soft (HR1 < − 0.4) EROs do not show a different behaviour than the rest of the X-ray AGN. We also see that there are only six EROs for which the “harder” hardness-ratio is higher than –0.1, and only two of them (XID 1566 and XID 470) have f0.5 − 10 keV > 10-15 erg s-1 cm-2. We therefore assume that the “leaky absorber” effect does not play an important role for the majority of the soft EROs. Therefore we assume that they are X-ray-unobscured. Consequently, if the red optical-to-near-infrared colours of the EROs are caused by dust extinction, this indicates that there is a discrepancy between optical and X-ray absorption of the order of ~ 30%. Alternatively the red colours could be a result of another process, such as an early-type host or very high redshift.
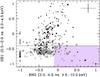 |
Fig. 9 X-ray colour − colour diagram of the Lockman Hole sources. EROs (with RC − K > 5) are plotted with black symbols, while the non-ERO population is plotted in grey. The symbols (open-filled circles and asterisks) are identical to Fig. 4. The horizontal line at HR1 = −0.4 is the dividing line between soft and hard sources adopted for this paper and the purple region is the region where the “leaky absorber” effect is important (see text). The cross in the top right corner shows a typical error-bar with dHR1 = 0.15 and dHR2 = 0.20, while crosses on the individual sources mark AGN with a known spectroscopic redshift. |
In the literature, AGN with red hosts (but not in all cases EROs) are generally obscured (Rovilos & Georgantopoulos 2007; Silverman et al. 2008a; Georgakakis et al. 2008; Pierce et al. 2010b), but there are known cases of unobscured AGN with red hosts (Georgakakis et al. 2006a) where the dilution of the AGN optical light by the host galaxy is thought to play an important role. In Sect. 4 we use the mid-infrared colours of the system to assess the host contribution, and in Figs. 6 and 7 we can see that there is a significant number of unobscured EROs whose optical-infrared colours are AGN-dominated. This is more clearly shown in Fig. 9, where we can see that while most of the unobscured EROs (16/25 black objects below the solid line) are host-dominated and their red colour could come from a red host (either dust-obscured or evolved; we would need high-resolution imaging or optical spectroscopy to distinguish between the two cases), there is still a non negligible number2 (7/25) whose red optical-infrared colours are AGN-dominated and a red host could not explain them.
If we consider red colours as a result of high redshift, their redshift should be z > 6 for the Lyman break to be redshifted beyond the RC band. In such high redshift systems we would expect a high fraction of soft X-ray sources as a result of the K-correction. In other words, the signature of obscuration in X-rays, which is a turnover in the X-ray spectrum, would be redshifted out of our observable window. However, very high-redshift objects are expected to have a high X-ray-to-optical flux ratio and even though EROs in general do have high fx/fopt, only 8/25 (32.0%) unobscured EROs have f0.5 − 10 keV/fRC > 10. Moreover, even these eight cases with f0.5 − 10 keV/fRC > 10 are unlikely to be at z > 6, because the number of AGN expected with z > 6 is much lower; Barger et al. (2003) do not find any z > 6 AGN in the CDFN (see also Rovilos et al. 2010; Aird et al. 2010), while the number density of Lx = 1043 − 1044 erg s-1 AGN3 at z ≃ 6 is ~10-6 Mpc-3 (see also Silverman et al. 2008b). Although we cannot rule out that there might be some high-redshift AGN among the unobscured EROs (very high-redshift AGN are expected to have soft X-ray spectra, see Wang et al. 2004), their number would be much lower than eight.
We have seen that light dilution from the host galaxy and redshift effects can explain the optical–near-IR colours of a number of soft EROs. There is a number of sources however, for which the MIR colours and high X-ray fluxes argue against these explanations and present a discrepancy between the optical and X-ray colours. This discrepancy is something not only confined to the ERO population or the Lockman Hole survey (Mateos et al. 2005; Szokoly et al. 2004; Tozzi et al. 2006; Treister et al. 2009). The opposite effect, X-ray-obscured AGN without signs of optical obscuration has also been reported (Tajer et al. 2007). In the next section we will try to find an explanation for the phenomenon considering line-of-sight effects or a very high dust-to-gas ratio.
5.2. X-ray and optical classification
By classifying the AGN using their optical to near-infrared colours we might be affected by the host galaxy. We use the mid-IR colours to quantify this by separating sources according to whether they are compatible with AGN SEDs or not. The fraction of obscured objects is plotted against the RC − K colour for sources in (i.e. AGN dominated; filled circle) and out (i.e. host dominated; empty circle) the Stern wedge in Fig. 10. Clearly the fraction of obscured systems increases with increasing RC − K, while for host-dominated systems the fraction seems constant within 1σ.
In host-dominated systems we are expecting a loose (if any) correlation between the optical-infrared colour and the X-ray obscuration properties, and this is what we observe. The colour of the host can come from its dust reddening or from the colour of its stellar population (see also previous section). A young stellar population would yield a blue host colour, while a red host can come from both an evolved population and interstellar dust. The interstellar dust can be the only mechanism that has an effect in the obscuration of the central engine, hence the loose correlation observed between X-ray obscuration and star formation probed by radio (Rovilos et al. 2007), [OII]-3727 (Silverman et al. 2009), or far-infrared emission (Lutz et al. 2010). Note that Rovilos et al. (2007) do find a correlation when considering only X-ray-absorbed cases.
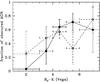 |
Fig. 10 Fraction of obscured (with HR > −0.4) X-ray AGN versus RC − K colour. Filled circles and the solid line represent sources whose mid-infrared IRAC colours satisfy the Stern et al. (2005) criteria and are assumed to be AGN-dominated in the optical-infrared, while open circles and the dashed line represent sources where the host galaxy is assumed to dominate the optical-infrared flux. |
The above assumptions are no longer valid if the RC − K colours are characteristic of the AGN rather than the host galaxy. Here, a blue optical colour means that we see the AGN unaffected by dust, while a red AGN is a result of its absorption. Indeed, only 1/30 of the bluest AGN (with RC − K < 3 and mid-infrared colours in the wedge) is obscured in X-rays (with HR > − 0.4) and there is a clear correlation between the optical-to-infrared colour and the X-ray obscuration. This correlation however does not end up with all red AGN being obscured, as 27% (7/26) of AGN with RC − K > 5 and mid-infrared colours in the wedge have HR < −0.4. If we take into account only objects with fx > 10-15 erg s-1 cm-2 to avoid the redshift effect and the effect of XMM-Newton’s sensitivity, this ratio becomes 6/24. Moreover, none of these six sources is in the grey area of Fig. 9, where a scattered X-ray component is likely to affect the hardness-ratio. There is one source (XID 26) close to this area (with HR2 = −0.13), however, which shows signs of X-ray absorption, having Γ = 1.09 ± 0.20 when a single power-law fit to the spectrum is performed (Mateos et al. 2005). Discarding this source, the fraction of X-ray-unobscured AGN-dominated sources with fx > 10-15 erg s-1 cm-2 and RC − K > 5 is still above 20% and they all have HR2 < − 0.35.
This population of reddened but X-ray-unobscured AGN can be explained with a simple orientation-based AGN unification model (Antonucci 1993), since the region which generates the X-ray emission (accretion disk) is not spatially coincident with the region where the optical-infrared emission is generated (inner side of the molecular disk or torus). If we consider a clumpy molecular disk or torus (e.g. Elitzur & Shlosman 2006; Wada et al. 2009), there can exist a geometrical set-up where the line-of-sight to the accretion disk is clear, while obscuring clouds hinder the direct view to the most prominent optical-near-IR emitting regions (see Fig. 5 in Shi et al. 2006), or they are self-absorbed. Nenkova et al. (2008a) and (2008b) have shown that a clumpy torus can cause a large scatter in the X-ray obscuration properties of AGN that have similar IR characteristics, because the X-rays come from one physically small region, while the IR is the integrated emission of a large number of clouds in a large area. While the X-ray absortption is generally higher than what would be expected form the infrared, the opposite effect for a small fraction of the sources is not ruled out. Another plausible explanation for these X-ray-unobscured red objects is that interstellar dust obscures the optical flux without affecting the soft X-rays. The opposite behaviour is reported in the local universe in the form of a very low EB − V/NH ratio (Maiolino et al. 2001a) and explained with large dust grains (Maiolino et al. 2001b). Here, we have to assume low-metallicity dust that obscures the optical wavelengths, but lacks the heavy elements (heavier than oxygen) that would absorb the X-rays.
5.3. Properties of AGN host galaxies
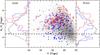 |
Fig. 11 RC − K colour versus K-band magnitude of X-ray AGN in the Lockman Hole. The blue and red symbols are identical to Figs. 4 and 5, while the grey dots represent the colours of the optical-UKIDSS normal galaxies. The left-side and right-side coloured histograms refer to the open and filled symbols, while the grey histogram on both sides refers to the grey dots. This figure is available in color in electronic form. |
As we can see in Fig. 5, the optical-to-mid-infrared colours of passive galaxies are quite different at any redshift from the typical colours of AGN-host systems. To check whether the host galaxies of X-ray AGN are a random sample of sources, we plot the RC − K colour against the K magnitude in Fig. 11. The symbols are identical to Fig. 5. We can see here that the AGN hosts tend to avoid the location of the bulk of the underlying sources. If we ignore the AGN-dominated (filled) unobscured (blue) sources with RC − K < 2.5 (dashed line in Fig. 11), which are related to optical QSOs, the distribution of the AGN hosts is similar to what is found in the optical rest-frame colour-magnitude diagram (e.g. Nandra et al. 2007; Silverman et al. 2008a; Georgakakis et al. 2008; Hickox et al. 2009), although there is no clear “red sequence” or “green valley” because we are using observed and not rest-frame magnitudes. There is also the trend of redder objects to be more obscured in X-rays (see Rovilos & Georgantopoulos 2007).
The positions of the AGN hosts in the “green valley” of the colour-magnitude diagram is often linked with the evolutionary sequence of AGN, and it is argued more specifically that it marks the quenching of star formation by AGN feedback (e.g. Hopkins et al. 2005). However, Brusa et al. (2009) attribute the red colours to dusty star-formation rather than an evolved stellar population (see also Georgakakis et al. 2009), so that the position in the colour-magnitude diagram is not indicative of the evolutionary status, but more an indication of the abundance of obscuring material. A closer look at the histograms of Fig. 11 reveals that the tendency of redder objects to be more obscured is confined to the filled symbols (right-side histograms), indicating optical emission from the AGN, while the colours of the host galaxies (left-side histograms) show no clear correlation with the obscuration of the nucleus, something also demonstrated in the two diagrams of Fig. 10. A K-S test on the RC − K values of the blue and red histograms of Fig. 11, ignoring the unobscured sources with RC − K < 2.5, gives a null hypothesis probability of 35% to the “open” histograms and 0.009% to the “filled”. This means that the (red) optical colours of obscured AGN are affected by the colour of the nucleus, which gives rise to the correlation (see also Pierce et al. 2010a), rather than an evolutionary relation between red hosts and obscured AGN. A weak trend is detectable for host-dominated systems, which is not statistically significant, but it is still problematic that a sizeable fraction of red host galaxies host obscured AGN.
A definitive answer for the question of the origin of the red optical colours of the host galaxies, dust or an evolved population, can be provided by morphology, which requires high spatial resolution images from space or adaptive optics, but observations of this type are not yet available for the Lockman Hole, or alternatively SED fitting of different templates to separate the different emission mechanisms, which requires complete spectral coverage and reliable redshifts. A more thorough analysis will take into consideration spectroscopic (where available) and photometric redshifts and will be presented in a subsequent paper, when the photometric redshift analysis and the subsequent SED fitting is completed.
6. Conclusions
We have investigated the observed-frame multi-wavelength properties of 377 X-ray-selected AGN in the Lockman Hole (Brunner et al. 2008). The optical and infrared counterparts have been selected from UKIRT, Subaru, and Spitzer IRAC and MIPS observations using the likelihood ratio method. Using the Stern et al. (2005) diagram we made an attempt to assess the relative impact of the AGN and galaxy emission in the observed optical and infrared flux. Our results are summarized as follows:
-
1.
We find an optical and/or infrared counterpart for the vastmajority (98%) of the X-ray sources. Of the eight sources withouta counterpart, two are X-ray clusters, one is a low-reliabilityX-ray source, one is an off-nuclear source, and three areundetected in our images. The highest detection rate is in themid-infrared (3.6 μm), where 93.5% of the X-ray sources covered by the IRAC survey are detected.
-
2.
The AGN-dominated and host-dominated sources have different distributions in the fx/fRC vs. RC − K (Fig. 4) and f24 μm/fRC vs. RC − K (Fig. 5) diagrams. In the latter, the host-dominated sources are closer to the distribution of non X-ray detected sources, while their colours cannot be explained with quiescent galaxy SEDs; either (dusty) star-forming or obscured Seyfert SEDs are required.
-
3.
There is a clear correlation between X-ray obscuration and RC − K colour for AGN-dominated systems, which is that the redder the colours are, the higher is the fraction of obscured AGN. However, we do not observe such a trend in host-dominated cases (Fig. 10).
-
4.
There is a significant fraction (~1/3) of EROs that are unobscured in X-rays. Moreover, most of them owe their red colours to the AGN and not the host galaxy. To explain this population we have to employ geometrical arguments or assume special dust properties that absorb the optical photons and leave the X-rays intact.
-
5.
The optical-near-infrared colours of X-ray AGN are in general redder than those of non X-ray-detected objects, and this happens for both AGN- and host-dominated systems. We also observe a trend of redder objects to be more obscured in X-rays, which is more prominent for host-dominated systems, which in turn indicates the affect of dust obscuration in the optical-infrared colours.
Online material
Basic X-ray, optical, and infrared properties of the Lockman Hole X-ray sources.
Acknowledgments
G.H. and M.S acknowledge support by the German Deutsche Forschungsgemeinschaft, DFG Leibniz Prize (FKZ HA 1850/28-1). We thank M. Brusa for reading the manuscript and providing useful comments.
References
- Aird, J., Nandra, K., Laird, E. S., et al. 2010, MNRAS, 401, 2531 [NASA ADS] [CrossRef] [Google Scholar]
- Alonso-Herrero, A., Pérez-González, P. G., Alexander, D. M., et al. 2006, ApJ, 640, 167 [NASA ADS] [CrossRef] [Google Scholar]
- Antonucci, R. 1993, ARA&A, 31, 473 [Google Scholar]
- Ballantyne, D. R., Everett, J. E., & Murray, N. 2006, ApJ, 639, 740 [NASA ADS] [CrossRef] [Google Scholar]
- Barger, A. J., Cowie, L. L., Capak, P., et al. 2003, ApJ, 584, L61 [NASA ADS] [CrossRef] [Google Scholar]
- Barmby, P., Huang, J.-S., Ashby, M. L. N., et al. 2008, ApJS, 177, 431 [NASA ADS] [CrossRef] [Google Scholar]
- Barris, B. J., Tonry, J. L., Blondin, S., et al. 2004, ApJ, 602, 571 [NASA ADS] [CrossRef] [Google Scholar]
- Bauer, F. E., Alexander, D. M., Brandt, W. N., et al. 2004, AJ, 128, 2048 [NASA ADS] [CrossRef] [Google Scholar]
- Bertin, E., & Arnouts, S. 1996, A&AS, 117, 393 [NASA ADS] [CrossRef] [EDP Sciences] [Google Scholar]
- Brandt, W. N., & Hasinger, G. 2005, ARA&A, 43, 827 [Google Scholar]
- Brunner, H., Cappelluti, N., Hasinger, G., et al. 2008, A&A, 479, 283 [NASA ADS] [CrossRef] [EDP Sciences] [Google Scholar]
- Brusa, M., Comastri, A., Daddi, E., et al. 2005, A&A, 432, 69 [NASA ADS] [CrossRef] [EDP Sciences] [Google Scholar]
- Brusa, M., Fiore, F., Santini, P., et al. 2009, A&A, 507, 1277 [NASA ADS] [CrossRef] [EDP Sciences] [Google Scholar]
- Brusa, M., Civano, F., Comastri, A., et al. 2010, ApJ, 716, 348 [NASA ADS] [CrossRef] [Google Scholar]
- Cardamone, C. N., Urry, C. M., Damen, M., et al. 2008, ApJ, 680, 130 [NASA ADS] [CrossRef] [Google Scholar]
- Della Ceca, R., Maccacaro, T., Caccianiga, A., et al. 2004, A&A, 428, 383 [NASA ADS] [CrossRef] [EDP Sciences] [Google Scholar]
- Dey, A., Soifer, B. T., Desai, V., et al. 2008, ApJ, 677, 943 [NASA ADS] [CrossRef] [Google Scholar]
- Donley, J. L., Rieke, G. H., Pérez-González, P. G., Rigby, J. R., & Alonso-Herrero, A. 2007, ApJ, 660, 167 [NASA ADS] [CrossRef] [Google Scholar]
- Dwelly, T., Page, M. J., Loaring, N. S., et al. 2005, MNRAS, 360, 1426 [Google Scholar]
- Eckart, M. E., McGreer, I. D., Stern, D., Harrison, F. A., & Helfand, D. J. 2010, ApJ, 708, 584 [NASA ADS] [CrossRef] [Google Scholar]
- Egami, E., Dole, H., Huang, J.-S., et al. 2004, ApJS, 154, 130 [NASA ADS] [CrossRef] [Google Scholar]
- Elitzur, M., & Shlosman, I. 2006, ApJ, 648, L101 [NASA ADS] [CrossRef] [Google Scholar]
- Elston, R., Rieke, G. H., & Rieke, M. J. 1988, ApJ, 331, L77 [NASA ADS] [CrossRef] [Google Scholar]
- Elvis, M., Wilkes, B. J., McDowell, J. C., et al. 1994, ApJS, 95, 1 [NASA ADS] [CrossRef] [Google Scholar]
- Elvis, M., Risaliti, G., & Zamorani, G. 2002, ApJ, 565, L75 [NASA ADS] [CrossRef] [Google Scholar]
- Ferrarese, L., & Merritt, D. 2000, ApJ, 539, L9 [NASA ADS] [CrossRef] [Google Scholar]
- Finoguenov, A., Streblyanska, A., Hasinger, G., Hashimoto, Y., & Szokoly, G. 2005, AdSpR, 36, 710 [Google Scholar]
- Fiore, F., Grazian, A., Santini, P., et al. 2008, ApJ, 672, 94 [NASA ADS] [CrossRef] [Google Scholar]
- Fiore, F., Puccetti, S., Brusa, M., et al. 2009, ApJ, 693, 447 [NASA ADS] [CrossRef] [Google Scholar]
- Gebhardt, K., Bender, R., Bower, G., et al. 2000, ApJ, 539, L13 [NASA ADS] [CrossRef] [Google Scholar]
- Georgakakis, A., Hopkins, A. M., Afonso, J., et al. 2006b, MNRAS, 367, 331 [NASA ADS] [CrossRef] [Google Scholar]
- Georgakakis, A., Nandra, K., Yan, R., et al. 2008, MNRAS, 385, 2049 [NASA ADS] [CrossRef] [Google Scholar]
- Georgakakis, A., Clements, D. L., Bendo, G., et al. 2009, MNRAS, 394, 533 [NASA ADS] [CrossRef] [Google Scholar]
- Georgakakis, A. E., Georgantopoulos, I., & Akylas, A. 2006a, MNRAS, 366, 171 [NASA ADS] [CrossRef] [Google Scholar]
- Gilli, R., Comastri, A., & Hasinger, G. 2007, A&A, 463, 79 [NASA ADS] [CrossRef] [EDP Sciences] [Google Scholar]
- Gültekin, K., Richstone, D. O., Gebhardt, K., et al. 2009, ApJ, 698, 198 [NASA ADS] [CrossRef] [Google Scholar]
- Häring, N., & Rix, H.-W. 2004, ApJ, 604, L89 [NASA ADS] [CrossRef] [Google Scholar]
- Hasinger, G. 2008, A&A, 490, 905 [NASA ADS] [CrossRef] [EDP Sciences] [Google Scholar]
- Hasinger, G., Burg, R., Giacconi, R., et al. 1998, A&A, 329, 482 [NASA ADS] [Google Scholar]
- Hasinger, G., Altieri, B., Arnaud, M., et al. 2001, A&A, 365, L45 [NASA ADS] [CrossRef] [EDP Sciences] [Google Scholar]
- Hasinger, G., Cappelluti, N., Brunner, H., et al. 2007, ApJS, 172, 29 [NASA ADS] [CrossRef] [Google Scholar]
- Hickox, R. C., Jones, C., Forman, W. R., et al. 2009, ApJ, 696, 891 [Google Scholar]
- Hopkins, P. F., Hernquist, L., Cox, T. J., et al. 2005, ApJ, 630, 705 [NASA ADS] [CrossRef] [Google Scholar]
- Hopkins, P. F., Richards, G. T., & Hernquist, L. 2007, ApJ, 654, 731 [NASA ADS] [CrossRef] [Google Scholar]
- Hornschemeier, A. E., Bauer, F. E., Alexander, D. M., et al. 2003, AJ, 126, 575 [NASA ADS] [CrossRef] [Google Scholar]
- Houck, J. R., Soifer, B. T., Weedman, D., et al. 2005, ApJ, 622, L105 [NASA ADS] [CrossRef] [Google Scholar]
- Ilbert, O., Capak, P., Salvato, M., et al. 2009, ApJ, 690, 1236 [NASA ADS] [CrossRef] [Google Scholar]
- Isobe, T., Feigelson, E. D., Akritas, M. G., & Babu, G. J. 1990, ApJ, 364, 104 [NASA ADS] [CrossRef] [EDP Sciences] [Google Scholar]
- Kim, M., Wilkes, B. J., Kim, D.-W., et al. 2007, ApJ, 659, 29 [Google Scholar]
- Kormendy, J. 1983, ApJ, 275, 529 [NASA ADS] [CrossRef] [Google Scholar]
- La Franca, F., Fiore, F., Comastri, A., et al. 2005, ApJ, 635, 864 [NASA ADS] [CrossRef] [Google Scholar]
- Lacy, M., Storrie-Lombardi, L. J., Sajina, A., et al. 2004, ApJS, 154, 166 [NASA ADS] [CrossRef] [Google Scholar]
- Lacy, M., Sajina, A., Petric, A. O., et al. 2007, ApJ, 669, L61 [NASA ADS] [CrossRef] [Google Scholar]
- Lawrence, A., Warren, S. J., Almaini, O., et al. 2007, MNRAS, 379, 1599 [NASA ADS] [CrossRef] [MathSciNet] [Google Scholar]
- Lehmann, I., Hasinger, G., Schmidt, M., et al. 2000, A&A, 354, 35 [NASA ADS] [Google Scholar]
- Lehmann, I., Hasinger, G., Schmidt, M., et al. 2001, A&A, 371, 833 [NASA ADS] [CrossRef] [EDP Sciences] [Google Scholar]
- Lilly, S. J., Le Fevre, O., Hammer, F., & Crampton, D. 1996, ApJ, 460, L1 [NASA ADS] [CrossRef] [Google Scholar]
- Lonsdale, C. J., Smith, H. E., Rowan-Robinson, M., et al. 2003, PASP, 115, 897 [NASA ADS] [CrossRef] [Google Scholar]
- Luo, B., Brandt, W. N., Xue, Y. Q., et al. 2010, ApJS, 187, 560 [NASA ADS] [CrossRef] [Google Scholar]
- Lutz, D., Mainieri, V., Rafferty, D., et al. 2010, ApJ, 712, 1287 [NASA ADS] [CrossRef] [Google Scholar]
- Magorrian, J., Tremaine, S., Richstone, D., et al. 1998, AJ, 115, 2285 [NASA ADS] [CrossRef] [Google Scholar]
- Mainieri, V., Bergeron, J., Hasinger, G., et al. 2002, A&A, 393, 425 [NASA ADS] [CrossRef] [EDP Sciences] [Google Scholar]
- Maiolino, R., Marconi, A., Salvati, M., et al. 2001a, A&A, 365, 28 [NASA ADS] [CrossRef] [EDP Sciences] [Google Scholar]
- Maiolino, R., Marconi, A., & Oliva, E. 2001b, A&A, 365, 37 [NASA ADS] [CrossRef] [EDP Sciences] [Google Scholar]
- Mateos, S., Barcons, X., Carrera, F. J., et al. 2005, A&A, 444, 79 [NASA ADS] [CrossRef] [EDP Sciences] [Google Scholar]
- Merloni, A., Bongiorno, A., Bolzonella, M., et al. 2010, ApJ, 708, 137 [NASA ADS] [CrossRef] [Google Scholar]
- Moustakas, L. A., Casertano, S., Conselice, C. J., et al. 2004, ApJ, 600, L131 [NASA ADS] [CrossRef] [Google Scholar]
- Nandra, K., Georgakakis, A., Willmer, C. N. A., et al. 2007, ApJ, 660, L11 [NASA ADS] [CrossRef] [Google Scholar]
- Nenkova, M., Sirocky, M. M., Ivesić, Ž., & Elitzur, M. 2008a, ApJ, 685, 147 [NASA ADS] [CrossRef] [Google Scholar]
- Nenkova, M., Sirocky, M. M., Nikutta, R., Ivesić, Ž., & Elitzur, M. 2008b, ApJ, 685, 160 [NASA ADS] [CrossRef] [Google Scholar]
- Neugebauer, G., Oke, J. B., Becklin, E. E., & Matthews, K. 1979, ApJ, 230, 79 [NASA ADS] [CrossRef] [Google Scholar]
- Pérez-González, P. G., Trujillo, I., Barro, G., et al. 2008, ApJ, 675, 234 [NASA ADS] [CrossRef] [Google Scholar]
- Pierce, C. M., Lotz, J. M., Primack, J. R., et al. 2010a, MNRAS, 405, 718 [NASA ADS] [Google Scholar]
- Pierce, C. M., Lotz, J. M., Salim, S., et al. 2010b, MNRAS, 408, 139 [NASA ADS] [CrossRef] [Google Scholar]
- Polletta, M., Tajer, M., Maraschi, L., et al. 2007, ApJ, 663, 81 [NASA ADS] [CrossRef] [Google Scholar]
- Pope, A., Bussmann, R. S., Dey, A., et al. 2008, ApJ, 689, 127 [Google Scholar]
- Pozzi, F., Vignali, C., Comastri, A., et al. 2007, A&A, 468, 603 [NASA ADS] [CrossRef] [EDP Sciences] [Google Scholar]
- Richards, G. T., Lacy, M., Storrie-Lombardi, L. J., et al. 2006, ApJS, 166, 470 [NASA ADS] [CrossRef] [Google Scholar]
- Rieke, G. H., & Lebofsky, M. J. 1981, ApJ, 250, 87 [NASA ADS] [CrossRef] [Google Scholar]
- Rovilos, E., & Georgantopoulos, I. 2007, A&A, 475, 115 [NASA ADS] [CrossRef] [EDP Sciences] [Google Scholar]
- Rovilos, E., Georgakakis, A., Georgantopoulos, I., et al. 2007, A&A, 466, 119 [NASA ADS] [CrossRef] [EDP Sciences] [Google Scholar]
- Rovilos, E., Burwitz, V., Szokoly, G., et al. 2009, A&A, 507, 195 [NASA ADS] [CrossRef] [EDP Sciences] [Google Scholar]
- Rovilos, E., Georgantopoulos, I., Akylas, A., & Fotopoulou, S. 2010, A&A, 522, A11 [NASA ADS] [CrossRef] [EDP Sciences] [Google Scholar]
- Salvato, M., Hasinger, G., Ilbert, O., et al. 2009, ApJ, 690, 1250 [CrossRef] [Google Scholar]
- Schmidt, M., Hasinger, G., Gunn, J., et al. 1998, A&A, 329, 495 [NASA ADS] [Google Scholar]
- Severgnini, P., Della Ceca, R., Braito, V., et al. 2005, A&A, 431, 87 [NASA ADS] [CrossRef] [EDP Sciences] [Google Scholar]
- Shi, Y., Rieke, G. H., Hines, D. C., et al. 2006, ApJ, 653, 127 [NASA ADS] [CrossRef] [Google Scholar]
- Silverman, J. D., Green, P. J., Barkhouse, W. A., et al. 2005, ApJ, 618, 123 [NASA ADS] [CrossRef] [Google Scholar]
- Silverman, J. D., Mainieri, V., Lehmer, B. D., et al. 2008a, ApJ, 675, 1025 [NASA ADS] [CrossRef] [Google Scholar]
- Silverman, J. D., Green, P. J., Barkhouse, W. A., et al. 2008b, ApJ, 679, 118 [NASA ADS] [CrossRef] [Google Scholar]
- Silverman, J. D., Lamareille, F., Maier, C., et al. 2009, ApJ, 696, 396 [NASA ADS] [CrossRef] [Google Scholar]
- Stern, D., Eisenhardt, P., Gorjian, V., et al. 2005, ApJ, 631, 163 [NASA ADS] [CrossRef] [Google Scholar]
- Strateva, I. V., Brandt, W. N., Schneider, D. P., Van den Berk, D. G., & Vignali, C. 2005, AJ, 130, 387 [NASA ADS] [CrossRef] [Google Scholar]
- Surace, J. A., Shupe, D. L., Fang, F., et al. 2005, A&AS, 207, 6301 [Google Scholar]
- Sutherland, W., & Saunders, W. 1992, MNRAS, 259, 413 [NASA ADS] [CrossRef] [Google Scholar]
- Szokoly, G. P., Bergeron, J., Hasinger, G., et al. 2004, ApJS, 155, 271 [NASA ADS] [CrossRef] [Google Scholar]
- Tajer, M., Polletta, M., Chiappetti, L., et al. 2007, A&A, 467, 73 [NASA ADS] [CrossRef] [EDP Sciences] [Google Scholar]
- Tozzi, P., Gilli, R., Mainieri, V., et al. 2006, A&A, 451, 457 [NASA ADS] [CrossRef] [EDP Sciences] [Google Scholar]
- Treister, E., & Urry, C. M. 2006, ApJ, 652, L79 [NASA ADS] [CrossRef] [Google Scholar]
- Treister, E., Virani, S., Gawiser, E., et al. 2009, ApJ, 693, 1713 [NASA ADS] [CrossRef] [Google Scholar]
- Tremaine, S., Gebhardt, K., Bender, R., et al. 2002, ApJ, 574, 740 [NASA ADS] [CrossRef] [Google Scholar]
- Turner, T. J., George, I. M., Nandra, K., & Mushotzky, R. F. 1997, ApJS, 113, 23 [NASA ADS] [CrossRef] [Google Scholar]
- Ueda, Y., Akiyama, M., Ohta, K., & Miyaji, T. 2003, ApJ, 598, 886 [NASA ADS] [CrossRef] [Google Scholar]
- Wada, K., Papadopoulos, P. P., & Spaans, M. 2009, ApJ, 702, 63 [NASA ADS] [CrossRef] [Google Scholar]
- Wang, J. X., Malhotra, S., Rhoads, J. E., & Norman, C. A. 2004, ApJ, 612, L109 [NASA ADS] [CrossRef] [Google Scholar]
- Woo, J.-H., Treu, T., Malkan, M. A., & Blandford, R. D. 2008, ApJ, 681, 925 [NASA ADS] [CrossRef] [Google Scholar]
All Tables
Various information of the different catalogues used in this work and the correlation of X-ray sources.
Fractions of obscured (with HR > − 0.4) X-ray AGN with respect to their mid-infrared (24 μm) to optical flux ratio and RC − K colour.
Basic X-ray, optical, and infrared properties of the Lockman Hole X-ray sources.
All Figures
|
Fig. 1 Various distributions used for the calculation of the likelihood ratio of the K-band to X-ray counterparts. The histograms represent the total(m), |
| In the text | |
|
Fig. 2 Coverage of the Lockman Hole region that contains the XMM-Newton X-ray sources (plotted in crosses). The dotted, solid, dashed, long-dashed, and dot-dashed lines represent the borders of the LBT (U-B-V bands), Subaru (RC-IC-z′ bands), UKIDSS, IRAC, and MIPS exposures, respectively. |
| In the text | |
|
Fig. 3 XMM Lockman Hole sources plotted on the Stern et al. (2005) diagram. In blue and red circles are plotted the soft and hard X-ray sources according to their hardness-ratios, while large symbols mark sources with bright optical and mid-infrared fluxes (RAB < 21.5 and f3.6 μm > 12 μJy) to imitate the selection criteria used by Stern et al. (2005). Grey dots represent the mid-infrared colours of all IRAC detections in the Lockman Hole, and the lines are tracks of different SED templates with 0 < z < 4. This figure is available in color in electronic form. |
| In the text | |
|
Fig. 4 X-ray-to-optical flux ratio versus RC − K colour of the X-ray AGN in the Lockman Hole. Blue and red colours represent hard and soft X-ray sources respectively according to their hardness-ratio, and different symbols represent the position of the IRAC counterpart in the Stern diagram (Fig. 3). Filled circles are sources in the wedge (with MIR colours typical of AGN), open circles are sources outside the wedge (with MIR colours typical of non-active galaxies) and asterisks are sources without full IRAC photometry, either because they are fainter than the IRAC limiting magnitude or because they are out of the field. The solid line is the best-fit line to the positions of the filled circles, while the dashed lines mark its 1σ limits. This figure is available in color in electronic form. |
| In the text | |
|
Fig. 5 Mid-infrared (24 μm) to optical (RC) flux ratio versus RC − K colour of the X-ray AGN in the Lockman Hole. The blue and red symbols are identical with those in Fig. 4, while the grey dots represent all optical-IRAC-MIPS sources in the Lockman Hole. The black lines are the tracks of QSO and Arp 220 SEDs with 0 < z < 3, while the violet lines are tracks of SED combinations between QSOs and host galaxies (non type-1 Seyferts). Green lines from right to left are tracks of elliptical, spirals, and irregular galaxies. This figure is available in color in electronic form. |
| In the text | |
|
Fig. 6 Optical (RC-band) versus X-ray (0.5 − 10 keV) flux of the XMM-Newton sources. With blue and red symbols we plot the soft and hard X-ray sources respectively, which are characterised by their hardness-ratio, where HR = −0.4 is the dividing value. Different shapes are used according to the positions in the IRAC colour–colour wedge, similar to Figs. 4 and 5. Crosses mark the positions of EROs (with RC − K > 5) and lines mark log (fx/fo) = 1, − 1, and − 2. This figure is available in color in electronic form. |
| In the text | |
|
Fig. 7 Same as Fig. 6 with the UKIDSS K-band flux instead of RC. This figure is available in color in electronic form. |
| In the text | |
|
Fig. 8 Variation of the fraction of obscured (with HR < − 0.4) EROs with respect to X-ray flux. The dashed line is at 63.6%, where the overall fraction of obscured EROs with fx > 10-15 erg s-1 cm-2 is. We do not see any significant dependency of the fraction of obscured EROs with X-ray flux, except for sources with fx < 10-15 erg s-1 cm-2. The vertical error-bars are Poisson estimates, while the horizontal are the bin widths, which were chosen to contain the same number of sources. |
| In the text | |
|
Fig. 9 X-ray colour − colour diagram of the Lockman Hole sources. EROs (with RC − K > 5) are plotted with black symbols, while the non-ERO population is plotted in grey. The symbols (open-filled circles and asterisks) are identical to Fig. 4. The horizontal line at HR1 = −0.4 is the dividing line between soft and hard sources adopted for this paper and the purple region is the region where the “leaky absorber” effect is important (see text). The cross in the top right corner shows a typical error-bar with dHR1 = 0.15 and dHR2 = 0.20, while crosses on the individual sources mark AGN with a known spectroscopic redshift. |
| In the text | |
|
Fig. 10 Fraction of obscured (with HR > −0.4) X-ray AGN versus RC − K colour. Filled circles and the solid line represent sources whose mid-infrared IRAC colours satisfy the Stern et al. (2005) criteria and are assumed to be AGN-dominated in the optical-infrared, while open circles and the dashed line represent sources where the host galaxy is assumed to dominate the optical-infrared flux. |
| In the text | |
|
Fig. 11 RC − K colour versus K-band magnitude of X-ray AGN in the Lockman Hole. The blue and red symbols are identical to Figs. 4 and 5, while the grey dots represent the colours of the optical-UKIDSS normal galaxies. The left-side and right-side coloured histograms refer to the open and filled symbols, while the grey histogram on both sides refers to the grey dots. This figure is available in color in electronic form. |
| In the text | |
Current usage metrics show cumulative count of Article Views (full-text article views including HTML views, PDF and ePub downloads, according to the available data) and Abstracts Views on Vision4Press platform.
Data correspond to usage on the plateform after 2015. The current usage metrics is available 48-96 hours after online publication and is updated daily on week days.
Initial download of the metrics may take a while.