Fig. 6
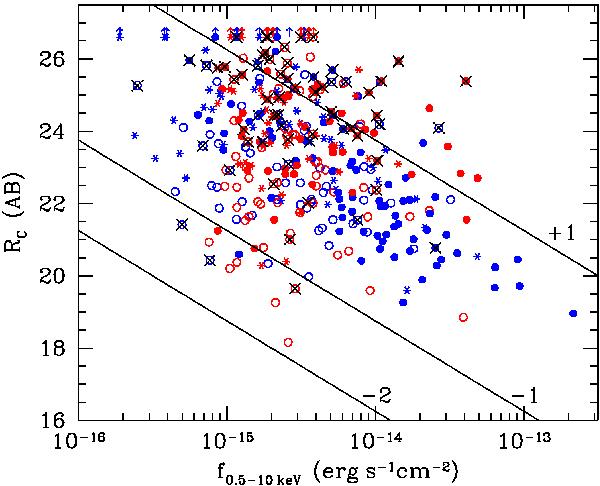
Optical (RC-band) versus X-ray (0.5 − 10 keV) flux of the XMM-Newton sources. With blue and red symbols we plot the soft and hard X-ray sources respectively, which are characterised by their hardness-ratio, where HR = −0.4 is the dividing value. Different shapes are used according to the positions in the IRAC colour–colour wedge, similar to Figs. 4 and 5. Crosses mark the positions of EROs (with RC − K > 5) and lines mark log (fx/fo) = 1, − 1, and − 2. This figure is available in color in electronic form.
Current usage metrics show cumulative count of Article Views (full-text article views including HTML views, PDF and ePub downloads, according to the available data) and Abstracts Views on Vision4Press platform.
Data correspond to usage on the plateform after 2015. The current usage metrics is available 48-96 hours after online publication and is updated daily on week days.
Initial download of the metrics may take a while.