Fig. 3
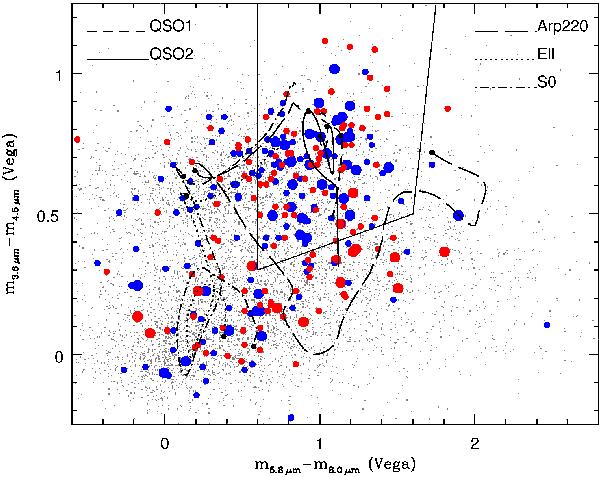
XMM Lockman Hole sources plotted on the Stern et al. (2005) diagram. In blue and red circles are plotted the soft and hard X-ray sources according to their hardness-ratios, while large symbols mark sources with bright optical and mid-infrared fluxes (RAB < 21.5 and f3.6 μm > 12 μJy) to imitate the selection criteria used by Stern et al. (2005). Grey dots represent the mid-infrared colours of all IRAC detections in the Lockman Hole, and the lines are tracks of different SED templates with 0 < z < 4. This figure is available in color in electronic form.
Current usage metrics show cumulative count of Article Views (full-text article views including HTML views, PDF and ePub downloads, according to the available data) and Abstracts Views on Vision4Press platform.
Data correspond to usage on the plateform after 2015. The current usage metrics is available 48-96 hours after online publication and is updated daily on week days.
Initial download of the metrics may take a while.