Fig. 9
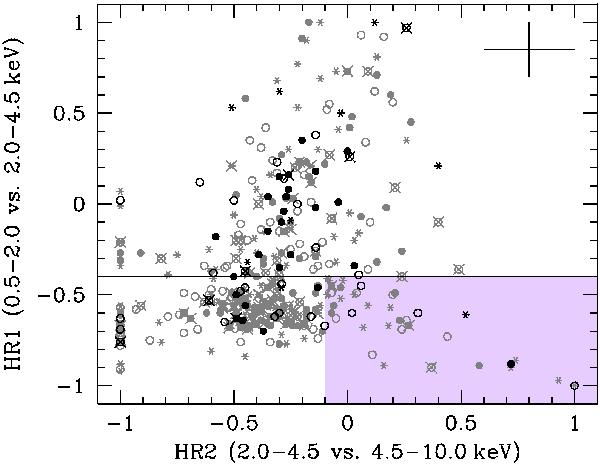
X-ray colour − colour diagram of the Lockman Hole sources. EROs (with RC − K > 5) are plotted with black symbols, while the non-ERO population is plotted in grey. The symbols (open-filled circles and asterisks) are identical to Fig. 4. The horizontal line at HR1 = −0.4 is the dividing line between soft and hard sources adopted for this paper and the purple region is the region where the “leaky absorber” effect is important (see text). The cross in the top right corner shows a typical error-bar with dHR1 = 0.15 and dHR2 = 0.20, while crosses on the individual sources mark AGN with a known spectroscopic redshift.
Current usage metrics show cumulative count of Article Views (full-text article views including HTML views, PDF and ePub downloads, according to the available data) and Abstracts Views on Vision4Press platform.
Data correspond to usage on the plateform after 2015. The current usage metrics is available 48-96 hours after online publication and is updated daily on week days.
Initial download of the metrics may take a while.