| Issue |
A&A
Volume 693, January 2025
|
|
|---|---|---|
| Article Number | A81 | |
| Number of page(s) | 12 | |
| Section | Planets, planetary systems, and small bodies | |
| DOI | https://doi.org/10.1051/0004-6361/202452832 | |
| Published online | 03 January 2025 | |
A multi-technique detection of an eccentric giant planet around the accelerating star HD 57625
1
INAF – Osservatorio Astronomico di Padova,
Vicolo dell’Osservatorio 5,
35122
Padova,
Italy
2
Department of Physics, University of Rome Tor Vergata,
via della Ricerca Scientifica 1,
00133
Rome,
Italy
3
INAF – Osservatorio Astrofisico di Catania,
Via S. Sofia 78,
95123
Catania,
Italy
4
Department of Astronomy and Steward Observatory, The University of Arizona,
933 North Cherry Ave,
Tucson,
AZ85721,
USA
5
Large Binocular Telescope Observatory, The University of Arizona,
933 North Cherry Ave,
Tucson,
AZ85721,
USA
6
Max Planck Institute for extraterrestrial Physics,
Gießenbachstraße 1,
85748
Garching bei München,
Germany
7
Max Planck Institute for Astronomy,
Königstuhl 17,
69117
Heidelberg,
Germany
8
Univ. Grenoble Alpes, CNRS, IPAG,
38000
Grenoble,
France
9
Department of Physics and Astronomy, University of Padova,
Vicolo dell’Osservatorio 3,
35122
Padova,
Italy
10
Leiden Observatory, University of Leiden,
PO Box 9513,
2300
RA
Leiden,
The Netherlands
11
INAF Osservatorio Astronomico d’Abruzzo, Via Mentore Maggini,
64100
Teramo,
Italy
12
School of Earth and Space Exploration, Arizona State University,
Tempe,
AZ
85281,
USA
13
INAF – Osservatorio Astrofisico di Torino,
Via Osservatorio 20,
10025
Pino Torinese,
Italy
14
Dipartimento di Fisica e Astronomia “Augusto Righi” - Alma Mater Studiorum Università di Bologna,
via Piero Gobetti 93/2,
40129
Bologna,
Italy
★ Corresponding author; This email address is being protected from spambots. You need JavaScript enabled to view it.
Received:
31
October
2024
Accepted:
5
December
2024
Abstract
Context. The synergy between different detection methods is a key asset in exoplanetology that allows the precise characterization of detected exoplanets and robust constraints even in the case of a non-detection. The interplay between imaging, radial velocities and astrometry has recently produced significant advancements in exoplanetary science.
Aims. We report a first result of an ongoing survey performed with SHARK-NIR, the new high-contrast near-infrared imaging camera at the Large Binocular Telescope, in parallel with LBTI/LMIRCam in order to detect planetary companions around stars with a significant proper motion anomaly. We focus on HD 57625, a F8 star for which we determine a 4.8−2.9+3.7 Ga age, exhibiting significant astrometric acceleration and for which archival radial velocities indicate a previously undetected massive long-period companion.
Methods. We analysed the imaging data we collected with SHARK-NIR and LMIRCam in synergy with the available public SOPHIE radial velocity time series and HIPPARCOS-Gaia proper motion anomaly. With this joint multi-technique analysis, we characterised the companion causing the astrometric and radial velocity signals.
Results. The imaging observations result in a non-detection, indicating the companion to be in the substellar regime. This is confirmed by the synergic analysis of archival radial velocity and astrometric measurements resulting in the detection of HD 57625 b, a 8.43−0.91+1.1 MJup planetary companion with an orbital separation of 5.70−0.13+0.14 au and an eccentricity of 0.52−0.03+0.04.
Conclusions. HD 57625 b joins the small but growing population of giant planets on outer orbits with a true mass determination provided by the synergic usage of multiple detection methods. This again proves the importance of a multi-technique analysis in providing a robust characterization of planetary companions.
Key words: techniques: image processing / techniques: radial velocities / astrometry / planets and satellites: detection / planetary systems
© The Authors 2025
 Open Access article, published by EDP Sciences, under the terms of the Creative Commons Attribution License (https://creativecommons.org/licenses/by/4.0), which permits unrestricted use, distribution, and reproduction in any medium, provided the original work is properly cited.
This article is published in open access under the Subscribe to Open model. This email address is being protected from spambots. You need JavaScript enabled to view it. to support open access publication.
1 Introduction
As the continuous growth of exoplanetology results in new detections of planetary companions and in a refined and more detailed characterisation of known systems, the development of new and more precise instrumentation continues to fuel the exploration of all facets of exoplanetary science. As a result, the synergic interplay between the many discovery techniques available in the field becomes an increasingly key asset in furthering our search for exoplanetary systems. Among these various techniques, direct imaging is especially well suited for detecting giant companions on wide orbits (≳10 au) around young stars. It is therefore able to provide an unparalleled view of the early stages of exoplanet formation and evolution processes. Some notable examples of exoplanetary systems that were discovered and characterised by imaging observations include HR 8799 (Marois et al. 2008, 2010), GJ 504 (Kuzuhara et al. 2013), 51 Eri (Macintosh et al. 2015), PDS 70 (Keppler et al. 2018; Müller et al. 2018; Haffert et al. 2019) and AF Lep (Mesa et al. 2023; Franson et al. 2023; De Rosa et al. 2023).
Although successful, as every other discovery technique, the imaging method is characterised by drawbacks that limit its potential. Chiefly, imaging observations are highly time-consuming. They require long exposures that can easily reach a few hours depending on the characteristics of the target star. This affects the scientific yield of observing nights. Additionally, the return of imaging surveys is intrinsically limited by the observed low occurrence rate of the wide-orbit massive companions for which the technique is ideally suited. This often results in the need to observe hundreds of targets to successfully detect a low number of companions in the planetary mass regime (see e.g. Galicher et al. 2016; Nielsen et al. 2019; Vigan et al. 2021). Demographic studies suggest that the orbits of most giant planets have semi-major axes between 1 and 10 au, and that they peak for example at ~3 au for M-dwarf host stars (see e.g. Meyer et al. 2018). This places a significant portion of giant exoplanets beyond the technical capabilities of current high-contrast imagers. The relatively low imaging detection rate of planetary-mass companions therefore represents a significant obstacle in bringing the potential of imaging surveys to full fruition.
It is therefore clear that the use of pre-selection criteria to identify the stellar targets that are more likely to host planetary companions within the reach of current imaging instruments is essential to enhance the scientific yield of imaging surveys. These criteria provide preliminary indications of the presence of planetary-mass companions and allow targeted observations, and they arise from the synergic usage of other detection techniques. This again highlights the increasing importance of the interplay between different techniques in exoplanetology.
A typical example of these pre-selection criteria is represented by the identification in radial velocity (RV) time series of either a full Keplerian orbital variation or trends indicating undetected massive companions with an orbital period longer than the time span of the available RV observations, ideal for imaging follow-up observations and a robust detection. Successful examples of this strategy in the recent literature include the direct detection of brown dwarf (BD) GJ 758 B (Calissendorff & Janson 2018) and exoplanets β Pic c (Nowak et al. 2020), HD 206893 c (Hinkley et al. 2023) and ε Ind Ab (Matthews et al. 2024) with imaging observations that confirmed previous RV-only results.
Another successful pre-selection criterion focuses on the exploitation of the high-precision absolute astrometric catalogues produced by the HIPPARCOS (van Leeuwen 2007) and Gaia (Gaia Collaboration 2016) missions, in the latter case using its second and third major data releases (DR2 and DR3, see Gaia Collaboration 2018, 2023). Specifically, a statistically significant difference between the long-term proper motion vector of a star common to the two catalogues and the short-term Gaia (and HIPPARCOS) measurements, typically referred to as proper motion anomaly (PMa), indicates the presence of a perturbing companion. The recent release of HIPPARCOS-Gaia astrometric acceleration catalogues (Brandt 2021; Kervella et al. 2022) has fueled the use of significant PMa as apre-selection tool for imaging surveys and resulted in the detection of brown dwarf companions (see e.g. Calissendorff & Janson 2018; Currie et al. 2020; Bonavita et al. 2022) and is recently starting to show its exoplanetary potential in the detection of AF Lep b (see e.g. Mesa et al. 2023; De Rosa et al. 2023; Franson et al. 2023).
In both cases, imaging observations can either successfully detect the planetary companion causing for the RV trend or the significant PMa or, in the case of a non-detection, provide robust constraints on the companion mass and orbital separation based on the detection capabilities of the specific instrument (see e.g. Mesa et al. 2022). Even a non-detection can therefore advance the characterisation of candidate planetary companions and fuel follow-up observations, once more proving the opportunities represented by the synergic usage of multi-technique analysis.
The observation of a sample of stars exhibiting significant astrometric acceleration therefore is a key scientific program selected for the early-science validation phase of SHARK-NIR (Farinato et al. 2022, 2023; Marafatto et al. 2022), a high-contrast camera operating in the Y, J and H near-infrared bands that has recently been installed on the left arm of the Large Binocular Telescope (LBT) in Arizona. The instrument is designed to fully take advantage of the extreme adaptive optics (AO) correction performed by the LBT AO system SOUL (Single Conjugated Adaptive Optics Upgrade for LBT, see Pinna et al. 2016; Pinna et al. 2023). Detailed simulations have shown that SHARK-NIR is in good weather able to achieve Strehl exceeding 90% and contrast levels down to 10−6 at separations of 300–500 mas (Carolo et al. 2018). The instrument location at the LBT common centre-bent Gregorian focus allows synergic simultaneous high-contrast observations with SHARK-VIS (operating in visible light, see Pedichini et al. 2022) and LBTI/LMIRCam (operating in J to M infrared bands, see Skrutskie et al. 2010; Leisenring et al. 2012). Installed on the LBT in October 2022, SHARK-NIR has afterwards completed its commissioning phase and is now undertaking its early-science validation runs (as detailed in Barbato et al. 2024) directly addressing its scientific goals, namely the detection and characterisation of giant extrasolar planets, disks and jets around young stars, active galactic nuclei, and Solar System small bodies.
We present the first results from the accelerating stars survey that is to be further presented in Mesa et al. (2025), performed with SHARK-NIR during its first early science-runs, more specifically focusing on the observations undertaken in February 2024 on star HD 57625 (HIP 36014). This star was selected as part of SHARK-NIR early-science observations by virtue of its significant PMa reported in Kervella et al. (2022), with a signal-to-noise ratio (S/N) of 11.04, and archival SOPHIE RV time series showing a clear long-term variation. These two characteristics indicate the presence of a previously undetected long-period giant planetary companion that we present and characterise for the first time via a multi-technique analysis.
This paper is organised as follows. In Sect. 2 we provide an updated description of the physical characteristics of the target star before we describe the SHARK-NIR and LMIRCam observations and the data analysis in Sect. 3, and we analyse the archival radial velocity data in Sect. 4 and the proper motion anomaly measurements in Sect. 5. Finally, we perform a multi-technique detection completeness characterisation of the target star in Sect. 6, before we conclude and discuss our results and future perspectives in Sect. 7.
2 Stellar characterisics of HD 57625
HD 57625 (HIP 36014) is an F8 star at 44.24 pc from the Sun. It is estimated to be 6.29 Ga old (Gaia Collaboration 2023) and has a reported mass of 1.16 ± 0.06 M⊙ (Kervella et al. 2022). As mentioned in Sect. 1, the astrometric acceleration catalogue presented in Kervella et al. (2022) reported a strong PMa signal with an S/N of 11.04, which indicates the likely presence of an unseen massive companion.
HD 57625 is part of a wide binary system, with a fainter stellar companion (2MASS J07251770+5634002, Gaia DR3 989016790859521280, G =15.17 mag) located at 10″, which corresponds to a projected separation of ~440 au. The physical association is supported by the Gaia astrometric parameters1. A mass of ~0.2 M⊙ was estimated for the companion from the main-sequence relationships by Pecaut & Mamajek (2013)2. We note that the observed PMa is not compatible with this distant low-mass stellar companion, as we discuss in Sect. 5.
For the further characterisation, we exploited archival spectra taken with SOPHIE, as described in Sect. 4, to derive the atmospheric parameters and metallicity. We employed LOTUS (non-LTE Optimisation Tool Utilized for the derivation of atmospheric Stellar parameters) by Li & Ezzeddine (2023)3 and adopted an optimised linelist for solar analogues, which is available upon request. This tool calculates the parameters using the equivalent width (EW) method for Fe I and II lines, incorporating a generalized curve of growth approach to account for EW dependencies on the corresponding atmospheric stellar parameters. A global differential evolution optimisation algorithm was applied to extract the fundamental parameters. Furthermore, LOTUS provides precise uncertainties for each stellar parameter through a Markov chain Monte Carlo algorithm. The resulting spectroscopic effective temperature (Teff) is 5962±43 K, the stellar gravity is log g 4.47±0.08 dex, the microturbulent velocity is Vmic=1.00±0.03 km s−1, and the iron abundance [Fe/H] is −0.04±0.02 (random errors). These results are consistent within the observational uncertainties with the available estimates in the literature.
For an updated and homogeneous characterisation of the physical properties of HD 57625 for our analysis, we fitted its stellar spectral energy distribution (SED) using the MESA Isochrones and Stellar Tracks (MIST) (Dotter 2016; Choi et al. 2016) via the IDL suite EXOFASTv2 (Eastman et al. 2019). With this method, the stellar parameters are simultaneously constrained by the SED and the MIST isochrones, since the SED primarily constrains the stellar radius R⋆ and effective temperature Teff, while a penalty for straying from the MIST evolutionary tracks ensures that the resulting star is physical in nature (see Eastman et al. 2019, for more details on the method). We considered all available archival magnitudes from the Tycho BT and VT bands (Høg et al. 2000), the Johnson’s B, V and the 2MASS J, H, and K bands from the UCAC4 catalogue (Zacharias et al. 2012; Cutri et al. 2003), WISE bands (Cutri et al. 2021), and Gaia G, GBP, and GRP bands (Gaia Collaboration 2023), imposing Gaussian priors on the stellar effective temperature Teff and metallicity [Fe/H] based on their respective values as obtained from the activity indexes analysis detailed in the previous paragraph, as well as on the stellar parallax ϖ based on the Gaia DR3 astrometric measurement (Gaia Collaboration 2023). We list the resulting best-fit stellar parameters in Table 1 together with the other parameters resulting from the entire analysis detailed in this section.
The resulting age from the isochrones is in general agreement with the evidences from other indicators, such as the low activity inferred from the SOPHIE spectra discussed in the next paragraph, the X-ray non-detection in the Rosat All Sky Survey (Voges et al. 1999, 2000), the slow rotation (Głębocki & Gnaciński 2005), and the thin disk kinematics (Gaia Collaboration 2021). Therefore, we adopt the isochrone age and corresponding stellar mass in the rest of this work.
To determine the activity level of HD 57625 and verify whether the detected RV signal (see Sect. 4) is related to an activity cycle, we used the Python tool ACTIN24 (Gomes da Silva et al. 2018, 2021) to extract the activity indicators from the SOPHIE spectra. In particular, we used the following indicators: the emission from the Ca II H & K lines (SMW), Hα, and Na I D2 line, whose median values and corresponding 1σ error bars are shown in Table 1. In Fig. 1 we plot the resulting activity index time series, as well as the RV, the full width at half maximum (FWHM) and the bisector inverse span (BIS) that are analysed in detail in Sect. 4. We produced generalized Lomb-Scargle (GLS) periodograms for each activity index time series and found for SMW a long-period oscillation (>5000 d), while for Hα we found a very significant (FAP ≪ 0.001%) peak at 11.35 d, as well as another long-period (>5000 d) trend. Interestingly, the 11.35 d peak is exactly half the rotation period of the star as derived from the SMW time series using the equations by Noyes et al. (1984) and Mamajek & Hillenbrand (2008). In particular, we obtained Prot, Noyes = 22.25 ± 4.23 d and Prot, Mamajek = 22.47 ± 4.96 d, which perfectly agree with each other. For the Na I, we found a low-significance (FAP = 2.6%) principal peak at 4 d, which indicates that this time series contains no strong signal. Based on this analysis, we conclude that HD 57625 lacks any strong activity, excluding possible long-period cycles inferred from the SMW and Hα time series. We additionally note that all activity indexes we analysed appear to be uncorrelated to the observed large RV variation, with the highest Pearson correlation coefficient ρ being that of SMW, which indicates a moderate correlation (ρ = 0.49) that we further address in Sect. 4.
Stellar parameters for HD 57625.
3 Imaging observations and analysis
We observed HD 57625 with SHARK-NIR on the night of February 24, 2024 UT using the broad-band H filter (central wavelength at 1.6 μm and 0.218 μm bandwidth) and the Gaussian coronagraph of the instrument, which has an inner working angle (IWA) of 120 mas. At the 44.24 pc distance of HD 57625 this corresponds to a separation of 5.30 au. We obtained a total of 208 frames each with a 18.7257 s detector integration time (DIT) for a total exposure time of ~3895 s (~65 minutes). The observations were performed in pupil-stabilized mode in order to implement angular differential imaging (ADI, see e.g. Marois et al. 2006), which allows a total rotation of the field of view (FOV) of 40.58 deg. During the observations the seeing varied between 0.94″ and 2.19″. We also took an image in which the stellar PSF was not occulted by the coronagraph both before and after the main coronagraphic observations, to be able to correctly estimate the contrast on the scientific image. These frames were taken by introducing a neutral density filter (ND3) in the optical path to avoid the saturation of the detector.
In addition to the SHARK-NIR observations, we simultaneously observed our target with LBTI/LMIRCam (Skrutskie et al. 2010; Leisenring et al. 2012) on the right arm of LBT. These observations were performed in the L′ spectral band (central wavelength at 3.7 μm and 0.58 μm bandwidth) using the vector-apodizing phase plate coronagraph (vAPP, Doelman et al. 2021), with an IWA of 246 mas corresponding to a separation of 10.88 au for HD 57625. In this case we obtained 3200 frames, each with a DIT of 1.51085 s for a total exposure time of 4834.72 s (80.58 minutes). The LMIRCam observations were also performed in pupil-stabilized mode with a total rotation of the FOV of 43.38 deg.
Because of the non-destructive charge transfer capability of the SHARK-NIR scientific detector, each individual exposure is a ramp, that is, a set of reads taken at uniform time intervals. The raw ramps were first reduced using a Python pipeline specifically developed for the SHARK-NIR detector, that performed reference pixel correction, bias subtraction, and linearity correction. Finally, the software collapsed the ramps into single frames using an up-the-ramp sampling algorithm.
The SHARK-NIR data were then post-processed using the pipeline custom designed for the instrument and written in Python. First, we subtracted the dark and divided by the flatfield images. For our analysis, we fine-centered each frame using the four symmetrical spots created by the SHARK-NIR internal deformable mirror. Additionally, we conducted a selection process to identify and exclude any low-quality frames such as those in which the star was not adequately masked by the coronagraph. Finally, we applied a post-processing procedure based on the ADI method and exploiting the principal components analysis (PCA; Soummer et al. 2012; Amara & Quanz 2012) algorithm.
Similarly, each LMIRCam exposure is a ramp that in this case was composed of two frames taken at different intermediate exposure times, the first one with a time equal to just 13.7 ms and the last one corresponding to the total exposure time. As a first step, we subtracted the first image of the ramp data cube from the last to remove the bias from the science data. The data were taken with two different nodding positions called A and B. We then subtracted from each image a median of the 100 closest images in time from the opposite nod position, in order to subtract thermal background flux from all frames obtained at MIR wavelengths without needing to obtain sky frames. Finally, we applied a PCA-based post-processing similar to what was done for the SHARK-NIR data.
The final images obtained for the two instruments from the procedure described above are displayed in Fig. 2. No source with S/N>5 is detected on either image, allowing us to conclude that no companion has been detected orbiting around HD 57625 during our observations. However, as discussed in Sect. 1, even a non-detection in imaging data can be successfully used to provide robust limits on the unseen companion that produces the PMa and RV signals.
In Fig. 3 we show the SHARK-NIR and LMIRCam observation contrast curve as a function of separation as well as the respective mass limits derived using the AMES-COND models (Allard et al. 2003) assuming the stellar age range of ![Mathematical equation: $\[4.8_{-2.9}^{+3.7}\]$](/articles/aa/full_html/2025/01/aa52832-24/aa52832-24-eq10.png) Ga derived in Sect. 2. From these mass limits, it is clear that while any planetary companion of HD 57625 would not have been detected, both SHARK-NIR and LMIRCam would have been able to detect any stellar companion at all separations above the aforementioned respective coronagraphic limits of 5.3 au and 10.88 au, as well as very wide and massive brown dwarfs. Therefore, the non-detection produced by our parallel SHARK-NIR and LMIRCam imaging observations in the H and L′ infrared bands allows us to confirm the substellar and likely planetary nature of the companion that produces the PMa and RV signal of HD 57625.
Ga derived in Sect. 2. From these mass limits, it is clear that while any planetary companion of HD 57625 would not have been detected, both SHARK-NIR and LMIRCam would have been able to detect any stellar companion at all separations above the aforementioned respective coronagraphic limits of 5.3 au and 10.88 au, as well as very wide and massive brown dwarfs. Therefore, the non-detection produced by our parallel SHARK-NIR and LMIRCam imaging observations in the H and L′ infrared bands allows us to confirm the substellar and likely planetary nature of the companion that produces the PMa and RV signal of HD 57625.
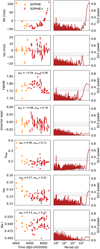 |
Fig. 1 SOPHIE data time series and periodograms. Left panels: time series for the SOPHIE (orange triangles) and SOPHIE+ (red circles) radial velocity data of HD 57625, the residual time series obtained after removing the detected Keplerian signal and the activity indexes. For the activity indexes time series, the Pearson correlation coefficient with both original and residual RVs are noted as ρRV and ρres. Right panels: corresponding generalised Lomb-Scargle periodograms of the time series. The horizontal solid, dashed and dotted lines indicate the 10, 1 and 0.1% FAP thresholds. |
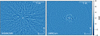 |
Fig. 2 Final S/N map of the inner region around HD 57625 obtained using the SHARK-NIR H-band (left panel) and the LMIRCam L′-band data (right panel). The white cross marks the position of the central star. The images were in both cases obtained using a PCA technique and subtracting ten principal components. |
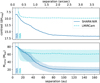 |
Fig. 3 Contrast curve and mass limits for the SHARK-NIR and LMIRCam observations of HD 57625 conducted on the night of February 24, 2024 UT. Top panel: contrast curve. Bottom panel: mass limits derived using the AMES-COND models. The thick curve corresponds to the nominal 4.8 Ga stellar age, and the shaded region corresponds to the age uncertainty. In both panels, the solid blue curves refer to the SHARK-NIR H-band observations and the dashed cyan lines refer to the LMIRCam L′-band observation, with similarly colour-coded vertical dotted lines indicating the inner working angle of each instrument. |
SOPHIE and SOPHIE+ measurements for HD 57625.
4 Radial velocity analysis
As mentioned in Sect. 1, the archival radial velocity time series available for HD 57625 are characterised by a clear long-term trend hinting at the presence of a wide-orbit massive companion. Specifically, we focus in this section on the publicly available RV measurements collected by the spectrograph SOPHIE (Perruchot et al. 2008), mounted on the 1.93 m telescope at the Haute-Provence Observatory in France. We additionally note that in June 2011 the fibre link of the instrument was upgraded (Bouchy et al. 2013), which introduces an offset between the data collected before and after this date. In the following we therefore treat the RV measurements taken for HD 57625 before and after the fibre upgrade as independent datasets called SOPHIE and SOPHIE+, respectively.
We retrieved a total of 70 publicly available radial velocity measurements (11 before the fibre upgrade and 59 after it) from the SOPHIE archive5 (Moultaka et al. 2004), spanning from November 12, 2006 to October 2, 2019 and therefore providing an observational baseline of 4708 d with a median RV uncertainty of 2.5 m s−1. In Fig. 1 we show the time series and GLS periodograms for the SOPHIE and SOPHIE+RVs, the oneKeplerian solution residuals and the activity indexes derived and discussed in Sect. 2; all time series are also listed in Table 2. The RV time series exhibits a peak-to-valley variation of 151 m s−1 and a clear Keplerian behaviour indicating the presence of a moderate-to-high eccentricity companion with a GLS-derived period longer than 4500 d. While it must be noted that the available public data fail to fully cover the entirety of the RV oscillation, the current coverage allows the detection and analysis of a significant portion of the oscillation. As mentioned in Sect. 2, we note that no activity index shows a significant correlation with the RV time series, with all indexes having Pearson correlation coefficient |ρ| < 0.27 with the exception of FWHM (ρ = −0.54) and SMW (ρ = 0.49), which are moderately correlated. However, the time series and periodogram of these indexes indicate different periodicities than the >4500 d observed in the RVs. The FWHM periodogram peaks at ~3900 d and the SMW variation has not gone through a full cycle over the observational time span of 4708 d, therefore strongly suggesting a periodicity for SMW much longer than that observed in the RVs.
Although we noted in Sect. 2 the presence of a ~0.2 M⊙ stellar companion at a separation of 10″, we exclude a binary origin for the observed RV variation. With a projected orbital separation of ~440 au, the orbital period of the secondary around the primary would be ~8.5 · 103 a, which is an exceedingly long period compared to the observed RV oscillation. Additionally, following Torres (1999), we estimate the acceleration d(RV)/dt caused by the secondary on the primary as:
![Mathematical equation: $\[\frac{\mathrm{d}(R V)}{\mathrm{d} t}=G \frac{M_{B}}{a^{2}(1-e)} \frac{(1+~\cos~ \nu) ~\sin~ (\nu+\omega) ~\sin~ i}{(1+~\cos~ E)(1-e ~\cos~ E)}\]$](/articles/aa/full_html/2025/01/aa52832-24/aa52832-24-eq11.png) (1)
(1)
where a = aA (MA + MB)/MB is the semi-major axis of the relative orbit, ν is the true anomaly, i is the mutual inclination, and E is the eccentric anomaly. As we lack any estimate of the orbital elements of the binary system except the aforementioned separation and mass estimates, we generated 105 possible combinations of the orbital elements e, v, ω, E and i. We obtain a maximum possible variation of only ~0.19 m s−1 over the 12.5 a SOPHIE baseline, an far lower value than the 151 m s−1 variation observed in the archival data.
We therefore searched for the best-fit orbital solution using the Python tool PyORBIT6 (Malavolta et al. 2016, 2018), a package for the Markov chain Monte Carlo (MCMC) modelling of RV and activity index time series based on the optimisation algorithm PyDE (Storn & Price 1997) and the MCMC sampler emcee (Foreman-Mackey et al. 2013). The nine free parameters for which we fit are the orbital period P, the semi-amplitude K, the mean longitude ![Mathematical equation: $\[\lambda_{0}, \sqrt{e_{\mathrm{b}}} ~\sin~ \omega_{\mathrm{b}}, \sqrt{e_{\mathrm{b}}} ~\cos~ \omega_{\mathrm{b}}\]$](/articles/aa/full_html/2025/01/aa52832-24/aa52832-24-eq12.png) , and finally a zero-point radial velocity term γ and an uncorrelated stellar jitter term j each for the SOPHIE and SOPHIE+ datasets.
, and finally a zero-point radial velocity term γ and an uncorrelated stellar jitter term j each for the SOPHIE and SOPHIE+ datasets.
We found a best-fit Keplerian solution (see Fig. 4 and Table 3) with an orbital period ![Mathematical equation: $\[4851_{-178}^{+413}\]$](/articles/aa/full_html/2025/01/aa52832-24/aa52832-24-eq13.png) d, a semi-amplitude
d, a semi-amplitude ![Mathematical equation: $\[78.94_{-5.85}^{+19.87}\]$](/articles/aa/full_html/2025/01/aa52832-24/aa52832-24-eq14.png) m s−1 and an eccentricity 0.52 ± 0.04. Using the host star mass value of
m s−1 and an eccentricity 0.52 ± 0.04. Using the host star mass value of ![Mathematical equation: $\[1.040_{-0.080}^{+0.078}\]$](/articles/aa/full_html/2025/01/aa52832-24/aa52832-24-eq15.png) M⊙ we obtained in Sect. 2, we derived a companion minimum mass of
M⊙ we obtained in Sect. 2, we derived a companion minimum mass of ![Mathematical equation: $\[5.79_{-0.63}^{+1.71}\]$](/articles/aa/full_html/2025/01/aa52832-24/aa52832-24-eq16.png) MJup and a semi-major axis of
MJup and a semi-major axis of ![Mathematical equation: $\[5.71_{-0.21}^{+0.33}\]$](/articles/aa/full_html/2025/01/aa52832-24/aa52832-24-eq17.png) au. We immediately note that P and especially K of the detected companion upper limits are somewhat unconstrained, with upper relative uncertainties of 8.5% and 25%, a clear result of the aforementioned incomplete orbital coverage of the available SOPHIE public data. Not only is the best-fit orbital period close to the observational baseline of 4708 d, but the available RV measurements are characterised by a lack of full sampling over the maximum portion of the companion-induced oscillation. This limits a full characterisation of some orbital elements of the planetary companion with the exclusive use of currently available RV observations. Finally, the residual time series has a weighted root mean square (w.r.m.s.) of 7 m s−1, has no significant correlation with any of the activity indexes we analysed (|ρ| < 0.2) and exhibits a nonsignificant principal peak at ~1300 d with a 6% FAP in its GLS periodogram (see the second row of Fig. 1).
au. We immediately note that P and especially K of the detected companion upper limits are somewhat unconstrained, with upper relative uncertainties of 8.5% and 25%, a clear result of the aforementioned incomplete orbital coverage of the available SOPHIE public data. Not only is the best-fit orbital period close to the observational baseline of 4708 d, but the available RV measurements are characterised by a lack of full sampling over the maximum portion of the companion-induced oscillation. This limits a full characterisation of some orbital elements of the planetary companion with the exclusive use of currently available RV observations. Finally, the residual time series has a weighted root mean square (w.r.m.s.) of 7 m s−1, has no significant correlation with any of the activity indexes we analysed (|ρ| < 0.2) and exhibits a nonsignificant principal peak at ~1300 d with a 6% FAP in its GLS periodogram (see the second row of Fig. 1).
The HD 57625 system therefore calls for further follow-up RV observations to fully constrain the orbital parameters of planet b. However, as we show in the following sections, the simultaneous usage of astrometric and imaging measurements can provide additional constrains to the RV-only system characterization.
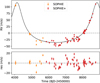 |
Fig. 4 Radial velocity orbital fit for planet HD 57625 b. Top panel: best-fit single-Keplerian solution shown as a black curve over the SOPHIE (orange triangles) and SOPHIE+ (red circles) archival data. Bottom panel: post-fit residual radial velocities. |
RV-only best-fit orbital solution for HD 57625 b.
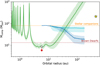 |
Fig. 5 Proper motion anomaly sensitivity curve for HD 57625. The dark green curve shows the PMa-compatible companion masses as a function of orbital separations, and the shaded region corresponds to the 1σ uncertainty range. The blue and cyan curves represent the SHARK-NIR and LMIRCam mass limits as in Fig. 3. The horizontal lines indicate the brown dwarf (brown) and stellar mass (orange) thresholds. The positions of HD 57625 b as obtained by the RV-only fit and by the joint RV and PMa fit are shown as a red and white circle, respectively, and the distant stellar companion is shown as a yellow star. |
5 Astrometry analysis
As previously discussed, one of the main indications that a massive companion orbits HD 57625 is the highly significant variation in proper motion measurements between the HIPPARCOS and Gaia DR3 epochs, which Kervella et al. (2022) reported as having an S/N of 11.04. Assuming a 1.16 ± 0.06 M⊙ mass for the host star, the catalogue estimates a companion dynamical mass of 11.18 MJup at a separation of 3 au, of 8.91 MJup at 5 au, of 9.33 MJup at 10 au, and of 37.45 MJup at 30 au, indicating that the observed PMa is compatible either with a planetary-mass companion at short-to-wide separations or with a brown dwarf or stellar companion at larger separations.
In Fig. 5, following the method detailed in Kervella et al. (2022), the companion masses compatible with the observed astrometric acceleration are plotted as a function of possible orbital separations. We note that the distant stellar companion mentioned in Sect. 2, shown in Fig. 5 as a yellow star, is not compatible with the observed PMa because a companion with its assumed mass of ~0.2 M⊙ would cause the reported acceleration only at an orbital separation of ~70 au, which is much closer than the projected separation of 440 au of the known stellar companion.
On the other hand, the RV-detected companion with a minimum mass ![Mathematical equation: $\[5.79_{-0.63}^{+1.71}\]$](/articles/aa/full_html/2025/01/aa52832-24/aa52832-24-eq32.png) MJup and semi-major axis
MJup and semi-major axis ![Mathematical equation: $\[5.71_{-0.21}^{+0.33}\]$](/articles/aa/full_html/2025/01/aa52832-24/aa52832-24-eq33.png) au discussed in Sect. 4 (shown in Fig. 5 as a red circle) is compatible within 2σ with the observed PMa. The same figure additionally shows that only planetary-mass companions satisfactorily explain the observed PMa within the orbital separation compatible with the RV signal detected in the SOPHIE public data. This strongly suggests that a planetary true mass companion is the origin of both the RV and PMa signals.
au discussed in Sect. 4 (shown in Fig. 5 as a red circle) is compatible within 2σ with the observed PMa. The same figure additionally shows that only planetary-mass companions satisfactorily explain the observed PMa within the orbital separation compatible with the RV signal detected in the SOPHIE public data. This strongly suggests that a planetary true mass companion is the origin of both the RV and PMa signals.
To provide a more complete characterisation of the orbital elements of HD 57625 b, and more specifically a precise value of dynamical mass, we used the Python code orvara (Brandt et al. 2021), an MCMC code designed to fit Keplerian orbits to any combination of proper motion variations, absolute and relative astrometry, and radial velocities to obtain precise dynamical masses and orbital elements. More specifically, orvara is designed to use the PMa computed and reported in the HIPPARCOS-Gaia Catalogue of Accelerations (HGCA, Brandt 2018, 2021), in which the HIPPARCOS and Gaia EDR3 catalogues were cross-calibrated to account for systematics and shift all proper motions in the Gaia EDR3.
The best-fit orbital parameters obtained by the joint RV-PMa fit are listed in Table 4, and the best-fit proper motion anomaly curves are shown in Fig. 6 and relative astrometric orbit with the predicted positions at selected epochs for the planetary companion are shown in Fig. 7. This solution characterises HD 57625 b as having an orbital period of ![Mathematical equation: $\[4843_{-167}^{+306}\]$](/articles/aa/full_html/2025/01/aa52832-24/aa52832-24-eq48.png) d, an eccentricity of
d, an eccentricity of ![Mathematical equation: $\[0.52_{-0.03}^{+0.04}\]$](/articles/aa/full_html/2025/01/aa52832-24/aa52832-24-eq49.png) , an inclination of
, an inclination of ![Mathematical equation: $\[43.82_{-7.22}^{+14.30}\]$](/articles/aa/full_html/2025/01/aa52832-24/aa52832-24-eq50.png) deg, and a dynamical mass of
deg, and a dynamical mass of ![Mathematical equation: $\[8.43_{-0.91}^{+1.1}\]$](/articles/aa/full_html/2025/01/aa52832-24/aa52832-24-eq51.png) MJup.
MJup.
We show the companion position in the mass-separation parameter space as a white circle compared with the PMa sensitivity curve in Fig. 5, highlighting the solution’s agreement with the observed PMa. We note that the orbital period derived from the joint RV-PMa solution is compatible with and more precise than the RV-only solution obtained in Sect. 4, and the same applies to the companion dynamical mass which additionally lies firmly below the traditionally assumed 13 MJup deuterium-burning threshold, confirming the planetary nature of HD 57625 b.
Joint RV and PMa best-fit orbital solution for HD 57625 b.
6 Detection completeness
In addition to allowing the detection of the planetary companion HD 57625 b, the imaging, RV and PMa data analysed in the previous sections can further be used to assess the detection completeness of the datasets. By doing so, we can identify the full-completeness regions in the mass-separation parameter space in which the available data can exclude the presence of additional companions, or conversely, the low-completeness regions in which additional companions could, in principle, be detected by follow-up observations.
In order to do this, we followed an injection and retrieval scheme in which synthetic companions were injected into the available datasets and subjected to statistical tests to assess their detectability. We used a Python code we developed to assess the detection completeness of the RV time series analysed in previous works (Barbato et al. 2018, 2019, 2023; Matthews et al. 2023; Gratton et al. 2024; Mesa et al. 2025), now expanded to also be used on imaging and astrometric data in order to produce multi-technique detection completeness maps.
We explored a grid of 40×40 companion masses and orbital separations, ranging from 0.1 to 100 MJup (considering the true mass M for imaging and PMa data, and minimum masses M sin i for RV data) and from 0.5 to 300 au. This wide parameter space spans a large variety of companion categories, from close-in giant planets to wide-orbit low-mass stellar companions. This allowed us to investigate different possible companions and to show the discovery space and synergic interplay of each dataset. For each mass-separation realisation, we generated 103 sets of randomly drawn values of e, ω, Ω, λ0, i, and stellar age used to compute as many synthetic H- and L′-band contrast, RV time series, and PMa signals corresponding to the injected companion. We note that the age values were drawn from a uniform distribution between the lower and upper values of stellar age derived for HD 57625 in Sect. 2 in order to account for this parameter uncertainty and the dependence of the H-band injected companion emission we computed using the AMES-COND models, and therefore of the detecting capability of imaging observations, as a function of the system age.
We then performed a statistical test to assess the detectability of each of the 1.6 · 106 synthetic companions with each of the considered techniques, considering the injected signal detected with imaging when the computed contrast was higher than the measured non-detection contrast curve at the corresponding separation (see Fig. 3), with radial velocity when the injected companion produces a periodogram peak with FAP ≤ 10−3, and by astrometry when the injected proper motion anomaly has an S/N ≥ 3. Finally, for each mass-separation realisation we computed the detection completeness as the ratio of the detectable injected signals and total injections. The detection completeness maps obtained in this way for all techniques we considered are shown in Fig. 8, the position of the detected exoplanet marked by a white circle.
Starting with the imaging data (top row), the detection completeness of our SHARK-NIR H-band observation (left panel) is clearly limited for lower orbital separations by its IWA of 120 mas, corresponding to 5.30 au given the nominal stellar distance of 44.24 pc. Above this lower limit on separation, we achieved full completeness only for stellar companions (>80 MJup) at all separations we explored, and for massive brown dwarfs (>30 MJup) beyond 80 au. Our LMIRCam L′-band observation (right panel) is found to be more limited for close-in companions because of its higher IWA of 246 mas, which corresponds to 10.88 au for our star, and provides full completeness only for outer stellar (>80 MJup) companions. While the planetary companion detected with radial velocities and proper motion anomaly remains firmly beyond the detection capabilities of our SHARK-NIR and LMIRCam data, by virtue of its relatively low mass and orbital separation that is comparable to and lower than SHARK-NIR and LMIRCam IWA respectively, our observations allow us to robustly exclude the presence of massive brown dwarfs or stellar companions at all separations of interest, once again stressing the planetary nature of the detected RV and PMa signal. Additionally, we note significant discovery space for wide-orbit giant planetary companions for follow-up deep-imaging observations.
When we instead consider the radial velocity data (middle left panel), the public SOPHIE data provide full detection completeness above minimum masses of 0.2 MJup within 1 au, above 1.5 MJup within 10 au, and finally above 20 MJup below 30 au. This allows us to exclude the presence of additional companions in the system in these regions in the parameter space. On the other hand, the available RV data are still blind to less massive giant exoplanets on wide orbits, such as companions with M sin i < 0.2 MJup beyond 1.5 au, <1 MJup beyond 10 au and <10 MJup beyond 40 au. Therefore, follow-up RV observations still have some significant discovery space available for the detection of long-period giant planets, as well as lower-mass companions on a large variety of orbits.
Finally, the astrometry detection map (middle right panel) shows that the HIPPARCOS-Gaia proper motion anomalies precision provides full completeness for massive companions, such as those with true mass higher than 4 MJup between 2.5 and 15 au, as well as higher than 30 MJup below 50 au. This allows us to further exclude the presence of additional massive companions in the system within these orbital ranges. On the other hand, a significant portion of the giant planet mass regime remains below the current detection capabilities of the PMa measurements for HD 57625. No sub-Jovian companion is detectable at any of the orbital separations explored, allowing for significant exoplanetary discovery space with full astrometric orbit measurements in future Gaia releases.
To conclude, we additionally show in the bottom panel of Fig. 8 a multi-technique global detection completeness map that we obtained by considering each injected companion detected by at least one of the datasets studied so far. This map clearly shows that the multi-technique observations of HD 57625 allow us to compensate for the weaknesses fo each technique and provide a rather complete view of the system, with RV data probing the inner low-mass region of the parameter space to which the other techniques are blind, PMa providing completeness for giant companions at intermediate-to-large separation, and imaging probing the more massive and outer regions of the system, once again highlighting the importance of multi-technique observations and analysis for the characterization of planetary systems.
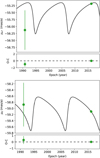 |
Fig. 6 Observed and fitted proper motions in right ascension (top panel) and declination (bottom panel). The best-fit orbit obtained by the joint RV and PMa fit is shown as a black curve, and the proper motion measurements from HIPPARCOS and Gaia EDR3 shown as green circles. |
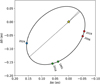 |
Fig. 7 Relative astrometric orbit and selected predicted position for HD 57625 b. The position of the host star is marked by a yellow star, with a dashed line representing the line of nodes and a dotted line connecting the host star to the periastron. The coloured circles mark the predicted positions of the planetary companion at the epoch of our imaging observation (2024; blue), at the starting and final epochs of available RVs (2006 and 2019; red) and at the reference epochs for HIPPARCOS and Gaia DR3 (1991 and 2024; green). |
7 Discussion and conclusions
We reported the detection and characterisation of HD 57625 b, the giant planetary companion responsible for the astrometric acceleration of its host star, via a synergic analysis of imaging, radial velocity and astrometric datasets. To investigate the observed significant proper motion anomaly between HIPPARCOS and Gaia DR3, we performed high-contrast H-band observations with SHARK-NIR, the near-infrared camera recently installed at the Large Binocular Telescope, in parallel with LMIRCam in L′, resulting in a non-detection that allowed us to confirm a substellar nature for the unseen companion that causes the observed acceleration.
By jointly analysing public archival SOPHIE radial velocity time series and the HIPPARCOS-Gaia DR3 proper motion anomaly measurements, we further confirmed the planetary nature of the companion, characterised its orbit and determined its true mass even facing incomplete orbital coverage by the available radial velocity measurements. We found HD 57625 b to be a giant exoplanet with a true mass of ![Mathematical equation: $\[8.43_{-0.91}^{+1.1}\]$](/articles/aa/full_html/2025/01/aa52832-24/aa52832-24-eq52.png) MJup on a
MJup on a ![Mathematical equation: $\[5.70_{-0.13}^{+0.14}\]$](/articles/aa/full_html/2025/01/aa52832-24/aa52832-24-eq53.png) au orbit with a relatively high eccentricity of
au orbit with a relatively high eccentricity of ![Mathematical equation: $\[0.52_{-0.03}^{+0.04}\]$](/articles/aa/full_html/2025/01/aa52832-24/aa52832-24-eq54.png) . To further analyse the planetary system and fuel future observations, we additionally performed a multi-technique detection completeness assessment, through which we found significant yet-unexplored discovery space for additional outer giant and inner low-mass companions. This also highlights the importance of synergic multi-technique analysis in fully characterising exoplanetary systems.
. To further analyse the planetary system and fuel future observations, we additionally performed a multi-technique detection completeness assessment, through which we found significant yet-unexplored discovery space for additional outer giant and inner low-mass companions. This also highlights the importance of synergic multi-technique analysis in fully characterising exoplanetary systems.
A noteworthy characteristic of HD 57625 b is its moderate-to-high value of orbital eccentricity, which for giant planets is usually interpreted as the result of either Kozai-Lidov effects (Kozai 1962; Innanen et al. 1997; Wu & Murray 2003), in which the planetary eccentricity growth is driven by secular interactions with a distant stellar or brown dwarf companion, or planet-planet scattering (Weidenschilling & Marzari 1996; Chambers et al. 1996; Raymond et al. 2009), in which the gravitational instability in multi-planet systems leads to repeated orbital encounters that often result in multiple surviving planetary companions with high eccentricities.
While our multi-technique detection completeness assessment proves that yet-undiscovered outer giant planetary companions could still be present in the HD 57625 system, the lack of inner massive companions and especially the presence of the wide-orbit stellar companion 2MASS J07251770+5634002 (Gaia DR3 989016790859521280) suggest a Kozai-driven origin for the observed eccentricity of HD 57625 b. Following Ford et al. (2000) and Takeda & Rasio (2005) we can estimate the timescale for Kozai-driven eccentricity modulation as:
![Mathematical equation: $\[P_{\text {Kozai }} \simeq P_{\mathrm{b}} \frac{M_{\mathrm{A}}+M_{\mathrm{b}}}{M_{\mathrm{B}}}\left(\frac{a_{\mathrm{B}}}{a_{\mathrm{b}}}\right)^{3}\left(1-e_{\mathrm{B}}{}^{2}\right)^{3 / 2}\]$](/articles/aa/full_html/2025/01/aa52832-24/aa52832-24-eq55.png) (2)
(2)
The indexes b, A, and B refer to the planetary companion, the primary and secondary component of the binary system, respectively. As we have estimates of MB ~ 0.2 M⊙ and aB ~ 440 au for the distant stellar companion but no assessment of its orbital eccentricity, we consider extreme values of 0 and 0.9 for eB. Accounting for the uncertainties in the host star and planetary companion parameters, we obtain values of PKozai ranging from 26 to 39 Ma assuming eB = 0 and from 2 to 3 Ma for eB = 0.9. As these timescales are considerably shorter than the host star age of ![Mathematical equation: $\[4.8_{-2.9}^{+3.7}\]$](/articles/aa/full_html/2025/01/aa52832-24/aa52832-24-eq56.png) Ga, it is clear that the planetary system has undergone a large number of oscillation cycles. We therefore identify Kozai interaction as a likely cause for the planetary companion eccentricity. However, in the absence of information on the orbital orientation of the stellar companion, we are currently unable to determine whether the planet-secondary relative orbital inclination is higher than the threshold value of 39.2° needed to incite Kozai oscillations. While in principle the combination of proper motion vector and radial velocity measurements for the wide-orbit stellar companion can be used to provide a characterisation of its orbital inclination, no value of radial velocity is available in Gaia DR3 or in previous literature. Furthermore, the stellar companion is not a part of the HIPPARCOS catalogue, which prevents any orbital characterization based on PMa. The relative orbital inclination of HD 57625 b and 2MASS J07251770+5634002 therefore cannot be determined at the moment, although future Gaia DRs might provide additional measurements and help shed light on the dynamical history of the system.
Ga, it is clear that the planetary system has undergone a large number of oscillation cycles. We therefore identify Kozai interaction as a likely cause for the planetary companion eccentricity. However, in the absence of information on the orbital orientation of the stellar companion, we are currently unable to determine whether the planet-secondary relative orbital inclination is higher than the threshold value of 39.2° needed to incite Kozai oscillations. While in principle the combination of proper motion vector and radial velocity measurements for the wide-orbit stellar companion can be used to provide a characterisation of its orbital inclination, no value of radial velocity is available in Gaia DR3 or in previous literature. Furthermore, the stellar companion is not a part of the HIPPARCOS catalogue, which prevents any orbital characterization based on PMa. The relative orbital inclination of HD 57625 b and 2MASS J07251770+5634002 therefore cannot be determined at the moment, although future Gaia DRs might provide additional measurements and help shed light on the dynamical history of the system.
Finally, we highlight that HD 57625 b joins the population of long-period giant planet companions whose true mass value was determined via the synergic use of multiple detection methods. At the time of writing, only a few tens of such exoplanets are known. The dynamical mass of most of them was characterised only recently based on Gaia astrometric measurements and on the growing multi-technique analysis approach in exoplanetology. Many studies that assessed exoplanetary occurrence rates therefore often characterise detected massive companions based on minimum mass estimates or the presence of long-term RV trends (see e.g. Bryan et al. 2019; Rosenthal et al. 2022) and are therefore highly dependant on the inherent planetary mass degeneracy in the absence of additional constraints. Therefore, this small but growing sample of outer giant exoplanets with true mass determination represents an important asset in exoplanetology. The growing multi-technique exoplanetology approach as well as the future Gaia data releases and astrometric solutions will continue to prove essential in exploring the observed variety of exoplanetary system architectures, as well as furthering our understanding of the formation and dynamical evolution processes that shaped such variety.
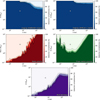 |
Fig. 8 Detection completeness maps for the imaging (blue, top row), radial velocity (red, middle left panel) and proper motion anomaly data (green, middle right panel) discussed in this work, as well as the multi-technique global map (purple, bottom panel). In all panels, the solid, dashed and dotted curves identify the 10, 50 and 100% detection completeness thresholds. The white circle marks the position of the detected planetary companion as obtained by the joint RV and PMa fit. |
Data availability
Full Table 2 is available at the CDS via anonymous ftp to cdsarc.cds.unistra.fr (130.79.128.5) or via https://cdsarc.cds.unistra.fr/viz-bin/cat/J/A+A/693/A81.
Acknowledgements
The authors wish to thank the anonymous referee for their useful comments. We thank Tom Herbst from MPIA-Heidelberg and the LINCNIRVANA team for sharing part of their instrument control SW to operate the motorized axis of SHARK-NIR. We also express our appreciation to NASA and Marcia Rieke, the Principal Investigator of JWST/NIRCam, for granting us the opportunity to utilize one of the NIRCam spare detectors as the primary detector for the SHARK-NIR scientific camera. Observations have benefited from the use of ALTA Center (alta.arcetri.inaf.it) forecasts performed with the Astro-Meso-Nh model. Initialization data of the ALTA automatic forecast system come from the General Circulation Model (HRES) of the European Centre for Medium Range Weather Forecasts. The LBT is an international collaboration among institutions in the United States, Italy and Germany. The LBT Corporation partners are: The University of Arizona on behalf of the Arizona university system; Istituto Nazionale di Astrofisica, Italy; LBT Beteiligungsgesellschaft, Germany, representing the Max Planck Society, the Astrophysical Institute Potsdam, and Heidelberg University; The Ohio State University; The Research Corporation, on behalf of The University of Notre Dame, University of Minnesota and University of Virginia. D.B. and A.R. wish to thank J. Gomes da Silva for his great availability and invaluable support in adapting and applying ACTIN2 to this work. A.R. acknowledges support by the Fondazione ICSC, Spoke 3 Astrophysics and Cosmos Observations. National Recovery and Resilience Plan (Piano Nazionale di Ripresa e Resilienza, PNRR) Project ID CN_00000013 “Italian Research Center on High-Performance Computing, Big Data and Quantum Computing” funded by MUR Missione 4 Componente 2 Investimento 1.4: Potenziamento strutture di ricerca e creazione di “campioni nazionali di R&S (M4C2-19)” - Next Generation EU (NGEU). This work has made use of data retrieved from the SOPHIE archive at Observatoire de Haute-Provence (OHP), available at atlas.obs-hp.fr/sophie. This work has made use of data from the European Space Agency (ESA) mission Gaia (https://www.cosmos.esa.int/gaia), processed by the Gaia Data Processing and Analysis Consortium (DPAC, https://www.cosmos.esa.int/web/gaia/dpac/consortium). Funding for the DPAC has been provided by national institutions, in particular, the institutions participating in the Gaia Multilateral Agreement. This research has made extensive use of the NASA-ADS, SIMBAD and Vizier databases, operated at CDS, Strasbourg, France.
References
- Allard, F., Guillot, T., Ludwig, H.-G., et al. 2003, IAU Symp., 211, 325 [Google Scholar]
- Amara, A., & Quanz, S. P. 2012, MNRAS, 427, 948 [Google Scholar]
- Barbato, D., Sozzetti, A., Desidera, S., et al. 2018, A&A, 615, A175 [NASA ADS] [CrossRef] [EDP Sciences] [Google Scholar]
- Barbato, D., Sozzetti, A., Biazzo, K., et al. 2019, A&A, 621, A110 [NASA ADS] [CrossRef] [EDP Sciences] [Google Scholar]
- Barbato, D., Ségransan, D., Udry, S., et al. 2023, A&A, 674, A114 [NASA ADS] [CrossRef] [EDP Sciences] [Google Scholar]
- Barbato, D., Farinato, J., Baruffolo, A., et al. 2024, SPIE, 13096, 130961W [NASA ADS] [Google Scholar]
- Bonavita, M., Fontanive, C., Gratton, R., et al. 2022, MNRAS, 513, 5588 [NASA ADS] [Google Scholar]
- Bouchy, F., Díaz, R. F., Hébrard, G., et al. 2013, A&A, 549, A49 [NASA ADS] [CrossRef] [EDP Sciences] [Google Scholar]
- Brandt, T. D. 2018, ApJS, 239, 31 [Google Scholar]
- Brandt, T. D. 2021, ApJS, 254, 42 [NASA ADS] [CrossRef] [Google Scholar]
- Brandt, T. D., Dupuy, T. J., Li, Y., et al. 2021, AJ, 162, 186 [NASA ADS] [CrossRef] [Google Scholar]
- Bryan, M. L., Knutson, H. A., Lee, E. J., et al. 2019, AJ, 157, 52 [Google Scholar]
- Calissendorff, P., & Janson, M. 2018, A&A, 615, A149 [NASA ADS] [CrossRef] [EDP Sciences] [Google Scholar]
- Cannon, A. J., & Pickering, E. C. 1993, VizieR On-line Data Catalog: III/135A [Google Scholar]
- Carolo, E., Vassallo, D., Farinato, J., et al. 2018, SPIE Conf. Ser., 10701, 107012B [NASA ADS] [Google Scholar]
- Chambers, J. E., Wetherill, G. W., & Boss, A. P. 1996, Icarus, 119, 261 [Google Scholar]
- Choi, J., Dotter, A., Conroy, C., et al. 2016, ApJ, 823, 102 [Google Scholar]
- Currie, T., Brandt, T. D., Kuzuhara, M., et al. 2020, ApJ, 904, L25 [Google Scholar]
- Cutri, R. M., Skrutskie, M. F., van Dyk, S., et al. 2003, VizieR On-line Data Catalog: II/246 [Google Scholar]
- Cutri, R. M., Wright, E. L., Conrow, T., et al. 2021, VizieR Online Data Catalog: II/328 [Google Scholar]
- De Rosa, R. J., Nielsen, E. L., Wahhaj, Z., et al. 2023, A&A, 672, A94 [NASA ADS] [CrossRef] [EDP Sciences] [Google Scholar]
- Doelman, D. S., Snik, F., Por, E. H., et al. 2021, Appl. Opt., 60, D52 [NASA ADS] [CrossRef] [Google Scholar]
- Dotter, A. 2016, ApJS, 222, 8 [Google Scholar]
- Eastman, J. D., Rodriguez, J. E., Agol, E., et al. 2019, arXiv e-prints [arXiv:1907.09480] [Google Scholar]
- Farinato, J., Baruffolo, A., Bergomi, M., et al. 2022, SPIE Conf. Ser., 12185, 1218522 [NASA ADS] [Google Scholar]
- Farinato, J., Di Filippo, S., Baruffolo, A., et al. 2023, in Adaptive Optics for Extremely Large Telescopes (AO4ELT7), 68 [Google Scholar]
- Ford, E. B., Kozinsky, B., & Rasio, F. A. 2000, ApJ, 535, 385 [NASA ADS] [CrossRef] [Google Scholar]
- Foreman-Mackey, D., Hogg, D. W., Lang, D., & Goodman, J. 2013, PASP, 125, 306 [Google Scholar]
- Franson, K., Bowler, B. P., Zhou, Y., et al. 2023, ApJ, 950, L19 [NASA ADS] [CrossRef] [Google Scholar]
- Gaia Collaboration (Prusti, T., et al.) 2016, A&A, 595, A1 [NASA ADS] [CrossRef] [EDP Sciences] [Google Scholar]
- Gaia Collaboration (Brown, A. G. A., et al.) 2018, A&A, 616, A1 [NASA ADS] [CrossRef] [EDP Sciences] [Google Scholar]
- Gaia Collaboration (Smart, R. L., et al.) 2021, A&A, 649, A6 [EDP Sciences] [Google Scholar]
- Gaia Collaboration (Vallenari, A., et al.) 2023, A&A, 674, A1 [NASA ADS] [CrossRef] [EDP Sciences] [Google Scholar]
- Galicher, R., Marois, C., Macintosh, B., et al. 2016, A&A, 594, A63 [NASA ADS] [CrossRef] [EDP Sciences] [Google Scholar]
- Głębocki, R., & Gnaciński, P. 2005, ESA SP, 560, 571 [Google Scholar]
- Gomes da Silva, J., Figueira, P., Santos, N., & Faria, J. 2018, J. Open Source Softw., 3, 667 [Google Scholar]
- Gomes da Silva, J., Santos, N. C., Adibekyan, V., et al. 2021, A&A, 646, A77 [NASA ADS] [CrossRef] [EDP Sciences] [Google Scholar]
- Gratton, R., Bonavita, M., Mesa, D., et al. 2024, A&A, 685, A119 [NASA ADS] [CrossRef] [EDP Sciences] [Google Scholar]
- Haffert, S. Y., Bohn, A. J., de Boer, J., et al. 2019, Nat. Astron., 3, 749 [Google Scholar]
- Hinkley, S., Lacour, S., Marleau, G. D., et al. 2023, A&A, 671, L5 [NASA ADS] [CrossRef] [EDP Sciences] [Google Scholar]
- Høg, E., Fabricius, C., Makarov, V. V., et al. 2000, A&A, 355, L27 [Google Scholar]
- Innanen, K. A., Zheng, J. Q., Mikkola, S., & Valtonen, M. J. 1997, AJ, 113, 1915 [NASA ADS] [CrossRef] [Google Scholar]
- Keppler, M., Benisty, M., Müller, A., et al. 2018, A&A, 617, A44 [NASA ADS] [CrossRef] [EDP Sciences] [Google Scholar]
- Kervella, P., Arenou, F., & Thévenin, F. 2022, A&A, 657, A7 [NASA ADS] [CrossRef] [EDP Sciences] [Google Scholar]
- Kozai, Y. 1962, AJ, 67, 591 [Google Scholar]
- Kuzuhara, M., Tamura, M., Kudo, T., et al. 2013, ApJ, 774, 11 [Google Scholar]
- Leisenring, J. M., Skrutskie, M. F., Hinz, P. M., et al. 2012, SPIE, 8466, 84464F [NASA ADS] [Google Scholar]
- Li, Y., & Ezzeddine, R. 2023, AJ, 165, 145 [NASA ADS] [CrossRef] [Google Scholar]
- Macintosh, B., Graham, J. R., Barman, T., et al. 2015, Science, 350, 64 [Google Scholar]
- Malavolta, L., Nascimbeni, V., Piotto, G., et al. 2016, A&A, 588, A118 [NASA ADS] [CrossRef] [EDP Sciences] [Google Scholar]
- Malavolta, L., Mayo, A. W., Louden, T., et al. 2018, AJ, 155, 107 [NASA ADS] [CrossRef] [Google Scholar]
- Mamajek, E. E., & Hillenbrand, L. A. 2008, ApJ, 687, 1264 [Google Scholar]
- Marafatto, L., Carolo, E., Umbriaco, G., et al. 2022, SPIE Conf. Ser., 12184, 121843V [NASA ADS] [Google Scholar]
- Marois, C., Lafrenière, D., Doyon, R., Macintosh, B., & Nadeau, D. 2006, ApJ, 641, 556 [Google Scholar]
- Marois, C., Macintosh, B., Barman, T., et al. 2008, Science, 322, 1348 [Google Scholar]
- Marois, C., Zuckerman, B., Konopacky, Q. M., Macintosh, B., & Barman, T. 2010, Nature, 468, 1080 [NASA ADS] [CrossRef] [Google Scholar]
- Matthews, E. C., Bonnefoy, M., Xie, C., et al. 2023, A&A, 679, A58 [NASA ADS] [CrossRef] [EDP Sciences] [Google Scholar]
- Matthews, E. C., Carter, A. L., Pathak, P., et al. 2024, Nature, 633, 789 [NASA ADS] [CrossRef] [Google Scholar]
- Mesa, D., Bonavita, M., Benatti, S., et al. 2022, A&A, 665, A73 [NASA ADS] [CrossRef] [EDP Sciences] [Google Scholar]
- Mesa, D., Gratton, R., Kervella, P., et al. 2023, A&A, 672, A93 [NASA ADS] [CrossRef] [EDP Sciences] [Google Scholar]
- Mesa, D., Gratton, R., D’Orazi, V., et al. 2025, MNRAS, 536, 1455 [Google Scholar]
- Meyer, M. R., Amara, A., Reggiani, M., & Quanz, S. P. 2018, A&A, 612, L3 [NASA ADS] [CrossRef] [EDP Sciences] [Google Scholar]
- Moultaka, J., Ilovaisky, S. A., Prugniel, P., & Soubiran, C. 2004, PASP, 116, 693 [NASA ADS] [CrossRef] [Google Scholar]
- Müller, A., Keppler, M., Henning, T., et al. 2018, A&A, 617, L2 [Google Scholar]
- Nielsen, E. L., De Rosa, R. J., Macintosh, B., et al. 2019, AJ, 158, 13 [Google Scholar]
- Nowak, M., Lacour, S., Lagrange, A. M., et al. 2020, A&A, 642, L2 [NASA ADS] [CrossRef] [EDP Sciences] [Google Scholar]
- Noyes, R. W., Hartmann, L. W., Baliunas, S. L., Duncan, D. K., & Vaughan, A. H. 1984, ApJ, 279, 763 [Google Scholar]
- Pecaut, M. J., & Mamajek, E. E. 2013, ApJS, 208, 9 [Google Scholar]
- Pedichini, F., Piazzesi, R., Viavattene, G., et al. 2022, SPIE, 12185, 121856Q [NASA ADS] [Google Scholar]
- Perruchot, S., Kohler, D., Bouchy, F., et al. 2008, SPIE Conf. Ser., 7014, 70140J [Google Scholar]
- Pinna, E., Esposito, S., Hinz, P., et al. 2016, SPIE, 9909, 99093V [Google Scholar]
- Pinna, E., Rossi, F., Agapito, G., et al. 2023, in Adaptive Optics for Extremely Large Telescopes (AO4ELT7), 80 [Google Scholar]
- Raymond, S. N., Barnes, R., Veras, D., et al. 2009, ApJ, 696, L98 [NASA ADS] [CrossRef] [Google Scholar]
- Rosenthal, L. J., Knutson, H. A., Chachan, Y., et al. 2022, ApJS, 262, 1 [Google Scholar]
- Skrutskie, M. F., Jones, T., Hinz, P., et al. 2010, SPIE, 7735, 77353H [NASA ADS] [Google Scholar]
- Soubiran, C., Jasniewicz, G., Chemin, L., et al. 2018, A&A, 616, A7 [NASA ADS] [CrossRef] [EDP Sciences] [Google Scholar]
- Soummer, R., Pueyo, L., & Larkin, J. 2012, ApJ, 755, L28 [Google Scholar]
- Storn, R., & Price, K. 1997, J. Global Optimiz., 11, 341 [Google Scholar]
- Takeda, G., & Rasio, F. A. 2005, ApJ, 627, 1001 [Google Scholar]
- Torres, G. 1999, PASP, 111, 169 [NASA ADS] [CrossRef] [Google Scholar]
- van Leeuwen, F. 2007, A&A, 474, 653 [CrossRef] [EDP Sciences] [Google Scholar]
- Vigan, A., Fontanive, C., Meyer, M., et al. 2021, A&A, 651, A72 [EDP Sciences] [Google Scholar]
- Voges, W., Aschenbach, B., Boller, T., et al. 1999, A&A, 349, 389 [NASA ADS] [Google Scholar]
- Voges, W., Aschenbach, B., Boller, T., et al. 2000, IAU Circ., 7432, 3 [NASA ADS] [Google Scholar]
- Weidenschilling, S. J., & Marzari, F. 1996, Nature, 384, 619 [Google Scholar]
- Wu, Y., & Murray, N. 2003, ApJ, 589, 605 [Google Scholar]
- Zacharias, N., Finch, C. T., Girard, T. M., et al. 2012, VizieR Online Data Catalog: I/322A [Google Scholar]
We additionally note that HD 57625 is included in the current version of the Washington Double Star (WDS) catalogue as a triple system, but the two listed components, namely HD 57667 (WDS J07254+5633A) and 2MASS J07251750+5633363 (WDS J07254+5633C), are clearly ruled out as physical companions by the largely discrepant astrometric parameters in Gaia DR3.
Updated version (2022.04.16) at https://www.pas.rochester.edu/~emamajek/EEM_dwarf_UBVIJHK_colors_Teff.txt
All Tables
All Figures
|
Fig. 1 SOPHIE data time series and periodograms. Left panels: time series for the SOPHIE (orange triangles) and SOPHIE+ (red circles) radial velocity data of HD 57625, the residual time series obtained after removing the detected Keplerian signal and the activity indexes. For the activity indexes time series, the Pearson correlation coefficient with both original and residual RVs are noted as ρRV and ρres. Right panels: corresponding generalised Lomb-Scargle periodograms of the time series. The horizontal solid, dashed and dotted lines indicate the 10, 1 and 0.1% FAP thresholds. |
| In the text | |
|
Fig. 2 Final S/N map of the inner region around HD 57625 obtained using the SHARK-NIR H-band (left panel) and the LMIRCam L′-band data (right panel). The white cross marks the position of the central star. The images were in both cases obtained using a PCA technique and subtracting ten principal components. |
| In the text | |
|
Fig. 3 Contrast curve and mass limits for the SHARK-NIR and LMIRCam observations of HD 57625 conducted on the night of February 24, 2024 UT. Top panel: contrast curve. Bottom panel: mass limits derived using the AMES-COND models. The thick curve corresponds to the nominal 4.8 Ga stellar age, and the shaded region corresponds to the age uncertainty. In both panels, the solid blue curves refer to the SHARK-NIR H-band observations and the dashed cyan lines refer to the LMIRCam L′-band observation, with similarly colour-coded vertical dotted lines indicating the inner working angle of each instrument. |
| In the text | |
|
Fig. 4 Radial velocity orbital fit for planet HD 57625 b. Top panel: best-fit single-Keplerian solution shown as a black curve over the SOPHIE (orange triangles) and SOPHIE+ (red circles) archival data. Bottom panel: post-fit residual radial velocities. |
| In the text | |
|
Fig. 5 Proper motion anomaly sensitivity curve for HD 57625. The dark green curve shows the PMa-compatible companion masses as a function of orbital separations, and the shaded region corresponds to the 1σ uncertainty range. The blue and cyan curves represent the SHARK-NIR and LMIRCam mass limits as in Fig. 3. The horizontal lines indicate the brown dwarf (brown) and stellar mass (orange) thresholds. The positions of HD 57625 b as obtained by the RV-only fit and by the joint RV and PMa fit are shown as a red and white circle, respectively, and the distant stellar companion is shown as a yellow star. |
| In the text | |
|
Fig. 6 Observed and fitted proper motions in right ascension (top panel) and declination (bottom panel). The best-fit orbit obtained by the joint RV and PMa fit is shown as a black curve, and the proper motion measurements from HIPPARCOS and Gaia EDR3 shown as green circles. |
| In the text | |
|
Fig. 7 Relative astrometric orbit and selected predicted position for HD 57625 b. The position of the host star is marked by a yellow star, with a dashed line representing the line of nodes and a dotted line connecting the host star to the periastron. The coloured circles mark the predicted positions of the planetary companion at the epoch of our imaging observation (2024; blue), at the starting and final epochs of available RVs (2006 and 2019; red) and at the reference epochs for HIPPARCOS and Gaia DR3 (1991 and 2024; green). |
| In the text | |
|
Fig. 8 Detection completeness maps for the imaging (blue, top row), radial velocity (red, middle left panel) and proper motion anomaly data (green, middle right panel) discussed in this work, as well as the multi-technique global map (purple, bottom panel). In all panels, the solid, dashed and dotted curves identify the 10, 50 and 100% detection completeness thresholds. The white circle marks the position of the detected planetary companion as obtained by the joint RV and PMa fit. |
| In the text | |
Current usage metrics show cumulative count of Article Views (full-text article views including HTML views, PDF and ePub downloads, according to the available data) and Abstracts Views on Vision4Press platform.
Data correspond to usage on the plateform after 2015. The current usage metrics is available 48-96 hours after online publication and is updated daily on week days.
Initial download of the metrics may take a while.