Fig. 1
Download original image
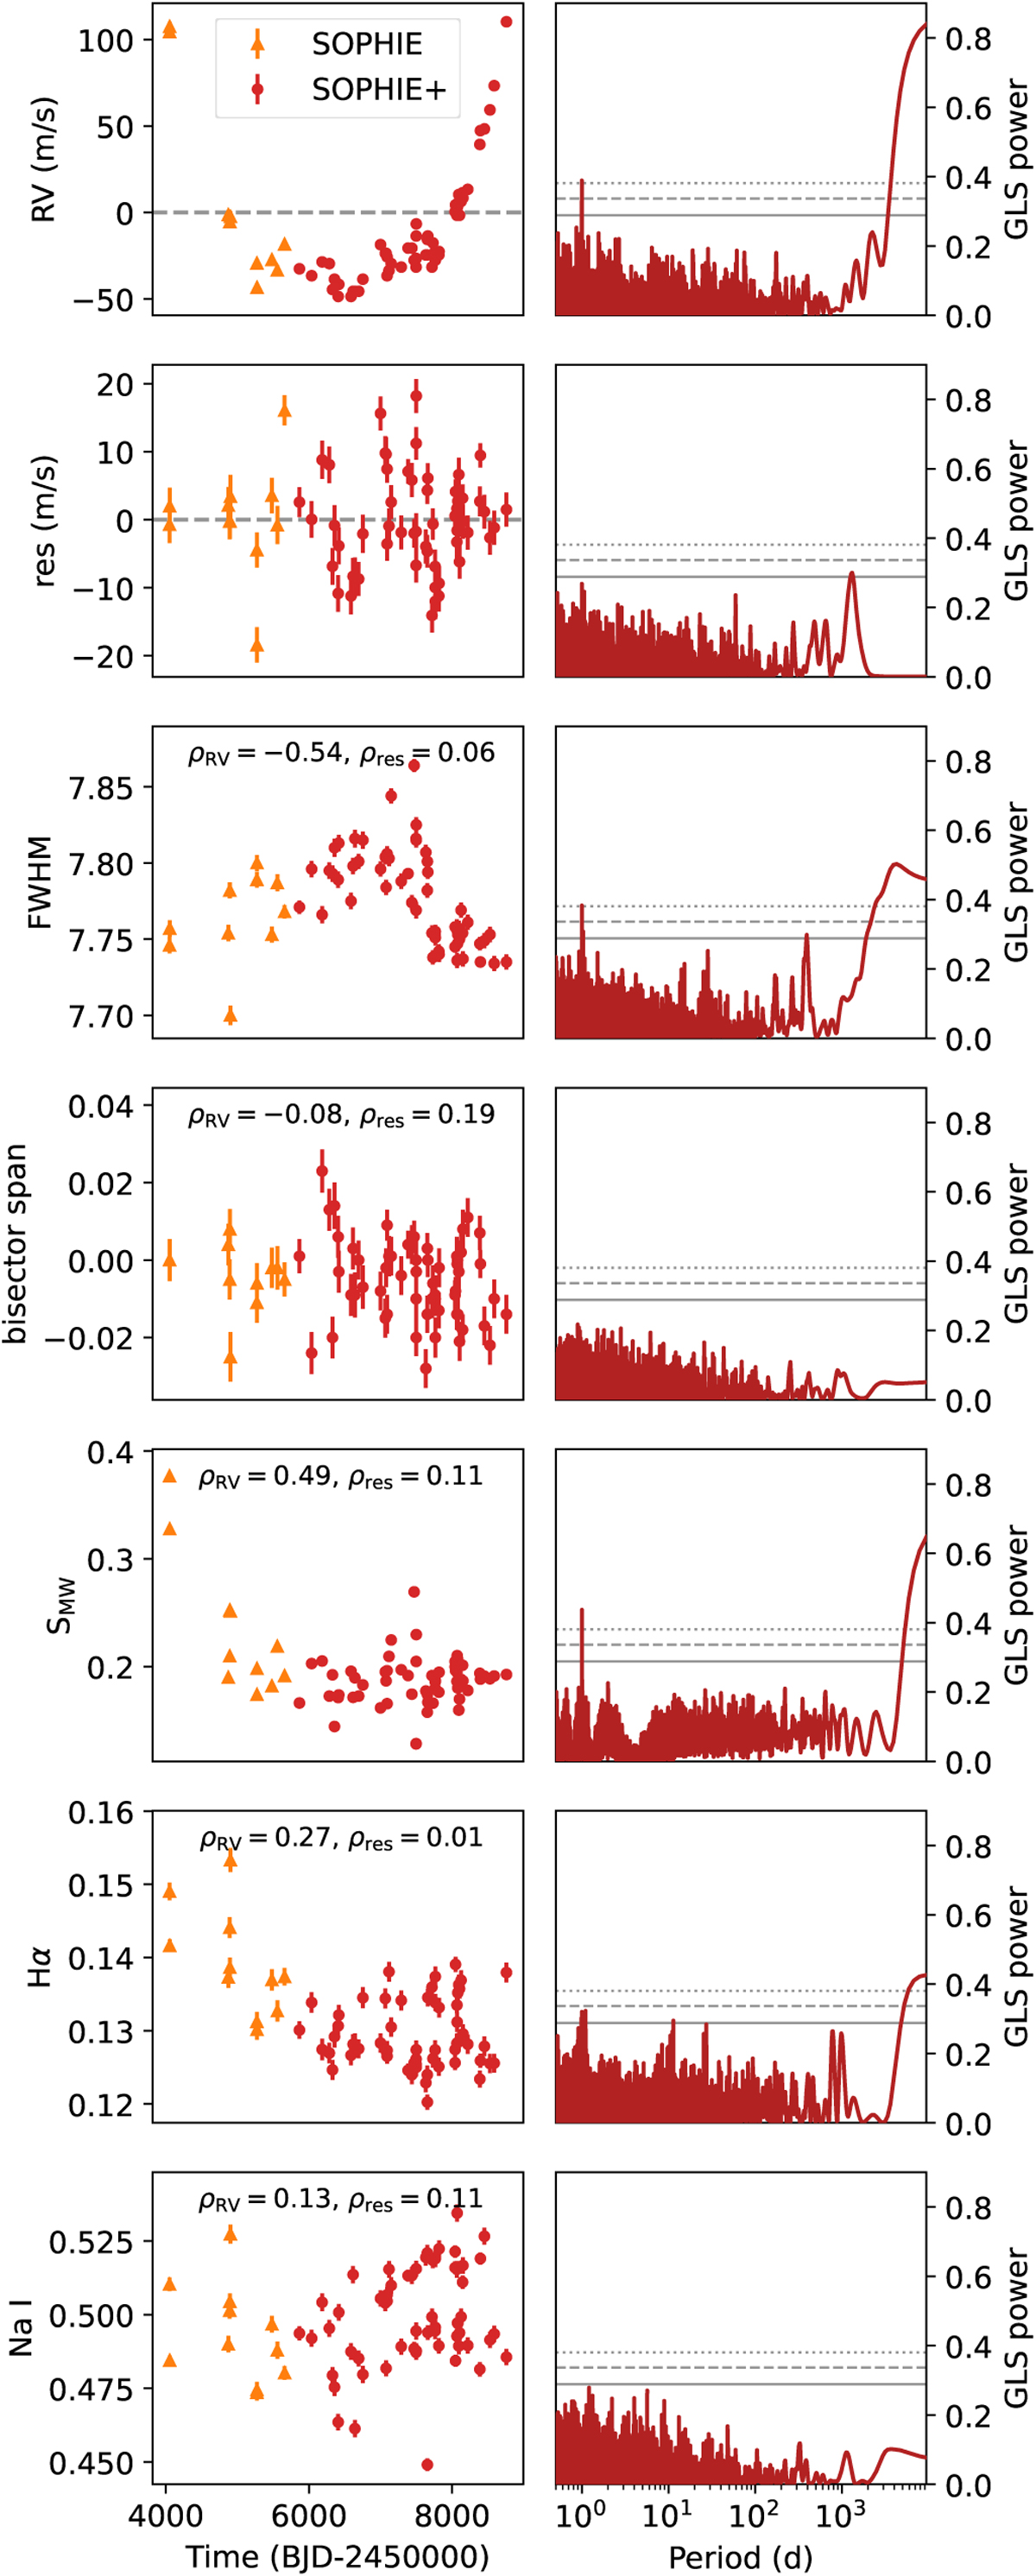
SOPHIE data time series and periodograms. Left panels: time series for the SOPHIE (orange triangles) and SOPHIE+ (red circles) radial velocity data of HD 57625, the residual time series obtained after removing the detected Keplerian signal and the activity indexes. For the activity indexes time series, the Pearson correlation coefficient with both original and residual RVs are noted as ρRV and ρres. Right panels: corresponding generalised Lomb-Scargle periodograms of the time series. The horizontal solid, dashed and dotted lines indicate the 10, 1 and 0.1% FAP thresholds.
Current usage metrics show cumulative count of Article Views (full-text article views including HTML views, PDF and ePub downloads, according to the available data) and Abstracts Views on Vision4Press platform.
Data correspond to usage on the plateform after 2015. The current usage metrics is available 48-96 hours after online publication and is updated daily on week days.
Initial download of the metrics may take a while.