Fig. 3
Download original image
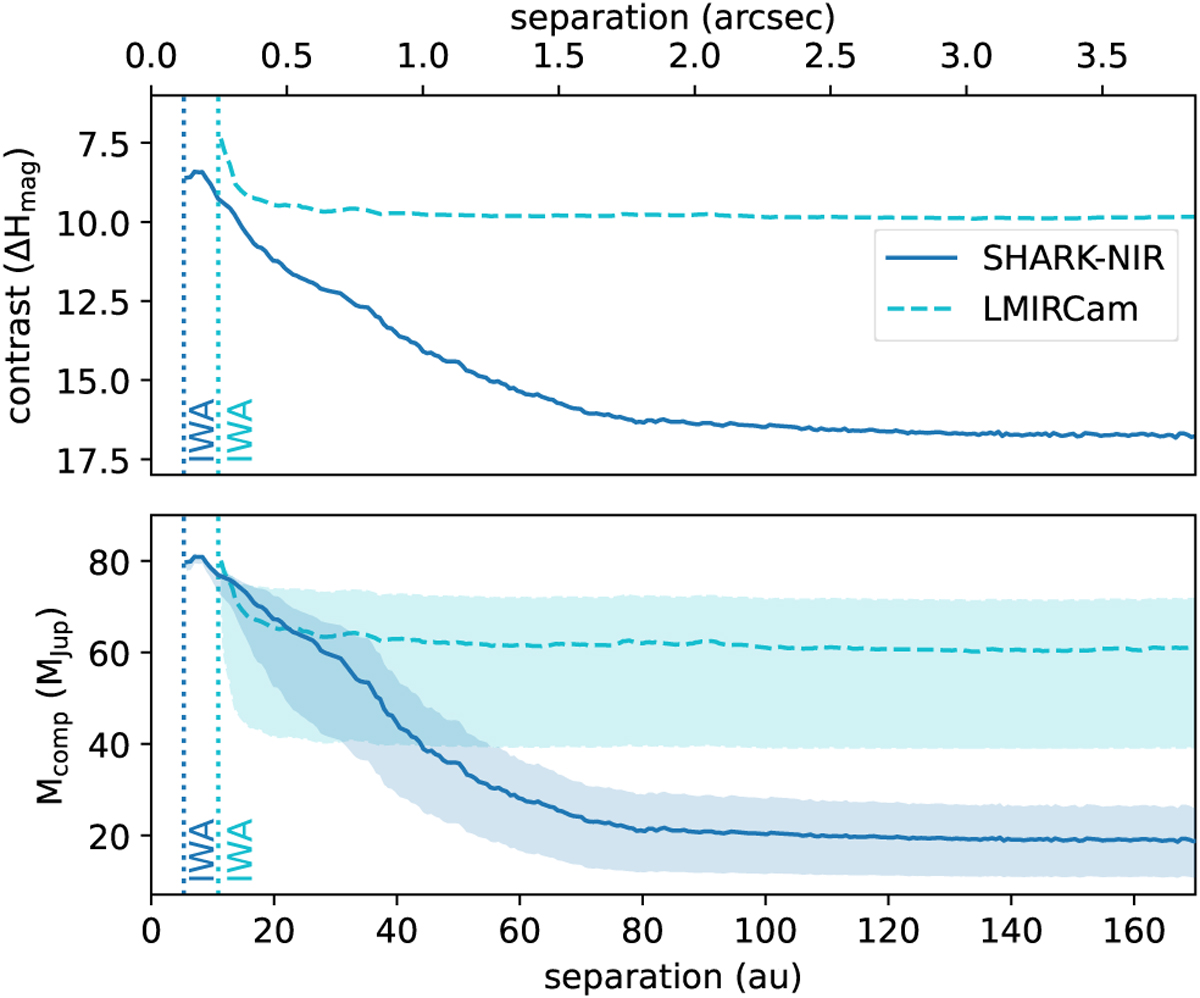
Contrast curve and mass limits for the SHARK-NIR and LMIRCam observations of HD 57625 conducted on the night of February 24, 2024 UT. Top panel: contrast curve. Bottom panel: mass limits derived using the AMES-COND models. The thick curve corresponds to the nominal 4.8 Ga stellar age, and the shaded region corresponds to the age uncertainty. In both panels, the solid blue curves refer to the SHARK-NIR H-band observations and the dashed cyan lines refer to the LMIRCam L′-band observation, with similarly colour-coded vertical dotted lines indicating the inner working angle of each instrument.
Current usage metrics show cumulative count of Article Views (full-text article views including HTML views, PDF and ePub downloads, according to the available data) and Abstracts Views on Vision4Press platform.
Data correspond to usage on the plateform after 2015. The current usage metrics is available 48-96 hours after online publication and is updated daily on week days.
Initial download of the metrics may take a while.