Fig. 5
Download original image
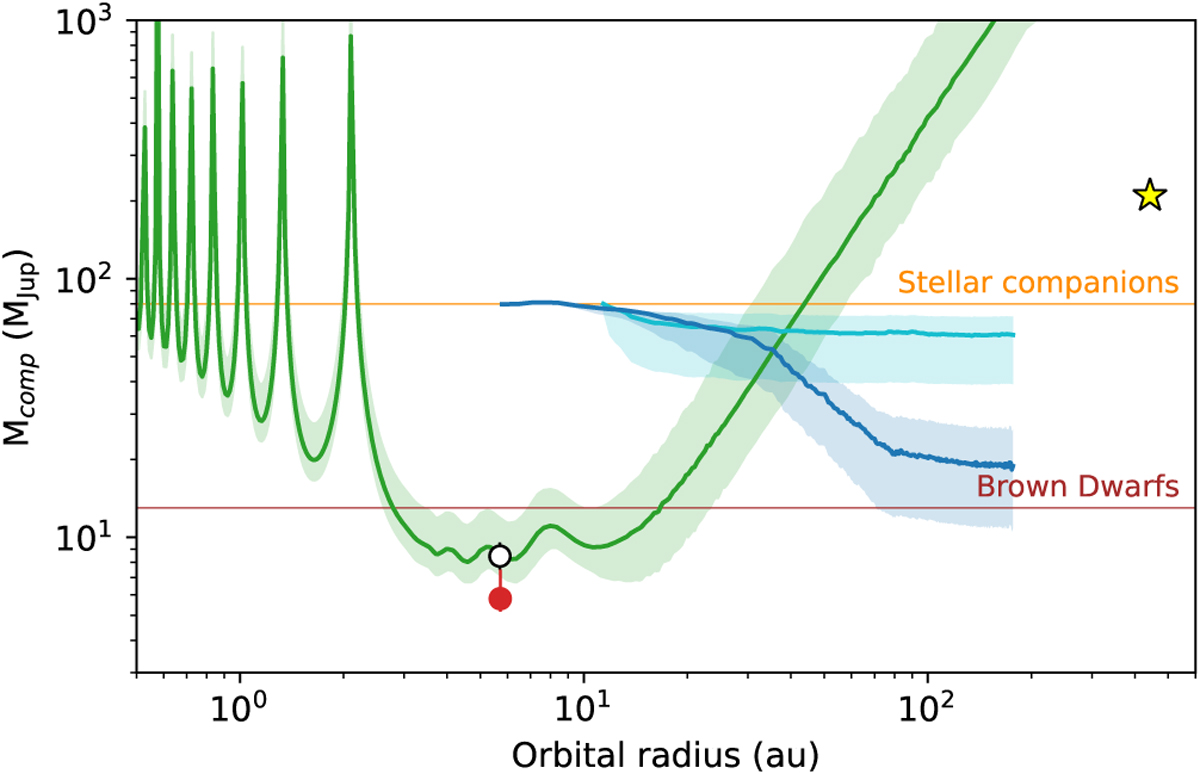
Proper motion anomaly sensitivity curve for HD 57625. The dark green curve shows the PMa-compatible companion masses as a function of orbital separations, and the shaded region corresponds to the 1σ uncertainty range. The blue and cyan curves represent the SHARK-NIR and LMIRCam mass limits as in Fig. 3. The horizontal lines indicate the brown dwarf (brown) and stellar mass (orange) thresholds. The positions of HD 57625 b as obtained by the RV-only fit and by the joint RV and PMa fit are shown as a red and white circle, respectively, and the distant stellar companion is shown as a yellow star.
Current usage metrics show cumulative count of Article Views (full-text article views including HTML views, PDF and ePub downloads, according to the available data) and Abstracts Views on Vision4Press platform.
Data correspond to usage on the plateform after 2015. The current usage metrics is available 48-96 hours after online publication and is updated daily on week days.
Initial download of the metrics may take a while.