Fig. 8
Download original image
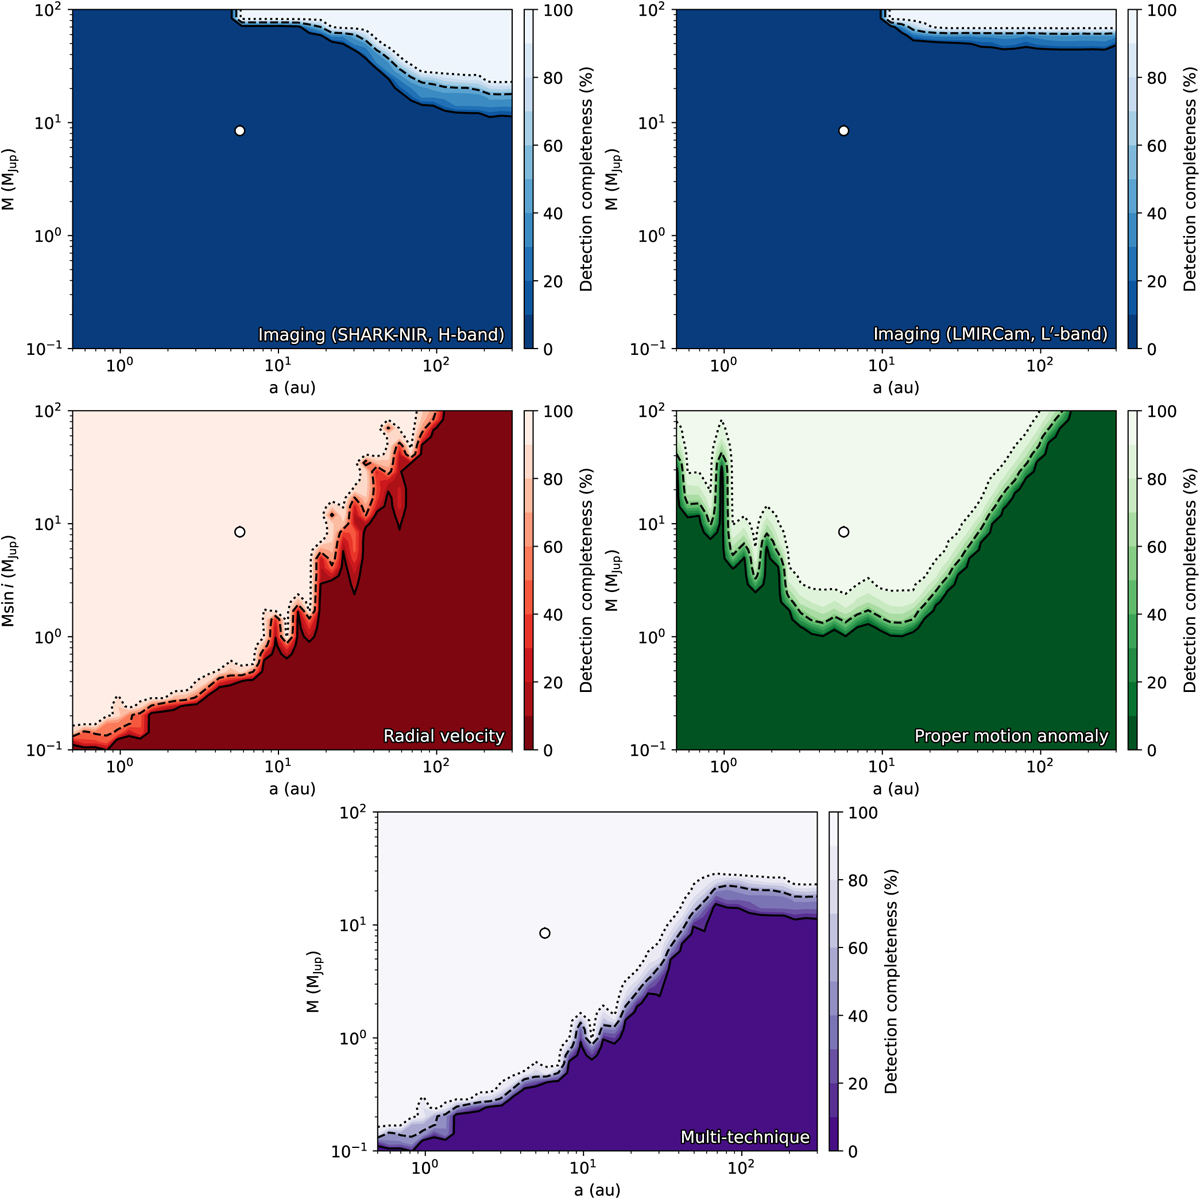
Detection completeness maps for the imaging (blue, top row), radial velocity (red, middle left panel) and proper motion anomaly data (green, middle right panel) discussed in this work, as well as the multi-technique global map (purple, bottom panel). In all panels, the solid, dashed and dotted curves identify the 10, 50 and 100% detection completeness thresholds. The white circle marks the position of the detected planetary companion as obtained by the joint RV and PMa fit.
Current usage metrics show cumulative count of Article Views (full-text article views including HTML views, PDF and ePub downloads, according to the available data) and Abstracts Views on Vision4Press platform.
Data correspond to usage on the plateform after 2015. The current usage metrics is available 48-96 hours after online publication and is updated daily on week days.
Initial download of the metrics may take a while.