| Issue |
A&A
Volume 678, October 2023
|
|
|---|---|---|
| Article Number | A120 | |
| Number of page(s) | 13 | |
| Section | Interstellar and circumstellar matter | |
| DOI | https://doi.org/10.1051/0004-6361/202347106 | |
| Published online | 13 October 2023 | |
Combined model for 15N, 13C, and spin-state chemistry in molecular clouds
1
Max-Planck-Institut für Extraterrestrische Physik (MPE),
Giessenbachstr. 1,
85748
Garching, Germany
e-mail: This email address is being protected from spambots. You need JavaScript enabled to view it.
2
Centro de Astrobiología (CAB), CSIC-INTA,
Ctra. de Ajalvir Km. 4,
28850
Torrejón de Ardoz, Madrid, Spain
3
Sorbonne Université, Observatoire de Paris, PSL University, CNRS, LERMA,
5 place Janssen,
92190
Meudon Cedex, France
4
INAF – Osservatorio Astrofisico di Arcetri,
Largo E. Fermi 5,
50125
Florence, Italy
5
Department of Space, Earth and Environment, Chalmers University of Technology, Onsala Space Observatory,
43992
Onsala, Sweden
Received:
6
June
2023
Accepted:
5
September
2023
Abstract
We present a new gas-grain chemical model for the combined isotopic fractionation of carbon and nitrogen in molecular clouds. To this end, we have developed gas-phase and grain-surface chemical networks where the isotope chemistry of carbon and nitrogen is coupled with a time-dependent description of spin-state chemistry, which is important for nitrogen chemistry at low temperatures. We updated the rate coefficients of some isotopic exchange reactions considered previously in the literature, and here we present a set of new exchange reactions involving molecules substituted in 13C and 15N simultaneously. We applied the model to a series of zero-dimensional simulations representing a set of physical conditions across a prototypical prestellar core, exploring the deviations of the isotopic abundance ratios in the various molecules from the elemental isotopic ratios as a function of physical conditions and time. We find that the 12C/13C ratio can deviate from the elemental ratio to a high factor depending on the molecule, and that there are highly time-dependent variations in the ratios. The HCN/H13CN ratio, for example, can obtain values of less than ten depending on the simulation time. The 14N/15N ratios tend to remain close to the assumed elemental ratio within approximately 10%, with no clearly discernible trends for the various species as a function of the physical conditions. Abundance ratios between 13C-containing molecules and 13C+15N-containing molecules however show somewhat increased levels of fractionation as a result of the newly included exchange reactions, though they still remain within a few tens of percent of the elemental 14N/15N ratio. Our results imply the existence of gradients in isotopic abundance ratios across prestellar cores, suggesting that detailed simulations are required to interpret observations of isotopically substituted molecules correctly, especially given that the various isotopic forms of a given molecule do not necessarily trace the same gas layers.
Key words: astrochemistry / ISM: abundances / ISM: clouds / ISM: molecules
© The Authors 2023
 Open Access article, published by EDP Sciences, under the terms of the Creative Commons Attribution License (https://creativecommons.org/licenses/by/4.0), which permits unrestricted use, distribution, and reproduction in any medium, provided the original work is properly cited.
This article is published in open access under the Subscribe to Open model.
Open Access funding provided by Max Planck Society.
1 Introduction
Isotopically substituted molecules are important probes of the physical and chemical conditions in the interstellar medium (ISM), especially in the shielded interior regions of molecular clouds where optical thickness effects become important and many common tracer species cannot be used. Furthermore, there is an increasing amount of observational evidence indicating that material in the Solar System has inherited a significant amount of chemical diversity from the natal cloud (e.g., Altwegg et al. 2019; Hily-Blant et al. 2019; Drozdovskaya et al. 2021; Grewal et al. 2021). Studies of isotopically substituted species can thus be used to investigate the connections between star-forming regions, exoplanets, and the Solar System (Caselli & Ceccarelli 2012; Ceccarelli et al. 2014; Nomura et al. 2022).
Owing to various observational challenges, for example with the optical depth or the inability to access all isotopic forms of a given species simultaneously, observers often derive the 14N/15N ratio of a given species by using the so-called double isotope method, where an observed 13C/15N ratio is scaled by the elemental 12C/13C ratio (e.g., Wampfler et al. 2014; Colzi et al. 2018). This implies the assumption that the isotopic abundance ratio in the studied molecule follows the elemental abundance ratio. Roueff et al. (2015) have shown via chemical simulations that this assumption is generally not true, and indeed deviations of a factor of several from the elemental 12C/13C ratio are possible, depending on the simulation time. Colzi et al. (2020; hereafter C20) have recently come to the same conclusions, using a model with an updated list of exchange reactions. These results imply direct consequences for observationally deduced 14N/15N abundance ratios. We also note that Loison et al. (2020) have recently published simulation results on carbon fractionation that are qualitatively similar to those of Roueff et al. (2015) and C20.
Some 14N/15N abundance ratios can however be observed directly, and chemical models have struggled to reproduce observed 15N fractionation even after the inclusion of a variety of isotopic exchange reactions (e.g., Roueff et al. 2015; Wirström & Charnley 2018; Loison et al. 2019). A particular example is the N2H+/15NNH+ ratio, which presents a high degree of anti-fractionation (ratios higher than the elemental value, with an excess of the 14N containing species with respect to the 15N ones) in observations of prestellar cores (Bizzocchi et al. 2013; Redaelli et al. 2018), while models usually predict fractionation. It has been suggested that the discrepancy might arise as a result of unphysically large variations in the isotope-dependent dissociative recombination rate of N2H+ (Loison et al. 2019; Hily-Blant et al. 2020), or owing to isotope-selective photodissociation (Heays et al. 2014; Visser et al. 2018; Furuya & Aikawa 2018; Colzi et al. 2019). The latter option is less controversial, but even the models of Furuya & Aikawa (2018 with the selective photodissociation included cannot reproduce the 15N anti-fractionation in N2H+. The (anti-)fractionation trends seem to depend on species though, and indeed the 14N/15N ratio in ammonia has been recently observed to lie close to the elemental ratio (Redaelli et al. 2023), which is in agreement with the earlier simulation predictions.
One effect that has, to our knowledge, not been explored earlier in isotopic fractionation models is exchange reactions that lead to multiple fractionation, that is, allowing atom exchanges between species that may contain simultaneous isotopic substitution in multiple elements. In this paper, we present the first model that includes this effect; our model connects carbon and nitrogen isotopic fractionation and also includes a description of spin-state chemistry for light hydrogen-containing species. We employed the new model to study (combined) carbon and nitrogen fractionation in physical conditions representing a region in and around a prestellar core, searching especially for signs of gradients in the spatial distributions of isotopic abundance ratios that have been recently inferred observationally toward the prestellar core L1544 (Spezzano et al. 2022). We also included isotope-selective photodissociation of N2 and studied its effect on the abundances of nitrogen-bearing species, and we paid special attention to deviations of the simulated isotopic abundance ratios from the corresponding elemental ratios.
The present work is theoretical in nature, and we focus on the presentation of the newly developed chemical model. An in-depth comparison of the results of the model to various observations, also including objects and environments other than prestellar cores, will be carried out in a future follow-up work.
The paper is structured as follows. In Sect. 2, we introduce the model and present lists of the exchange reactions included in this work. We present the chemical simulation results in Sect. 3, and discuss their implications in Sect. 4. We give our concluding remarks in Sect. 5.
2 Description of the model
2.1 Chemical network
We have developed a new model to describe the isotopic fractionation of 15N and 13C in molecular clouds. The model includes exchange reactions involving both of these elements separately, as well as reactions leading to multiple fractionation, that is, forming species with simultaneous 15N and 13C substitution.
The chemical network is constructed following the same principle as presented in C20, and we refer the reader to Sect. 2 of that paper for more details including the relevant references. There are three major differences in the construction of the chemical network in the present work compared to C20. First, as stated above, we allow for multiple fractionation, whereas in C20 only the fractionation of carbon was considered. Second, we introduce spin-state chemistry for H2,  , and
, and  following the approach described in Sipilä et al. (2015). This inclusion is important in the present context because of the sensitivity of nitrogen chemistry to the H2 ortho-to-para ratio (e.g., Dislaire et al. 2012; Wirström et al. 2012; Roueff et al. 2015) – omitting it in C20 was however justified because carbon (isotope) chemistry does not depend on spin chemistry. Third, we track the positions of the isotopic forms across the molecules, so the model distinguishes between H13CCCN, HC13CCN, and HCC13CN, for example.
We employ an updated version of the chemical network creation procedure discussed in C20, in which the KIDA gas-phase network (Wakelam et al. 2015) is used as the base network on top of which isotope chemistry is added. For grain-surface chemistry we use our own custom network that is originally based on that of Semenov et al. (2010). The isotopes are introduced one by one, with the network creation proceeding in three steps. In the first step, we introduce 13C along with the appropriate exchange reactions (see below). In the second step, 15N is added on top of the network created in the first step. At the end of this step, exchange reactions are introduced for 15N and for 15N+13C. In the third step, spin-state chemistry is introduced for those reactions where H2,  , or
, or  appear. We intentionally limit the carbon isotope chemistry to molecules that contain up to three C atoms, and the nitrogen isotope chemistry to molecules that contain at most two N atoms. In this way we are able to keep the number of reactions in the resulting chemical network within manageable limits. For the same reason we do not consider deuterium chemistry, or spin chemistry for molecules containing elements heavier than hydrogen, though this is possible from a technical standpoint. With these restrictions, the total number of reactions in the model is approximately 35 000, 1700 of which are grain-surface reactions.
The isotopic exchange reactions included in the model are collected in Tables 1 and 2. These include a set of new exchange reactions that we propose for cases where 13C and 15N appear simultaneously. Their significance for the chemistry is assessed in Sect. 4.1. We note that the list given in Tables 1 and 2 covers exchange reactions that would be identity reactions when the isotopes are not distinguished (with the exception of N+ + H2 → NH+ + H). Such reactions are not automatically produced as a result of the procedure with which we generate the fractionation network (see also C20), and so it is essential to add the reactions in Tables 1 and 2 on top of the automatically generated network to make sure that important reaction pathways are not missed. We note that the automated procedure does not take energy differences into account either.
2.2 Simulation parameters
The focus of the present paper is in the presentation of the newly developed isotope chemistry model. Therefore, unlike in C20, we do not attempt to reproduce observations of isotopic abundance ratios in the ISM, specifically in molecular clouds. Such an effort is reserved for an upcoming work (Colzi et al., in prep.), where we will also explore the effect of various parameters, like the cosmic ray ionization rate, on the isotopic ratios. Here, we run a set of zero-dimensional chemical simulations representing the typical physical conditions across a prestellar core and the surrounding envelope. Table 3 collects the parameters of the simulations, including details on the chemical network used in each simulation, and on the adopted physical parameters. In particular, in one simulation we test the effect of isotope-selective photodissociation for N2, considering that this has been invoked as an explanation for observed N fractionation gradients across the prestellar core L1544 (Spezzano et al. 2022). The simulations S1, S2, and S3 represent, respectively, the center, inner region, and the outer envelope of a prototypical prestellar core. The values of the physical parameters not already given in Table 3 are kept the same as in C20, and are reproduced in Table 4 for the convenience of the reader. The initial elemental abundances are displayed in Table 5. We have chosen the elemental carbon and nitrogen isotopic ratios to correspond to the values adopted in previous chemical simulations (e.g., Roueff et al. 2015; Loison et al. 2019): 68 for carbon (Milam et al. 2005), and 440 for nitrogen (Marty et al. 2011). We choose a low fiducial value of 10−3 for the H2 ortho-to-para ratio (OPR), motivated by earlier simulation studies (e.g., Faure et al. 2019; Lupi et al. 2021). However, as the OPR is expected to influence nitrogen hydride chemistry, we have also tested its effect on the simulation results. These tests are described in Sect. 4.3.
List of carbon isotopic exchange reactions included in the model.
3 Results
In what follows, we discuss the results of the chemical simulations for carbon and nitrogen isotopologues separately (Sects. 3.1 and 3.2, respectively). In the former case, we emphasize the comparison of the present model to that of C20 given the significant differences in the construction of the model. We also present results for the combined fractionation of carbon and nitrogen (Sect. 3.3).
List of nitrogen, as well as carbon+nitrogen, isotopic exchange reactions included in the model.
Parameters of the chemical simulations.
Values of the physical parameters kept fixed in all simulations.
Initial elemental abundances (with respect to nH ≈ 2 n(H2)).
3.1 Carbon isotopologues; comparison to C20
As it was already pointed out in Sect. 2.1, the present isotopic chemical networks contain several differences to those used in C20, also for carbon chemistry. Therefore, it is important to check whether the current model yields results similar to those of C20, or whether the results deviate from one another due to the modifications made for this paper. As the models differ in several ways, we analyze the effect of the main features of the present model in a sequential fashion, using modified versions of the S2 simulation (see Table 3).
Figure 1 shows a comparison of the simulation results as predicted by the S2 simulation variants, for several species also plotted by C20. Let us first examine the isotopic abundance ratios in the C20 model1 (simulation S2_C20; green) and the present model with only carbon fractionation and using the same exchange reactions as in C20 (simulation S2_3C_alt; blue). We reiterate that the difference between these models is that the latter tracks the position of the 13C atoms in the various molecules, while the former does not. As expected, this modification does lead to differences in predicted abundance ratios, which can be pronounced in some cases (for example, C, CN). However, even the largest differences between the results of the two simulations are at a factor of a few level, and the present expanded model is not in conflict with the main conclusions of C20.
Introducing new exchange reactions for carbon fractionation into the network (simulation S2_3C; orange) has a large impact on the fractionation of atomic carbon especially at early times in the simulation, though also at late times the 12C/13C ratio is boosted by a factor of ~two compared to C20. This boost is due to the newly added exchange reactions involving C3. Simultaneously, the HCN/H13CN ratio obtains a low value (~10) from t = 104 to a few ×105yr (similarly for HNC, not shown in the figure), which is mainly because of efficient conversion of HCN to H13CN via exchange reaction (24, see Table 1). The fact that this ratio lies relatively far from 68 has observational implications, which we discuss briefly in Sect. 3.3. The results of simulation S2 are in agreement with the gas-grain model of Loison et al. (2020) to within a factor of ~two (the overall agreement is worse in the simulations S2_C20 and S2_3C_alt), demonstrating that using an extensive set of exchange reactions is required to improve the accuracy of the simulation of iso-topic fractionation (though naturally within the accuracy of the reaction rates themselves).
Our results confirm the statements of Loison et al. (2020) regarding the important role of C3 for carbon fractionation. Further theoretical and experimental work needs to be carried out to constrain the rate coefficients of exchange reactions involving C3. Loison et al. (2020) reiterated the particular importance of the C3 + O reaction (see also the references in Loison et al. 2020), and tested the effect of order-of-magnitude variations in the rate coefficient of this reaction on the 12C/13C ratios of various species. They pointed out that the rate coefficient is poorly constrained and that its value depends strongly on how it is computed. To our knowledge, no subsequent progress on constraining this reaction has been made, and therefore we have not explored this issue further in this work.
Finally, adding nitrogen fractionation and time-dependent spin-state chemistry to the reaction scheme, that is, using the full model developed for this work (simulation S2; red), has little influence on carbon fractionation. This means that the newly included exchange reactions combining carbon and nitrogen fractionation do not play a large role in the chemistry of 13C, and secondly this finding confirms the expectation that spin-state chemistry does not significantly influence carbon chemistry either.
3.2 Nitrogen isotopologues
Figure 2 shows selected isotopic abundance ratios as a function of time obtained from simulations S1 to S3. There is clear variation in the fractionation level between the various N-bearing species, also depending on the physical conditions.
In simulation S1, which mimics the physical conditions in the center of a prestellar core, the N2H+/N15NH+ ratio is almost constant as a function of time, remaining near the elemental 14N/15N ratio of 440. There is also little variation between the two singly substituted forms of N2H+, with the 15NNH+/N15NH+ ratio remaining near unity at all times. As expected, the N2H+ 14N/15N ratio is very close to that of N2, while the atomic 14N/15N ratio presents minor fluctuations around the elemental ratio. CN and its derivatives, HCN and HNC, present similar behavior at late simulation times, showing enrichment in 15N. There is an early-time difference between the HCN/HC15N and HNC/H15NC ratios, however, which is due to a combination of several reactions that leads to a difference in the early-time HCN/HNC and HC15N/HC15N ratios. The ammonia 14N/15N ratio also stays quite close to the elemental value, with slight anti-fractionation at late simulation times. Our results are broadly similar to those presented by Wirström & Charnley (2018) who adopted physical conditions close to simulation S1, despite the fact that there are many differences between the model setups, for example that we are presently considering grain-surface chemistry and desorption processes. We confirm the finding of Wirström & Charnley (2018) that the observed nitrogen fractionation ratios of N2H+ cannot be explained by means of updated rate coefficients for the exchange reactions included in current models.
There are some differences in the various ratios in simulation S2 compared to S1, which is to be expected given the difference in the physical conditions. However, the results from the two simulations are overall similar none of the molecules shows a significant deviation from the elemental 14N/15N ratio at late simulation times. The physical conditions in simulation S2 are very similar to those considered by Loison et al. (2019), and although we use different initial conditions for the chemistry and–importantly for nitrogen chemistry–consider the time-dependent variation in the H2 OPR, we recover very similar abundance ratios to those presented by Loison et al. (2019) (see Sect. 4.3 for more discussion on the effect of the H2 OPR on our results).
In simulation S3, which corresponds to a lower density and higher temperature, and much lower visual extinction compared to simulations S1 and S2, there are generally only weak deviations from the elemental 14N/15N ratio. This is to be expected because the higher gas temperature helps most exchange reactions to proceed efficiently in each direction, preventing a large degree of fractionation. Indeed, the overall trend is that the various 14N/15N ratios present a slight enhancement over the elemental ratio.
In summary, our model predicts generally small deviations, on the order of 10%, for the various 14N/15N ratios from the elemental ratio. Notably, for any of the physical conditions considered here, the model does not reproduce the extremely high anti-fractionation of N2H+ observed by Bizzocchi et al. (2013) in the prestellar core L1544 (14N/15N ~ 1000) and upward of ~700 in a sample of prestellar cores observed by Redaelli et al. (2018). Possible explanations for this discrepancy between the models and the observations are the trapping of 15N, and in particular of 15NN, onto grain surfaces already before the formation of the prestellar core (Furuya & Aikawa 2018), or the suggested large isotope-dependent difference in N2H+ dissociative recombination rate (Loison et al. 2019; Hily-Blant et al. 2020).
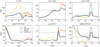 |
Fig. 1 Selected 12C/13C abundance ratios as a function of time in the variants of simulation S2 (S2, red; S2_C20, green; S2_3C, orange; S2_3C_alt, blue). The dashed black line in each panel indicates the elemental 12C/13C ratio (68), except for C3 for which a ratio of 34 is used as our model does not distinguish between CC13C and 13CCC. The results of simulations S2 and S2_3C overlap almost perfectly. |
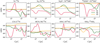 |
Fig. 2 Selected 14N/15N abundance ratios as a function of time in simulations S1 to S3, labeled in the top right panel. The dashed black line in each panel indicates the assumed elemental 14N/15N ratio (440). |
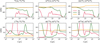 |
Fig. 3 Selected abundance ratios as a function of time in simulations S1 to S3, labeled in the top right panel. Top: ratios of 13C-substituted CN, HCN, and HNC to their 13C+15N-substituted forms. The dashed black line in each panel indicates the assumed elemental 14N/15N ratio (440). Bottom: ratios of 15N-substituted CN, HCN, and HNC to their 13C+15N-substituted forms. The dashed black line in each panel indicates the assumed elemental 12C/13C ratio (68). |
3.3 Species containing both 13C and 15N
Figure 3 presents the 13CN/13C15N and C15N/13C15N abundance ratios for CN, HCN, and HNC in the three fiducial simulations. For the C15N/13C15N ratios, there are no obvious trends and all simulations predict varying degrees of deviation from the statistical ratio of 68. The results are highly time-dependent and there are transient variations in many ratios. These transient variations are the largest in simulation S2 which is in line with the results of C20, who used the same physical conditions as in our simulation S2, and found similarly large transient effects. For the 13CN/13C15N ratios, however, the simulations predict increasing fractionation with volume density, with the ratios decreasing below 400 in simulation S1. This behavior is very different to the singly fractionated nitrogen ratios (Fig. 2), for which there are no clear trends as a function of the physical conditions. The 13C+15N fractionation ratios are sensitive to the newly introduced exchange reactions; we examine their effect in more detail in Sect. 4.1 below.
Although we will explore the observational implications of our new isotope chemical model in more detail in a future dedicated study, we briefly demonstrate in Fig. 4 the importance of tracking the isotopic ratios time-dependently, as opposed to converting observationally deduced abundances using a constant scaling factor. The figure shows the evolution of the HCN/HC15N ratio as predicted directly by the present model and as obtained by scaling the model prediction for H13CN by a constant factor of 68. Evidently, there can be a huge discrepancy in the HCN/HC15N ratio resulting from the two approaches, especially at higher volume densities–the scaled ratio is in model S2 up to an order of magnitude different to the elemental 14N/15N ratio depending on the evolutionary time. The peak is caused by the HCN/H13CN ratio being less than 10 in the time interval from ~104 yr to a few 105 yr (cf. Fig. 1), hence giving rise to a high HCN abundance when the H13CN abundance is scaled by a constant factor of 68. The implications of this finding are complicated by the fact that observations typically trace only a part of the total distribution of a molecule, and optical depth effects may also mask the part of the distribution that is prone to the large fluctuations. Nevertheless, it is clear that dedicated simulations are required to support the interpretation of observations, and that assuming constant elemental abundance ratios even within a molecular cloud may lead to large errors.
4 Discussion
4.1 Effect of new 13C + 15N exchange reactions
We have introduced in this work a set of exchange reactions involving molecules fractionated in both 13C and 15N (Table 2) that have not been considered in previous models of isotopic fractionation. Associated with common molecules and presenting barriers of several tens of Kelvin in many cases, they may also have an influence on the chemical evolution of singly fractionated molecules besides their influence on molecules fractionated in both C and N. We assess the importance of their inclusion in Fig. 5, which shows the same abundance ratios as in Fig. 3 but using either all of the exchange reactions given in Table 2, or excluding the new 13C+15N exchange reactions. The ratios, involving doubly fractionated molecules, show dependence on the included exchange reactions – without the reactions, there is less fractionation (which is to be expected) and the various 13CN/13C15N ratios tend to be closer to the assumed elemental ratio of 440. The differences are only prominent in the highest-density simulation (S1), however, and are even there only on the 10% level. The exchange reactions involving doubly fractionated species have only a very minor influence on single fractionation (the changes are slight for 15N-bearing species, and virtually non-existent for 13C-bearing species), and these are not shown here in the main text for the sake of brevity – additional simulation results are shown in Appendix A.
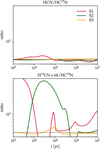 |
Fig. 4 Time evolution of the HCN/HC15N ratio in simulations S1 to S3, labeled in the top panel (data reproduced from Fig. 2). The top panel displays the ratio as predicted directly in the simulations, while in the bottom panel, the HCN abundance has been derived by scaling the simulated H13CN abundance by a factor of 68. The logarithmic scaling of the y-axis in both panels was employed here to accentuate the magnitude of the differences between the results. The dashed black line in each panel indicates the assumed elemental 14N/15N ratio (440). |
4.2 Isotope-selective self-shielding of N2 and CO
Recently, Spezzano et al. (2022) presented observations of the 14N/15N ratios of CN, HCN, and HNC toward the prestellar core L1544 and found 14N/15N gradients across the core. For example for HNC, they find that the 14N/15N ratio increases toward the southeast where the core is more exposed to the interstellar radiation field (ISRF; Spezzano et al. 2016, 2022). However, CN and HCN present a reverse trend in their data set. One possible explanation for the existence of the gradients is self-shielding, which is expected to be weaker for N15N than for N2 in the outer core regions due to the much lower column density of the former. This would imply enhanced photo-destruction of N15N, releasing atomic 15N that can be subsequently incorporated into other molecules and hence influencing the 14N/15N ratios (Furuya & Aikawa 2018; Visser et al. 2018).
To test the effect of self-shielding on our results on a qualitative level, we ran a variant of the S3 simulation, S3_ss, where the self-shielding of N2, N15N, CO, and 13CO is taken into account (this is not done in any of the other simulations presented in Table 3). For this, we estimated the appropriate N2 and CO column densities by first taking the corresponding abundances from the fiducial S3 simulation at a late evolutionary time (~106 yr). These were multiplied by the thickness of the virtual envelope2 as determined from the external visual extinction (1 mag in simulation S3) using the relation N(H2)/AV = 1021 cm−2 mag−1, finally yielding N(N2) = 2 × 1013cm−2 and N(CO) = 9 × 1014cm−2. The self-shielding factors for N2 and N15N photodissociation were taken from Li et al. (2013) and Heays et al. (2014), while those for CO and 13CO were taken from Visser et al. (2009). The data are given as a function of N2 (CO) column density, and so the N15N (13CO) column density does not need to be separately estimated (the literature data assumes N(N2)/N(N15N) = 225 and N(CO)/N(13CO) = 69).
Figure 6 displays the time evolution of the CN, HCN, and HNC 14N/15N ratios in the S3 and S3_ss simulations. The difference between the simulation results is almost negligible, with only less than a 1% difference between the abundance ratios predicted by the two simulations. Motivated by the observational evidence for nonuniform illumination of L1544 by the ISRF, we ran two additional simulations like S3_ss but where the strength of the ISRF is increased from the fiducial value (G0 = 1) by a factor of two or three (but keeping the same assumed N2 column density to compute the self-shielding). The results of this simulation are also shown in Fig. 6. We find that all three 14N/15N ratios increase when the external illumination grows in strength. HNC does present a slightly different response compared to CN and HCN in that its 14N/15N ratio increases less when G0 is increased, but the overall trend is obviously different compared to what Spezzano et al. (2022) observed in L1544. Also, even with the increased amount of external illumination, and hence a larger emphasis on the difference between self-shielding of N2 and N15N, the simulation results still show only 1% level differences to the fiducial S3 simulation.
Figure 6 also shows the 12C/13C ratios of atomic C, CO, and CCH. Here the differences between the simulation results are larger than in the case of nitrogen, but still within a factor of two of the fiducial model results. First, we see that when self-shielding is introduced, all of the ratios increase in magnitude. This arises because in the physical conditions of model S3 (and hence S3_ss), the main 12C and 13C carriers are 12C+ and 13C+, which are created (at late simulation times) by photodissociation of CO (13CO) followed by photoionization of atomic 12C (13C). Reactions involving C+ (cf. Table 1, especially Reaction (1)) are then the most important ones determining the isotopic fractionation. When self-shielding is introduced, the decreased production of ionized carbon, in particular of 13C+, decreases the overall level of fractionation and the 12C/13C ratios rise with respect to the fiducial model S3.
However, the effect of the strength of the ISRF on the results is not straightforward, and the various 12C/13C ratios actually decrease when the strength of the ISRF is increased, which seems counterintuitive at first. The differential photodissociation efficiency of CO and 13CO due to self-shielding (CO self-shields more efficiently than 13CO owing to its larger column density) and hence the differential production of 12C+ and 13C+ has a more pronounced effect in stronger radiation fields – when G0 is increased, the abundance of 13C+ increases more than that of 12C+. This leads to an increase in fractionation, that is, a decrease in the various 12C/13C ratios. We stress that the effect is indeed due to self-shielding. A comparison of the results of model S3 run with different G0 factors (not shown) does not reveal significant variations in the 12C/13C ratios.
The self-shielding coefficients for N2 and N15N are, for our chosen values of H2 and N2 column density, very similar to each other, with only a ~20% difference between them. This translates to a marginal difference in the N2 and N15N photodissociation rates, and hence the effect on the atomic N/15N ratio is in our tests much smaller than what has been observed by Spezzano et al. (2022). It is conceivable that for different combinations of H2 and N2 column density, we might find different trends in the CN, HCN, and HNC 14N/15N ratios. Similar arguments apply to the analysis of the 12C/13C ratios. More detailed modeling is required to quantify this and to reach robust conclusions as regards the comparison to the observations. Also, we note that the observed spatial variations in the 14N/15N ratios may be due not only to selective self-shielding, but also to local variations in the 12C/13C ratio in the molecules. Based on the present simulation results, the latter effect might be dominant. (Spezzano et al. 2022 assumed a constant 12C/13C ratio of 68 for all molecules in their sample.) We will investigate this topic in more detail in a future work, which will include detailed prestellar core simulations that allow for a quantitative assessment of the effects of localized variations in the 12C/13C ratio. In that work, we will also investigate the abundance gradients of other molecules that are implied by the results of simulations S1 to S3.
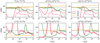 |
Fig. 5 Selected abundance ratios (indicated on top of each panel) as a function of time in simulations S1 to S3, labeled in the top right panel. Solid lines correspond to simulations where the N+C exchange reactions presented in Table 2 are excluded from the chemical network, while dashed lines show the corresponding results in the fiducial simulations that include all exchange reactions (reproducing data from Fig. 3). The dashed black line in each panel indicates either the assumed elemental 12C/13C or 14N/15N ratio, depending on the quantity being plotted. |
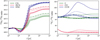 |
Fig. 6 14N/15N ratios of CN, HCN, and HNC as a function of time in three simulations: S3 (solid lines), S3_ss (dashed lines), S3_ss with G0 = 2 (dotted lines), and S3_ss with G0 = 3 (dash-dotted lines). |
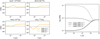 |
Fig. 7 Effect of the H2 OPR on the simulation results. Left: selected 14N/15N abundance ratios as a function of time in simulation S3 for three different initial H2 OPR values, labeled in the plot. The dashed black line in each panel indicates the elemental 14N/15N ratio (440). Right: time evolution of the H2 OPR in simulation S3. |
4.3 Effect of H2 OPR
The simulation results presented in the preceding sections all assume a low initial H2 OPR of 10−3. Higher initial values can however be expected in warmer, low-density media such as in the S3 simulation considered here. We have thus tested two additional values of the initial OPR (10−2 and 10−1) on the results of simulation S3. Even though H2 is expected to form on grains following the high-temperature statistical OPR of 3 (Watanabe et al. 2010), the gas-phase OPR deviates from the thermal ratio unless the volume density is very low (Lupi et al. 2021) due to the competition between gas-phase exchange reactions and surface formation, and hence an initial gas-phase ratio of above ~10−1 is not appropriate for the present simulations. Because carbon chemistry is not expected to be dependent on the H2 OPR, we focused in these tests on nitrogen-bearing species only.
Figure 7 shows the time evolution of selected 14N/15N abundance ratios assuming the three different initial H2 OPR values in the S3 simulation. Evidently, the initial value of the OPR has virtually no influence on the results at late simulation times – differences in the ammonia abundances for example do arise, but only from the beginning of the simulation up to times on the order of 100 yr (not shown in the figure). This means that the initial OPR value plays only a minor role for the abundances of NH3 and 15NH3. The value of the rate coefficient of the N+ + H2 → NH+ + H reaction is the determining factor for the ammonia abundance, regardless of the inclusion or exclusion of the spin states in the simulation. We have confirmed this by running an alternative S3 simulation with a chemical network that is otherwise identical to our fiducial one but where the spin states have been completely suppressed. For this test we used the rate coefficient of reaction (41) in Table 2 to represent the rate coefficient of N+ + H2 → NH+ + H (see also Dislaire et al. 2012). This is equivalent to assuming that all H2 is in ortho form. Indeed, the results of the test simulation are nearly identical to simulation S3 with OPR = 10−1, also for the early time evolution.
We have also run similar H2 OPR tests applied to simulations S1 and S2, and in those simulations we do see differences for example in the late-time NH3/15NH3 ratio depending on the initial OPR, but the differences are only on the ~10% level. This agrees with the results of Roueff et al. (2015), who found only small deviations in the nitrogen fractionation ratios when the OPR was varied, using a gas-phase model with an OPR value fixed in time. In conclusion, we expect only a very weak dependence of the isotopic abundance ratios of nitrogen-bearing molecules on the initial H2 OPR even when the OPR is allowed to evolve with time.
4.4 Uncertainty in the rate coefficients of fractionation reactions involving C2
Rocha & Linnartz (2021) have recently presented new rate coefficients for reactions involving 13C and C2/C13C. Their rate coefficients are decidedly lower than what we employ for the corresponding reactions (Table 1) despite the nearly identical exothermicity values (their Table 3). For example for our Reaction (5) in the forward direction (13C + C2 → 12C + 13CC), we obtain a rate coefficient of 2.89 × 10⁻¹⁰ cm−3 at 10 K, whereas the fit of Rocha & Linnartz (2021) gives 1.52 × 10⁻¹¹ cm−3 – though it is to be noted that the rate coefficients of Rocha & Linnartz (2021) were calculated for higher temperatures (upward of 25 K) than we consider here (10 K in most simulations).
We tested the effect of switching to the Rocha & Linnartz (2021) rate coefficients for their reactions (2) and (3) (with the C2 variants in the  state) by running new variants of simulations S1, S2, and S3 with the rate coefficients of the reactions in question switched to the Rocha & Linnartz (2021) values. We found that the effects on the simulation results are highly dependent on the physical conditions. In model S3, the rate coefficients of these reactions play only a very minor role, but in the high-density and low-temperature environment of model S1 we obtain variations of up to an order of magnitude in the 12C/13C ratios of C2 (and typically a factor of a few for other ratios) depending on the choice of the rate coefficients. The reason why the Rocha & Linnartz (2021) coefficients are so much lower than ours, or those of Loison et al. (2020), is unknown at present and hence we have not included their rate coefficients in the bulk of the analysis presented here. However, these tests highlight that constraining the rate coefficients of critical reactions is of great importance for the predictions of chemical models, and further experimental and theoretical work on this is called for.
5 Conclusions
We presented a new gas-grain model for the combined frac-tionation of 13C and 15N in the ISM3. Our model is the first to include a time-dependent treatment for spin-state chemistry in the context of 13C and 15N fractionation, which is important for simulating the chemistry of nitrogen. In addition, we introduced a set of new exchange reactions for 13C+15N fractionation, and provided updates to the rate coefficients of several reactions involving 13C. We applied the new model to a set of physical conditions representing the environment across a prototypical prestellar core, from its strongly shielded dense and cold center to the warmer outer regions in the envelope where the interstellar radiation field still penetrates.
We found that the 12C/13C ratio in the various molecules can deviate by a factor of several from the elemental 12C/13C ratio, depending on the physical conditions and on the time. For nitrogen, however, we obtained much smaller deviations from the elemental ratio, on the order of 10%. We also studied the double fractionation ratios (13CN/13C1215N13and C15N/13C15N), finding also in these cases that the 12C/13C ratios are highly variable. In contrast to the single fractionation case, we found a trend in the 13CN/13C15N ratios such that the ratios decrease with increasing volume density, though still remaining within a few tens of percent from the elemental 14N/15N ratio. We also tested the effect of selective self-shielding of N2 and CO versus N15N and 13CO, respectively, on isotopic fractionation at low volume densities. For nitrogen, self-shielding appears to play only a minor role for the isotopic abundance ratios of HCN and HNC, for example. For carbon, larger deviations from the fiducial models are seen when the self-shielding is included in the simulation, though the 12C/13C ratios remained within a factor of two from their fiducial values. It must be emphasized, however, that our tests were only qualitative and very limited owing to the zero-dimensional nature of the simulations.
The isotopic abundance ratios predicted by our new model are generally in a factor of two or better agreement with those of similar models in the literature. For example, we recover the large molecule-dependent deviations from the elemental 12C/13C ratio predicted by Colzi et al. (2020), although we obtained a substantially larger degree of carbon fractionation at low volume densities owing to a lower amount of external extinction assumed in the present model. Also, for canonical dark cloud conditions, we obtained similar single-fractionation ratios to the recent works by Loison et al. (2019) and Loison et al. (2020), and our results support the finding of Wirström & Charnley (2018) that updates to the rate coefficients of the presently considered isotopic exchange reactions are not enough to reproduce the observed (anti-)fractionation of several N-bearing species.
The simulation results are sensitive to the physical conditions, and imply gradients in isotopic fractionation across prestellar cores. Such gradients were recently deduced observationally by Spezzano et al. (2022), but the interpretation of the observations is limited by the nonavailability of quantitative information on the gradients from a simulation point of view. The analysis is further complicated by the fact that the various isotopic forms do not necessarily trace the same regions within the core. We will carry out more detailed modeling to quantify the magnitude of fractionation gradients in an upcoming work, where we will also explore the observational implications of our work in more detail – the main aim of the present paper was to present the newly developed model and to discuss some of the main results on a general level. On the theoretical side, extensions of the model to additional isotopes such as deuterium and 17O, 18O would bring useful new information on the abundances of molecules fractionated in several species simultaneously, especially to constrain their usability as tracers of the shielded regions of prestellar cores.
Acknowledgements
We thank the anonymous referee for useful comments and suggestions. O.S. and P.C. gratefully acknowledge the funding by the Max Planck Society. L.C. acknowledges financial support through the Spanish grant PID2019-105552RB-C41 funded by MCIN/AEI/10.13039/501100011033. This work is supported by Chalmers Gender Initiative for Excellence (Genie).
Appendix A Additional simulation results
Figure A.1 shows the effect of density and temperature changes on selected 12C/13C ratios, which we did not explore in Sect. 3. For completeness, we also include here plots for some species that were not included in Fig. 1. There is a great deal of variation in the 12C/13C ratios depending on the physical conditions, emphasizing the need for detailed models in interpreting the results of observations when using scaling factors is required. This could happen for example when one or several isotopic forms cannot be observed, and thus an abundance ratio cannot be consistently derived from observations. We note that the predictions of the lowest-density simulation (S3) are in this respect very different to the results presented in C20 for similar physical conditions (see especially their figures 7 and B.1) – the present model predicts a high level of fractionation for CO and CN, with 12C/13C ratios of only ~10. This is because of the assumed visual extinction, which is 1 mag in simulation S3, but 10 mag in C20. A low extinction translates to a high abundance of C+, enabling efficient fractionation through the exchange reactions that it is involved in (see Table 1). We have confirmed via testing that if one increases the extinction such that photo-processes are no longer important, results similar to C20 are recovered also at low densities. Also, the lack of CO self-shielding in the fiducial simulation S3 influences the degree of carbon fractionation (cf. Fig. 6 in the main text).
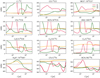 |
Fig. A.1 Selected 12C/13C and 14N/15N abundance ratios as a function of time in simulations S1 to S3, labeled in the top right panel. The dashed black line in each panel indicates either the assumed elemental 14N/15N ratio (440) or the elemental 12C/13C ratio (68), except for C3 for which a ratio of 34 is used as our model does not distinguish between CC13C and 13CCC. Solid and dashed colored lines represent simulations without and with the C+N exchange reactions (Table 2), respectively. In the case of the 12C/13C ratios, these lines overlap almost perfectly. |
The dependence of the N2H+/N15NH+, CN/C15N, and HCN/HC15N ratios on the physical conditions was already explored in Fig. 2 in the main text, but we include them in Fig. A.1 in the context of demonstrating the impact of the C+N exchange reactions (Table 2) on singly fractionated carbon or nitrogen-bearing species. Evidently, the said reactions have a very marginal influence on the 14N/15N ratios, and negligible influence on the 12C/13C ratios.
References
- Adams, N. G., & Smith, D. 1981, ApJ, 247, L123 [NASA ADS] [CrossRef] [Google Scholar]
- Altwegg, K., Balsiger, H., & Fuselier, S. A. 2019, ARA & A, 57, 113 [NASA ADS] [CrossRef] [Google Scholar]
- Anicich, V. G., Huntress, W. T. J., & Futrell, J. H. 1977, Chem. Phys. Lett., 47, 488 [NASA ADS] [CrossRef] [Google Scholar]
- Bizzocchi, L., Caselli, P., Leonardo, E., & Dore, L. 2013, A & A, 555, A109 [NASA ADS] [CrossRef] [EDP Sciences] [Google Scholar]
- Caselli, P., & Ceccarelli, C. 2012, A & ARv, 20, 56 [NASA ADS] [Google Scholar]
- Ceccarelli, C., Caselli, P., Bockelée-Morvan, D., et al. 2014, in Protostars and Planets VI, eds. H. Beuther, R. S. Klessen, C. P. Dullemond, & T. Henning (Tucson: University of Arizona Press), 859 [Google Scholar]
- Colin, R., & Bernath, P. F. 2012, J. Mol. Spectr., 273, 30 [Google Scholar]
- Colin, R., & Bernath, P. F. 2014, J. Mol. Spectr., 302, 34 [Google Scholar]
- Colzi, L., Fontani, F., Rivilla, V. M., et al. 2018, MNRAS, 478, 3693 [Google Scholar]
- Colzi, L., Fontani, F., Caselli, P., et al. 2019, MNRAS, 485, 5543 [NASA ADS] [CrossRef] [Google Scholar]
- Colzi, L., Sipilä, O., Roueff, E., Caselli, P., & Fontani, F. 2020, A & A, 640, A51 [NASA ADS] [CrossRef] [EDP Sciences] [Google Scholar]
- Dislaire, V., Hily-Blant, P., Faure, A., et al. 2012, A & A, 537, A20 [NASA ADS] [CrossRef] [EDP Sciences] [Google Scholar]
- Draine, B. T., & Bertoldi, F. 1996, ApJ, 468, 269 [Google Scholar]
- Drozdovskaya, M. N., Schroeder I. I. R. H. G., Rubin, M., et al. 2021, MNRAS, 500, 4901 [Google Scholar]
- Faure, A., Hily-Blant, P., Rist, C., et al. 2019, MNRAS, 487, 3392 [Google Scholar]
- Furuya, K., & Aikawa, Y. 2018, ApJ, 857, 105 [Google Scholar]
- Grewal, D. S., Dasgupta, R., & Marty, B. 2021, Nat. Astron., 5, 356 [NASA ADS] [CrossRef] [Google Scholar]
- Heays, A. N., Visser, R., Gredel, R., et al. 2014, A & A, 562, A61 [NASA ADS] [CrossRef] [EDP Sciences] [Google Scholar]
- Hily-Blant, P., Magalhaes de Souza, V., Kastner, J., & Forveille, T. 2019, A & A, 632, L12 [CrossRef] [EDP Sciences] [Google Scholar]
- Hily-Blant, P., Pineau des Forêts, G., Faure, A., & Flower, D. R. 2020, A & A, 643, A76 [CrossRef] [EDP Sciences] [Google Scholar]
- Li, X., Heays, A. N., Visser, R., et al. 2013, A & A, 555, A14 [NASA ADS] [CrossRef] [EDP Sciences] [Google Scholar]
- Loison, J.-C., Wakelam, V., Gratier, P., & Hickson, K. M. 2019, MNRAS, 484, 2747 [NASA ADS] [CrossRef] [Google Scholar]
- Loison, J.-C., Wakelam, V., Gratier, P., & Hickson, K. M. 2020, MNRAS, 498, 4663 [Google Scholar]
- Lupi, A., Bovino, S., & Grassi, T. 2021, A & A, 654, L6 [NASA ADS] [CrossRef] [EDP Sciences] [Google Scholar]
- Marty, B., Chaussidon, M., Wiens, R. C., Jurewicz, A. J. G., & Burnett, D. S. 2011, Science, 332, 1533 [NASA ADS] [CrossRef] [Google Scholar]
- Mehnen, B., Suarez Martin, I., Roueff, E., Hochlaf, M., & Nyman, G. 2022, MNRAS, 517, 3126 [Google Scholar]
- Milam, S. N., Savage, C., Brewster, M. A., Ziurys, L. M., & Wyckoff, S. 2005, ApJ, 634, 1126 [Google Scholar]
- Nomura, H., Furuya, K., Cordiner, M. A., et al. 2022, arXiv e-prints [arXiv:2283.18863] [Google Scholar]
- Ram, R. S., & Bernath, P. F. 2012, J. Mol. Spectr., 274, 22 [Google Scholar]
- Ram, R. S., Wallace, L., & Bernath, P. F. 2010, J. Mol. Spectr., 263, 82 [Google Scholar]
- Redaelli, E., Bizzocchi, L., Caselli, P., et al. 2018, A & A, 617, A7 [NASA ADS] [CrossRef] [EDP Sciences] [Google Scholar]
- Redaelli, E., Bizzocchi, L., Caselli, P., & Pineda, J. E. 2023, A & A, 674, L8 [NASA ADS] [CrossRef] [EDP Sciences] [Google Scholar]
- Rocha, C. M. R., & Linnartz, H. 2021, A & A, 647, A142 [NASA ADS] [CrossRef] [EDP Sciences] [Google Scholar]
- Roueff, E., Loison, J. C., & Hickson, K. M. 2015, A & A, 576, A99 [NASA ADS] [CrossRef] [EDP Sciences] [Google Scholar]
- Semenov, D., Hersant, F., Wakelam, V., et al. 2010, A & A, 522, A42 [NASA ADS] [CrossRef] [EDP Sciences] [Google Scholar]
- Sipilä, O., Harju, J., Caselli, P., & Schlemmer, S. 2015, A & A, 581, A122 [CrossRef] [EDP Sciences] [Google Scholar]
- Spezzano, S., Bizzocchi, L., Caselli, P., Harju, J., & Brünken, S. 2016, A & A, 592, L11 [NASA ADS] [CrossRef] [EDP Sciences] [Google Scholar]
- Spezzano, S., Caselli, P., Sipilä, O., & Bizzocchi, L. 2022, A & A, 664, L2 [NASA ADS] [CrossRef] [EDP Sciences] [Google Scholar]
- Visser, R., van Dishoeck, E. F., & Black, J. H. 2009, A & A, 503, 323 [NASA ADS] [CrossRef] [EDP Sciences] [Google Scholar]
- Visser, R., Bruderer, S., Cazzoletti, P., et al. 2018, A & A, 615, A75 [NASA ADS] [CrossRef] [EDP Sciences] [Google Scholar]
- Wakelam, V., Loison, J.-C., Herbst, E., et al. 2015, ApJS, 217, 20 [Google Scholar]
- Wampfler, S. F., Jørgensen, J. K., Bizzarro, M., & Bisschop, S. E. 2014, A & A, 572, A24 [NASA ADS] [CrossRef] [EDP Sciences] [Google Scholar]
- Watanabe, N., Kimura, Y., Kouchi, A., et al. 2010, ApJ, 714, L233 [Google Scholar]
- Wirström, E. S., & Charnley, S. B. 2018, MNRAS, 474, 3720 [CrossRef] [Google Scholar]
- Wirström, E. S., Charnley, S. B., Cordiner, M. A., & Milam, S. N. 2012, ApJ, 757, L11 [CrossRef] [Google Scholar]
The simulations using the C20 network have been rerun for this paper, that is, the curves shown in Fig. 1 are not a reproduction of the corresponding results shown in C20. Even though the chemical network is the same, some differences to the results of C20 can be seen. This is because of H2 self-shielding which was omitted in C20 but is included here (following Draine & Bertoldi 1996, Eq. (37)).
The simulations are zero-dimensional, and hence there is no actual attenuating gas included in the simulation.
The chemical networks developed for this study can be obtained upon request to the corresponding author.
All Tables
List of nitrogen, as well as carbon+nitrogen, isotopic exchange reactions included in the model.
All Figures
|
Fig. 1 Selected 12C/13C abundance ratios as a function of time in the variants of simulation S2 (S2, red; S2_C20, green; S2_3C, orange; S2_3C_alt, blue). The dashed black line in each panel indicates the elemental 12C/13C ratio (68), except for C3 for which a ratio of 34 is used as our model does not distinguish between CC13C and 13CCC. The results of simulations S2 and S2_3C overlap almost perfectly. |
| In the text | |
|
Fig. 2 Selected 14N/15N abundance ratios as a function of time in simulations S1 to S3, labeled in the top right panel. The dashed black line in each panel indicates the assumed elemental 14N/15N ratio (440). |
| In the text | |
|
Fig. 3 Selected abundance ratios as a function of time in simulations S1 to S3, labeled in the top right panel. Top: ratios of 13C-substituted CN, HCN, and HNC to their 13C+15N-substituted forms. The dashed black line in each panel indicates the assumed elemental 14N/15N ratio (440). Bottom: ratios of 15N-substituted CN, HCN, and HNC to their 13C+15N-substituted forms. The dashed black line in each panel indicates the assumed elemental 12C/13C ratio (68). |
| In the text | |
|
Fig. 4 Time evolution of the HCN/HC15N ratio in simulations S1 to S3, labeled in the top panel (data reproduced from Fig. 2). The top panel displays the ratio as predicted directly in the simulations, while in the bottom panel, the HCN abundance has been derived by scaling the simulated H13CN abundance by a factor of 68. The logarithmic scaling of the y-axis in both panels was employed here to accentuate the magnitude of the differences between the results. The dashed black line in each panel indicates the assumed elemental 14N/15N ratio (440). |
| In the text | |
|
Fig. 5 Selected abundance ratios (indicated on top of each panel) as a function of time in simulations S1 to S3, labeled in the top right panel. Solid lines correspond to simulations where the N+C exchange reactions presented in Table 2 are excluded from the chemical network, while dashed lines show the corresponding results in the fiducial simulations that include all exchange reactions (reproducing data from Fig. 3). The dashed black line in each panel indicates either the assumed elemental 12C/13C or 14N/15N ratio, depending on the quantity being plotted. |
| In the text | |
|
Fig. 6 14N/15N ratios of CN, HCN, and HNC as a function of time in three simulations: S3 (solid lines), S3_ss (dashed lines), S3_ss with G0 = 2 (dotted lines), and S3_ss with G0 = 3 (dash-dotted lines). |
| In the text | |
|
Fig. 7 Effect of the H2 OPR on the simulation results. Left: selected 14N/15N abundance ratios as a function of time in simulation S3 for three different initial H2 OPR values, labeled in the plot. The dashed black line in each panel indicates the elemental 14N/15N ratio (440). Right: time evolution of the H2 OPR in simulation S3. |
| In the text | |
|
Fig. A.1 Selected 12C/13C and 14N/15N abundance ratios as a function of time in simulations S1 to S3, labeled in the top right panel. The dashed black line in each panel indicates either the assumed elemental 14N/15N ratio (440) or the elemental 12C/13C ratio (68), except for C3 for which a ratio of 34 is used as our model does not distinguish between CC13C and 13CCC. Solid and dashed colored lines represent simulations without and with the C+N exchange reactions (Table 2), respectively. In the case of the 12C/13C ratios, these lines overlap almost perfectly. |
| In the text | |
Current usage metrics show cumulative count of Article Views (full-text article views including HTML views, PDF and ePub downloads, according to the available data) and Abstracts Views on Vision4Press platform.
Data correspond to usage on the plateform after 2015. The current usage metrics is available 48-96 hours after online publication and is updated daily on week days.
Initial download of the metrics may take a while.