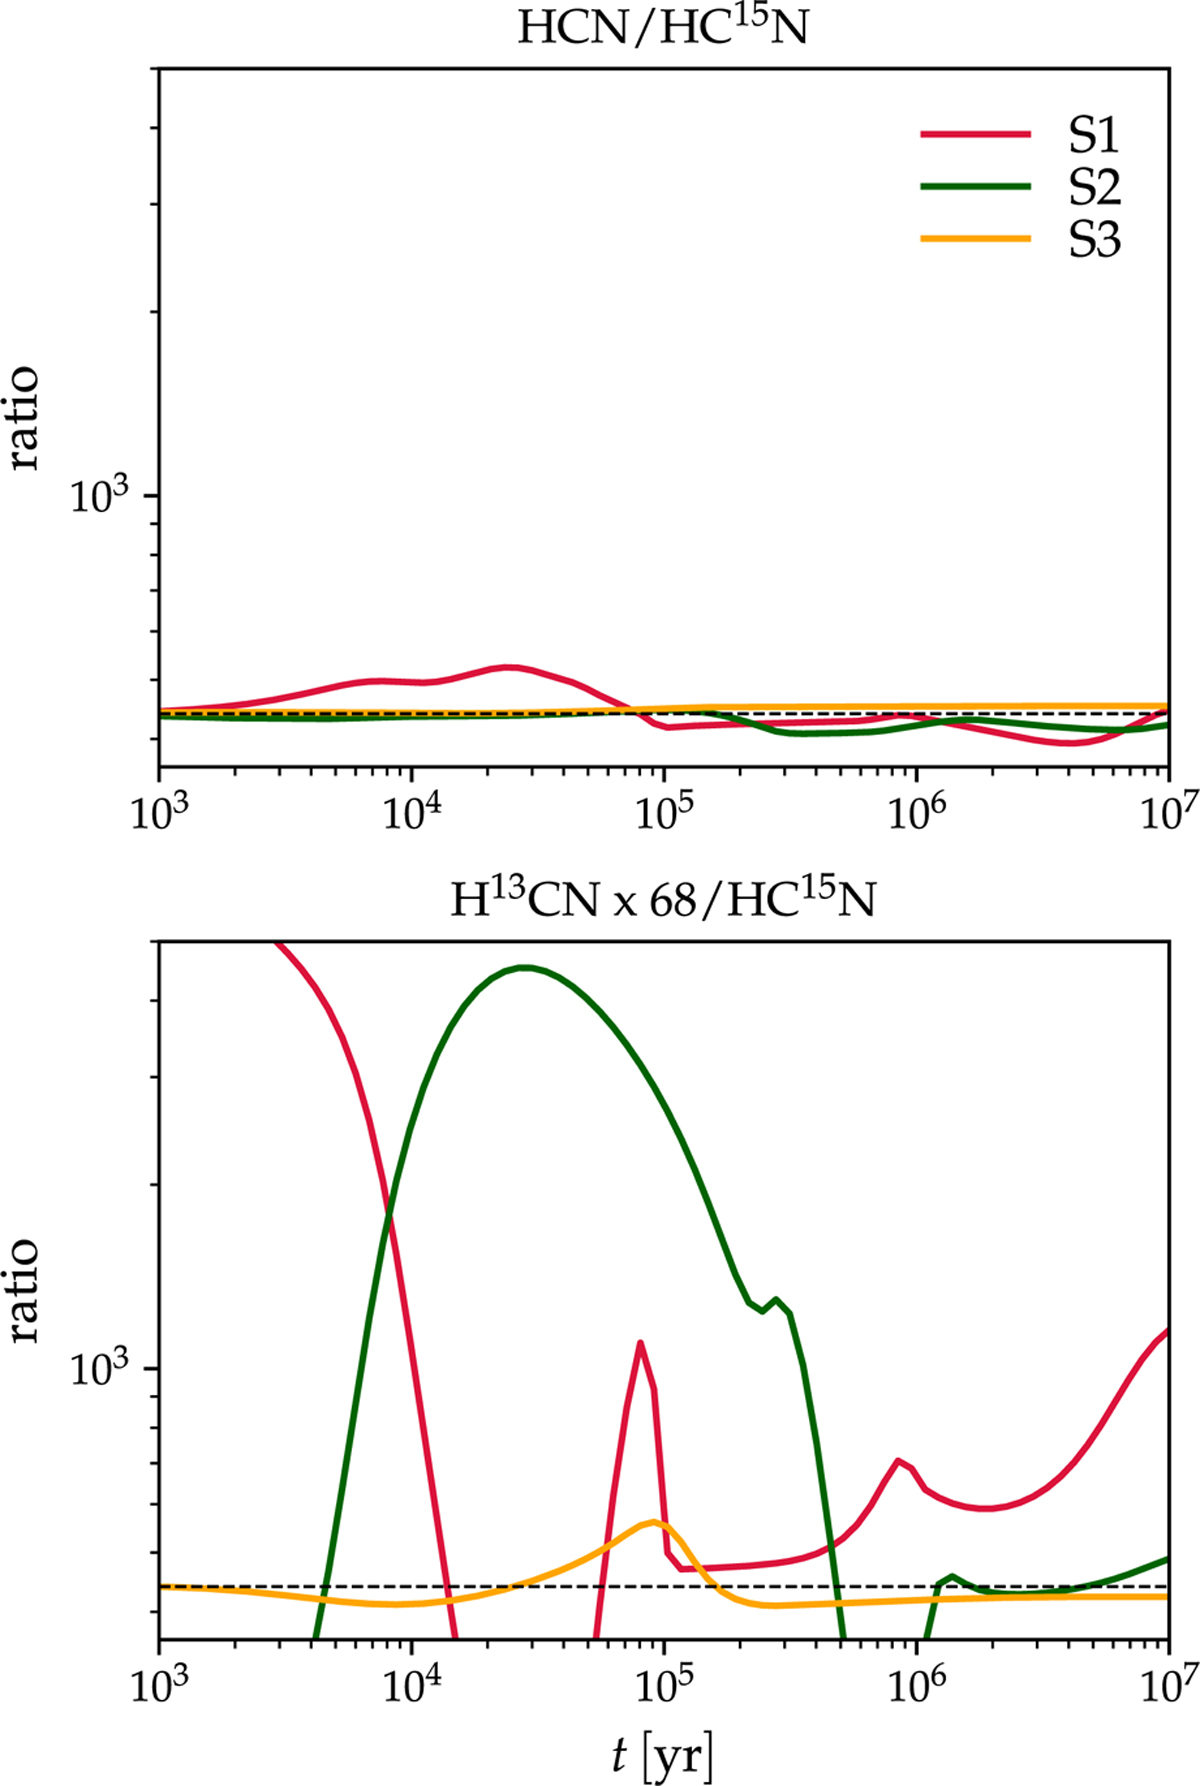
Fig. 4
Download original image
Time evolution of the HCN/HC15N ratio in simulations S1 to S3, labeled in the top panel (data reproduced from Fig. 2). The top panel displays the ratio as predicted directly in the simulations, while in the bottom panel, the HCN abundance has been derived by scaling the simulated H13CN abundance by a factor of 68. The logarithmic scaling of the y-axis in both panels was employed here to accentuate the magnitude of the differences between the results. The dashed black line in each panel indicates the assumed elemental 14N/15N ratio (440).
Current usage metrics show cumulative count of Article Views (full-text article views including HTML views, PDF and ePub downloads, according to the available data) and Abstracts Views on Vision4Press platform.
Data correspond to usage on the plateform after 2015. The current usage metrics is available 48-96 hours after online publication and is updated daily on week days.
Initial download of the metrics may take a while.