Open Access
Fig. 7
Download original image
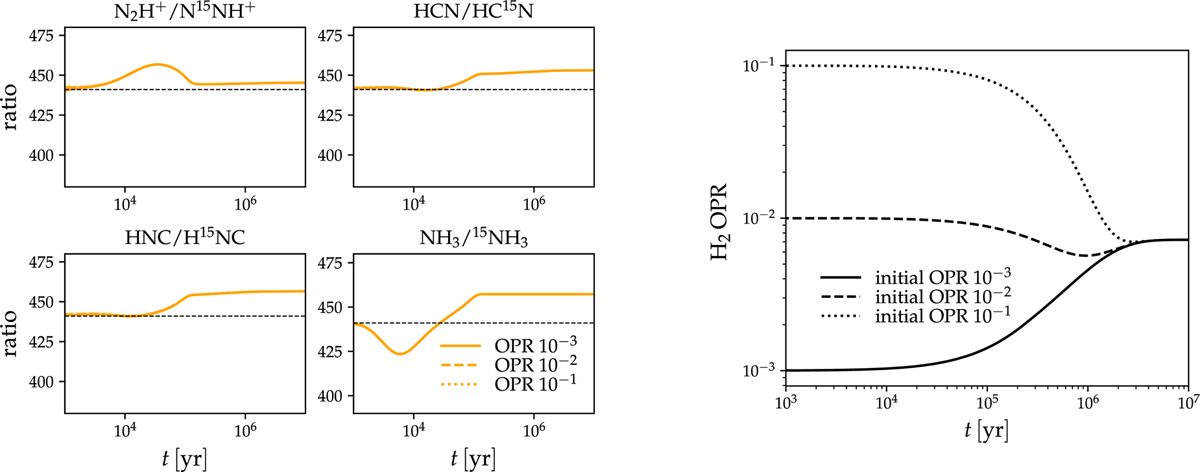
Effect of the H2 OPR on the simulation results. Left: selected 14N/15N abundance ratios as a function of time in simulation S3 for three different initial H2 OPR values, labeled in the plot. The dashed black line in each panel indicates the elemental 14N/15N ratio (440). Right: time evolution of the H2 OPR in simulation S3.
Current usage metrics show cumulative count of Article Views (full-text article views including HTML views, PDF and ePub downloads, according to the available data) and Abstracts Views on Vision4Press platform.
Data correspond to usage on the plateform after 2015. The current usage metrics is available 48-96 hours after online publication and is updated daily on week days.
Initial download of the metrics may take a while.