Fig. 5
Download original image
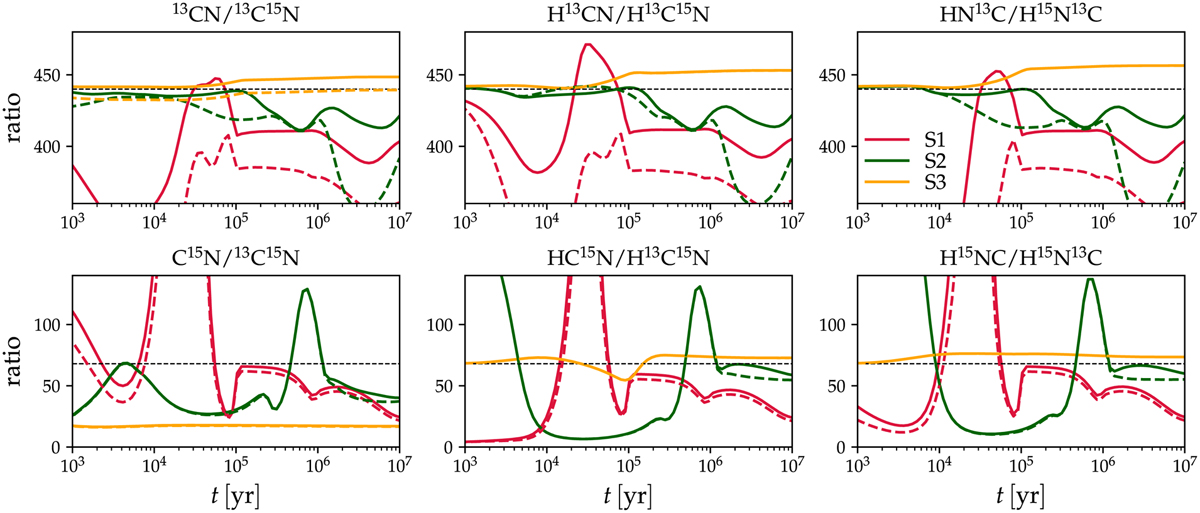
Selected abundance ratios (indicated on top of each panel) as a function of time in simulations S1 to S3, labeled in the top right panel. Solid lines correspond to simulations where the N+C exchange reactions presented in Table 2 are excluded from the chemical network, while dashed lines show the corresponding results in the fiducial simulations that include all exchange reactions (reproducing data from Fig. 3). The dashed black line in each panel indicates either the assumed elemental 12C/13C or 14N/15N ratio, depending on the quantity being plotted.
Current usage metrics show cumulative count of Article Views (full-text article views including HTML views, PDF and ePub downloads, according to the available data) and Abstracts Views on Vision4Press platform.
Data correspond to usage on the plateform after 2015. The current usage metrics is available 48-96 hours after online publication and is updated daily on week days.
Initial download of the metrics may take a while.