Fig. A.1
Download original image
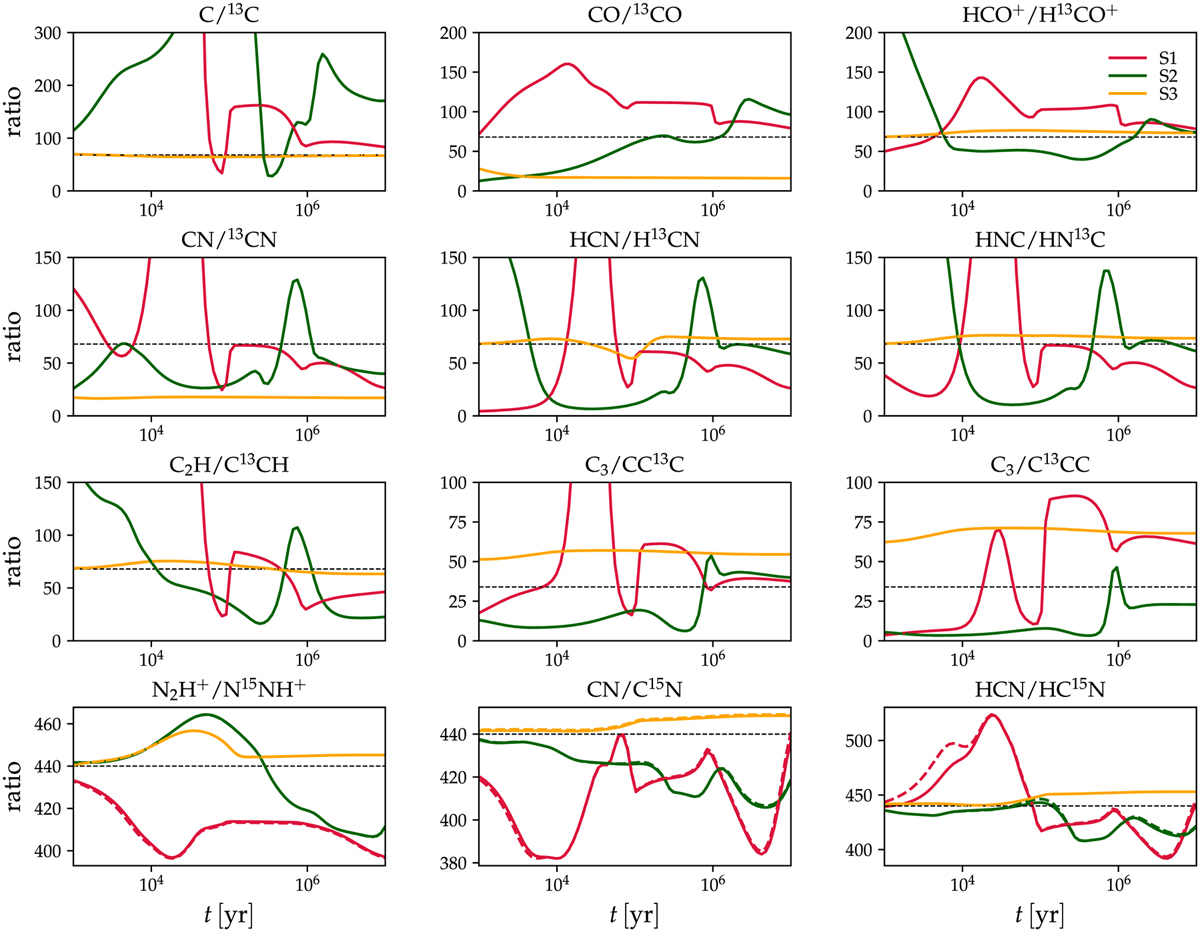
Selected 12C/13C and 14N/15N abundance ratios as a function of time in simulations S1 to S3, labeled in the top right panel. The dashed black line in each panel indicates either the assumed elemental 14N/15N ratio (440) or the elemental 12C/13C ratio (68), except for C3 for which a ratio of 34 is used as our model does not distinguish between CC13C and 13CCC. Solid and dashed colored lines represent simulations without and with the C+N exchange reactions (Table 2), respectively. In the case of the 12C/13C ratios, these lines overlap almost perfectly.
Current usage metrics show cumulative count of Article Views (full-text article views including HTML views, PDF and ePub downloads, according to the available data) and Abstracts Views on Vision4Press platform.
Data correspond to usage on the plateform after 2015. The current usage metrics is available 48-96 hours after online publication and is updated daily on week days.
Initial download of the metrics may take a while.