| Issue |
A&A
Volume 595, November 2016
|
|
|---|---|---|
| Article Number | A51 | |
| Number of page(s) | 18 | |
| Section | Interstellar and circumstellar matter | |
| DOI | https://doi.org/10.1051/0004-6361/201528042 | |
| Published online | 28 October 2016 | |
Evolutionary status of dense cores in the NGC 1333 IRAS 4 star-forming region
1 SRON Netherlands Institute for Space Research, Landleven 12, 9747 AD Groningen, The Netherlands
e-mail: ev.koumpia@gmail.com
2 Kapteyn Institute, University of Groningen, Landleven 12, 9747 AD Groningen, The Netherlands
3 Korea Astronomy and Space Science Institute, 776, Daedeok-Daero, Yuseong-gu, 34055 Daejeon, Korea
4 National Radio Astronomy Observatory, Charlottesville, VA 22903, USA
5 Leiden Observatory, Leiden University, PO Box 9513, 2300 RA Leiden, The Netherlands
6 Jodrell Bank Centre for Astrophysics & UK ALMA Regional Centre Node, School of Physics & Astronomy, The University of Manchester, Manchester, M13 9PL, UK
7 Department of Physics & Astronomy and Institute for Space Imaging Sciences, University of Calgary, Calgary, AB T2N 1N4, Canada
8 Korea University of Science and Technology, 217 Gajeong-ro, Yuseong-gu, 34113 Daejeon, Korea
Received: 24 December 2015
Accepted: 25 August 2016
Context. Protostellar evolution after the formation of the protostar is becoming reasonably well characterized, but the evolution from a prestellar core to a protostar is not well known, although the first hydrostatic core (FHSC) must be a pivotal step.
Aims. NGC 1333 – IRAS 4C is a potentially very young object that we can directly compare with the nearby Class 0 objects IRAS 4A and IRAS 4B. Observational constraints are provided by spectral imaging from the JCMT Spectral Legacy Survey (330−373 GHz). We present integrated intensity and velocity maps of several species, including CO, H2CO and CH3OH. CARMA observations provide additional information with which we can distinguish IRAS 4C from other evolutionary stages.
Methods. We present the observational signatures of the velocity of an observed outflow, the degree of CO depletion, the deuterium fractionation of [DCO+]/[HCO+], and gas kinetic temperatures.
Results. We report differences between the three sources in four aspects: a) the kinetic temperature as probed using the H2CO lines is much lower toward IRAS 4C than the other two sources; b) the line profiles of the detected species show strong outflow activity toward IRAS 4A and IRAS 4B, but not toward IRAS 4C; c) the HCN/HNC is <1 toward IRAS 4C, which confirms the cold nature of the source; d) the degree of CO depletion and the deuteration are lowest toward the warmest of the sources, IRAS 4B.
Conclusions. IRAS 4C seems to be in a different evolutionary state than the sources IRAS 4A and IRAS 4B. We can probably exclude the FHSC stage becaues of the relatively low Lsmm/Lbol (~6%), and we investigate the earliest accretion phase of Class 0 stage and the transition between Class 0 to Class I. Our results do not show a consistent scenario for either case; the main problem is the absence of outflow activity and the cold nature of IRAS 4C. The number of FHSC candidates in Perseus is ~10 times higher than current models predict, which suggests that the lifespan of these objects is ≥103 yrs, which might be due to an accretion rate lower than 4 × 10⁻⁵ M⊙/yr.
Key words: ISM: abundances / ISM: kinematics and dynamics / ISM: molecules / stars: formation / stars: low-mass / stars: protostars
© ESO, 2016
1. Introduction
Stars form by gravitational collapse of dense cores in molecular clouds. To understand the origin of stellar masses, multiple systems, and outflows, it is necessary to understand the formation and evolution of dense cores. Because they represent the earliest phase of star formation, both prestellar and protostellar cores have been observed and studied using large (sub-) millimeter telescopes (e.g., JCMT; Enoch et al. 2006; van Kempen et al. 2006), infrared (e.g., Spitzer; Evans et al. 2003, 2009; Jørgensen et al. 2006; Hatchell et al. 2005; Young et al. 2004) and interferometers (e.g., CARMA; Enoch et al. 2010; Di Francesco et al. 2001). While the basic evolutionary ordering of protostellar objects seems firmly established (e.g., Andre et al. 2000), we still do not have a clear view of the evolutionary process that turns a prestellar core into a protostar (Bergin & Tafalla 2007; Evans et al. 2009).
The transition from prestellar to protostellar cores is predicted to be the first hydrostatic core, FHSC (Larson 1969), which represents the phase after the collapse of the parent core and before the formation of a protostar. This object is characterized by a very short lifetime (~1000 yrs; Machida et al. 2008). Recent studies have provided a few candidates, including Per-bolo 58, L1448-IRS2E, LDN 1451-mm, B1-bN, B1-bS, and Per-bolo 45 (Enoch et al. 2010; Chen et al. 2010; Pineda et al. 2011; Pezzuto et al. 2012; Schnee et al. 2012). Statistically, using  (1)and assuming a lifespan of ~103 yr for FHSC and 2.2 ~ 105 yr for Class 0 objects (Enoch et al. 2009), while there are about 27 Class 0 objects in Perseus (Enoch et al. 2009), the predicted number of FHSC in Perseus is ≤0.2. When adopting a lifetime of ~104 yr for Class 0 objects based on the outflow kinematic timescale (Machida & Hosokawa 2013), the predicted number of FHSC in Perseus is about 5, which is closer to the observed number.
Another very early stage of low-mass star formation is the very low luminosity object (VeLLO), which is characterized by an internal luminosity of ≤0.1 L⊙. Dunham et al. (2008) reported 15 VeLLO candidates, while even fewer have been studied in detail (e.g., L1014-IRS, L1521F-IR, IRAM 04191+1522; Young et al. 2004; Bourke et al. 2006; Dunham et al. 2006). VeLLOs have been associated with a brown dwarf progenitor (Lee et al. 2013) or a very low mass Class 0 protostar with low accretion, but their exact nature is still uncertain.
The NGC 1333 region in the Perseus molecular cloud is an excellent laboratory to study early stages of low-mass star formation. NGC 1333 is a nearby (D = 235 pc; Hirota et al. 2008) and young (<1 My; Gutermuth et al. 2008) star-forming region. It is a part of the Perseus OB2 molecular cloud complex, which contains a large number of young stellar objects (YSOs). It hosts about 50 YSOs and 36 Herbig-Haro objects.
This work focuses on three YSOs in NGC 1333: IRAS 4A, IRAS 4B, and IRAS 4C. While IRAS 4A and IRAS 4B are well-studied Class 0 objects, the nature of IRAS 4C is still under debate. Previous studies, including Enoch et al. (2009) and Sadavoy et al. (2014) also classified IRAS 4C as a Class 0 YSO. Both IRAS 4A and IRAS 4B are found to be binaries. Sandell & Knee (2001) and Di Francesco et al. (2001) resolved the IRAS 4B/IRAS 4B II binary using JCMT and PdBI, reporting the fainter binary companion IRAS 4B II at ~10″ to the east of IRAS 4B. IRAS 4B II has been called IRAS 4C as well (e.g., Looney et al. 2000), but IRAS 4C is generally used as the source in our work, which is ~40″ east-northeast of IRAS 4A (e.g., Smith et al. 2000).
Interferometric observations of ammonia toward all three sources were briefly reported in Wootten (1995), where only the emission from IRAS 4A was clearly associated with outflowing warm gas. In the same study, IRAS 4C does not show this clear association with the structures located near the protostellar environment. Interferometric observations of ammonia and of NH2D toward IRAS 4A and IRAS 4C were reported in Shah & Wootten (2001) and indicated colder conditions toward IRAS 4C.
We use observations made with the James Clerk Maxwell Telescope (JCMT) of the molecular line emission and dust continuum observations obtained with the Combined Array for Research in Millimeter-wave Astronomy (CARMA) to clarify the evolutionary status of IRAS 4C. We used the nearby IRAS 4A and IRAS 4B sources as comparison standards and studied the physical and chemical structure that characterizes these very early evolutionary stages. Our study of IRAS 4C is unique since it provides information about the spatial and velocity structure of many molecules, while it has previously been studied mainly photometrically (e.g., Dunham et al. 2008; Enoch et al. 2009; Sadavoy et al. 2014).
To understand the nature of IRAS 4C, it is crucial to obtain the properties of the dust and gas that are present in its envelope and outflow. One of the observational signatures that distinguish an FHSC from a typical protostar is the velocity of the molecular outflow. According to models, an FHSC should be able to drive an early outflow, which is expected to be weak and of low velocity V~3 km s-1 (Machida et al. 2008; Tomida et al. 2010), while the typical speed of a protostellar outflow is 10−20 km s-1 (Arce & Sargent 2006). Thus, measuring the velocity of an observed outflow could test the evolutionary stage of IRAS 4C. Water masers could indicate an outflow activity, but several interferometric surveys have not detected associated maser emission near IRAS 4C (Rodríguez et al. 2002; Furuya et al. 2003; Park & Choi 2007).
Another observational tool is the deuterium fractionation (e.g., [N2D+]/[N2H+]), which can be used as a chemical clock (Belloche et al. 2006; Fontani et al. 2011, 2014). Deuterated species are enhanced in environments of low temperatures (T < 20 K) where CO is depleted (Millar et al. 1989). The coldest (i.e., the youngest) objects are characterized by the largest deuterium fractionation (Crapsi et al. 2005a).
Although there is no single observational signature that determines the evolutionary stage of such young objects, taken together, the observational properties listed above provide strong tools to distinguish the evolutionary status of IRAS 4C compared to IRAS 4A or IRAS 4B.
2. Observations and data reduction
2.1. JCMT
Spectral maps of the NGC 1333 IRAS 4 region were taken as a part of the JCMT Spectral Legacy Survey (SLS; Plume et al. 2007) with the 16-element Heterodyne Array Receiver Programme B (HARP-B) and the Auto-Correlation Spectral Imaging System (ACSIS) at the JCMT1 on Mauna Kea, Hawaii. HARP-B consists of 16 pixels providing high-resolution (1 MHz, ~1 km s-1) maps of a 2′× 2′ field. The original frequency coverage of 330−360 GHz of the survey was complemented by HARP maps at the window of the higher frequencies (360−373 GHz) as a result of additional proposals between 2007 and 2010. The observations were performed in a jiggle position-switch mode to create maps of a 2′× 2′ area with pixels spaced by 7.5″. Our maps were centered on RA = 03:29:11.3, Dec = 31:13:19.5 (J2000). The spectra were taken using an off-position at RA = 03:30:21.0, Dec = 31:13:19.5 (J2000), which is about 15′ east of the field center. The angular resolution of the JCMT is ~ 15″ at 345 GHz, which is equivalent to ~ 3000 AU at the distance of NGC 1333 IRAS 4 (Choi et al. 2004). The beam efficiency is 0.63 (Buckle et al. 2009).
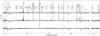 |
Fig. 1 Main line detections of the spectra extracted for the three positions of NGC 1333: IRAS 4A, IRAS 4B, and IRAS 4C covering the full JCMT range 330−373 GHz. The gap seen at 368−369.5 GHz is due to poor atmospheric transmission. The spectra are plotted with a vertical offset at 0.3, 0.7 and 1.1 intensity levels (K) to facilitate comparison. The coordinates of the three sources IRAS 4A (RA = 03:29:10.51, Dec = 31:13:31.4 (J2000)), IRAS 4B (RA = 03:29:12.01, Dec = 31:13:08.0 (J2000)) and IRAS 4C (RA = 03:29:13.64, Dec = 31:13:57.5 (J2000)) are taken from Sandell & Knee (2001). |
The raw time-series files were reduced semi-manually using standard procedures from the Starlink software package2 in combination with the ORAC Data Reduction pipeline (ORAC-DR). Each scan file was inspected and corrected for bad receptors, baseline subtraction, and spike removal before we converted the time-series frequencies to 3D data cubes. The pipeline output was also checked and corrected for remaining baseline problems, high rms noise level cubes, or position problems using specific tasks from Starlink. The overall noisy band edges were ignored, allowing ~0.85 GHz of bandwidth per frequency block to be used. The overall rms noise level ranges between 0.005 and 0.05 K for the majority of the cubes with detected lines.
2.2. CARMA
To study the small-scale structure of IRAS 4C (RA = 03:29:13.64, Dec = 31:13:57.5 (J2000)), including dust properties, we obtained single pointing interferometric CARMA3 observations at 1.3 mm between April and July 2014. The 15-element array excluding eight 3.5-m antennas consists of nine telescopes with diameters of 6.1 m and six telescopes with diameters of 10.4 m with a primary beam at 230 GHz of 47′′ and 28′′, respectively.
In addition to the dust continuum emission, we observed the following molecular transitions: CO 2−1 (230.5 GHz), 13CO 2−1 (220.4 GHz), C18O 2−1 (219.6 GHz), and N2D+ (231.3 GHz), which are tracers of an envelope and/or outflow. These observations were performed in a dual-polarization mode that provided a better sensitivity in D configuration. For the CO isotope lines, a 31 MHz bandwidth was used with three-bit sample mode, which provides a good velocity resolution (~ 0.13 km s-1) and coverage (~ 40 km s-1) to trace the kinematics of the envelope and the outflow. These four molecular lines were observed simultaneously using three bands, and the additional fourth band was set to the wide 500 MHz bandwidth for the continuum emission and calibration. The CARMA data are characterized by 2″ angular resolution (~500 AU at the target distance) and ~15 mJy/beam sensitivity. Because the typical dense cores and envelope sizes are around 5000 AU (Crapsi et al. 2005b), our data resolve the structures well.
We reduced and edited the visibility data using the MIRIAD software package (Sault et al. 1995).
3. Observational results
3.1. Single-dish line detections and morphology
The JCMT data provide information about the spatial and velocity distributions of many different molecules. The majority of lines show clear emission toward the Class 0 IRAS 4A and IRAS 4B sources, whereas fewer molecules show compact emission toward IRAS 4C (Fig. 1).
Figure 2 shows the H2CO 51,5–41,4 emission as a representative example of the spatial distribution seen in all three sources. Emission from IRAS 4A and IRAS 4B and their surroundings is prominent, with the strongest emission toward IRAS 4B. There is also significant emission toward the north of IRAS 4A, as a result of its strong outflow activity. The peak of the red wing emission (from +10 to +17 km s-1) of H2CO is also at this position. Weak emission of H2CO can also be seen toward IRAS 4C, which is more compact. The red and blue wings trace the red- and blueshifted outflow activity from both IRAS 4A and IRAS 4B, but there is no such signature from IRAS 4C at these velocities. In the same plot a fourth source of emission is also revealed toward the southwest of IRAS 4A, which we call IRAS 4-SWC (southwest clump) in this work.
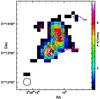 |
Fig. 2 Integrated intensity map (core; from +5 to +10 km s-1) of H2CO 51,5–41,4 in colors, overplotted with its blue (from −5 to +5 km s-1) and red (from +10 to +17 km s-1) wing emission in blue and red contours, respectively. H2CO peaks toward IRAS 4B and shows a weak emission toward IRAS 4C, but is not connected to outflows. Note also the small peak to the southwest of IRAS 4A. The red and blue contour levels are set to 10, 30, 50, 70, and 100 × rms (rms: 0.02 K). |
The detected species (Tables A.1–A.3) are divided into two groups. One group is characterized by narrow line profiles (FWHM~ 1−5 km s-1) and compact spatial distribution (~15−20′′) and is therefore suggested to arise in the quiescent envelope (e.g., C17O, HCO+, H2CS, and N2H+). The other group is characterized by broad line profiles (FWHM~ 8−16 km s-1) and extended emission (~40′′−1′) and is therefore suggested to trace dynamical processes such as outflows (e.g., CO, HCN, CH3OH, and H2CO).
Figure 3 shows the C17O integrated intensity map (from +5 to +9 km s-1) tracing the quiescent gas overplotted with the red (from +10 to +25 km s-1) and blue (from −10 to +4 km s-1) wings of the HCN 4−3 line profiles tracing the activity shifted from the LSR velocity (the signature of an outflow).
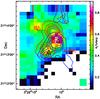 |
Fig. 3 Integrated intensity map (core; from +5 to +9 km s-1) of C17O 3−2 in colors, overplotted with the HCN 4−3 contours tracing outflow activity, namely red wing (from +10 to +25 km s-1) in red contours and blue wing (from −10 to +4 km s-1) emission in blue contours. The plot shows the bipolar outflows driven by IRAS 4A and IRAS 4B Class 0 objects. We do not see such activity toward IRAS 4C. C17O is stronger toward IRAS 4C than toward IRAS 4B. The red and blue contour levels are set to 10, 30, 50, 70, and 100 × rms (rms: 0.02 K). The contours at the top arise because the map is noisier toward the edges. |
The IRAS 4A and IRAS 4B Class 0 objects both drive bipolar outflows that were first detected in CO and CS by Blake et al. (1995) and a few years later in millimeter transitions of SiO by Lefloch et al. (1998). The strong bipolar collimated outflow driven by IRAS 4A is also shown in Fig. 4, where IRAS 4B shows a compact outflow and IRAS 4C does not show a bipolar outflow, but a cone-like structure to the east of IRAS 4C. The continuum emission and the starting point of the cone show an east offset of 14′′, and because IRAS 4C is the closest source, it might be associated with it, but this is not clear from our observations. A water maser was reported by single-dish observations near IRAS 4C by Haschick et al. (1980), which might indicate an outflow. However, several following interferometric surveys did not detect associated maser emission at the reported position (Rodríguez et al. 2002; Furuya et al. 2003; Park & Choi 2007). Figure 1 presented by Park & Choi (2007) shows that the previously reported H2O maser is ~25′′ to the north of IRAS 4A and west of IRAS 4C and follows the distribution of the well-known outflow activity from IRAS 4A. This is an indication that this maser is not connected to IRAS 4C in reality.
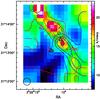 |
Fig. 4 Integrated intensity map (core; from +5 to +9 km s-1) of CO 3−2 in colors, overplotted with the red wing (from +10 to +25 km s-1) emission (red contours) and blue wing (from −10 to +4 km s-1) emission in blue contours. The plot clearly shows the strong bipolar outflow driven by the IRAS 4A Class 0 object. The red and blue contours levels are set to 100, 300, 500, and 800 × rms (rms: 0.02 K). |
Our CO maps are very similar to those presented by Yıldız et al. (2012), where the 6−5 transition is also included. IRAS 4A is a binary system (Looney et al. 2000) with a separation of 1.8″ (420 AU at a distance of 235 pc) and it is characterized by two outflows with different directions. The strongest outflow seen in CO is in the NE-SW direction, while other tracers such as H2CO (Fig. 2) show a more compact emission on the N-S axis. Similar findings have been presented by Santangelo et al. (2015). The binary nature of IRAS 4A could explain these two different outflow morphologies observed in different tracers.
Figure 5 shows the SiO integrated intensity map in the full range from −11 to +23 km s-1. The peak of this emission is northeast of IRAS 4A, following the redshifted outflow activity from IRAS 4A as traced with methanol (CH3OH, Fig. 5). The spatial distribution of SiO follows the same pattern as the spatial distribution of the extracted outflow activity from CH3OH. SiO traces even more energetic processes such as shocks (Duarte-Cabral et al. 2014). In these tracers IRAS 4C is absent, which may be an indication of less energetic outflow activity.
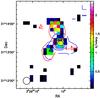 |
Fig. 5 Integrated intensity map (from −11 to +23 km s-1) of SiO 8−7 in colors, overplotted with the blue (from −5 to +5 km s-1) and red (from +9 to +15 km s-1) wing emission from CH3OH 7−1,7–6−1,6 in blue and red contours, respectively. The SiO peaks north of IRAS 4A close to the peak redshifted emission of CH3OH and traces the shock activity in the region. No emission connected to IRAS 4C is observed. The red and blue contour levels are set to 5, 30, 50, 70, 100, and 150 × rms (rms: 0.02 K). |
N2H+ traces the distribution of the protostellar envelope and the gas surrounding the protostars very well, without emission from the IRAS 4-SWC source (Fig. 6). The same figure shows that H2D+ is anticorrelated with the protostar positions, showing emission parallel to the IRAS 4A-4B direction. This covers a part of the area where the DCO+ emission is extended. Deuterated species have been found to trace the coldest regions of gas, especially H2D+, whose main destroyer (CO) is frozen out in the grains (Crapsi et al. 2005b; Caselli et al. 1999). The distribution of H2D+ points toward a colder layer of gas that could explain the enhanced deuterated species.
The species that were detected in all three sources include HCN, HNC, HCO+, H13CO+, DCO+, N2H+, CO, 13CO, C17O, H2CO C2H, CN, and CS. IRAS 4C shows significantly fewer transitions of these species, which are weaker by factors of 2 to 5 than in IRAS 4A and IRAS 4B (Fig. 1). The absorption features at 331.2, 358.8, 359.7, 358.9, and 359.6 GHz cannot be identified. They are very broad (FWHM~ 75 km s-1) and are found at the edges of some datacubes, which most likely means that they are artifacts.
CH3OH lines with upper energy levels Eup> 35 K are missing from the spectrum of IRAS 4C, while the spectrum of IRAS 4A and IRAS 4B shows CH3OH lines with Eup up to 250 K. This trend is similar for the observed H2CO lines toward the three sources. IRAS 4C does not show any associated SiO emission. H2D+ does not really peak toward any of the sources, but its spatial distribution reveals that it covers the space between them (Fig. 6). A weak emission of 0.08 ± 0.03 K (<3 rms) is observed toward IRAS 4C, but not toward the other sources. Some isotopologs such as H13CN, H213CO, and C34S, and deuterated species such as D2CO and HDCO are also not detected in the spectrum of IRAS 4C (see Sect. 2 for noise levels), while they are present in the spectrum of IRAS 4A and IRAS 4B.
The new source, IRAS 4-SWC, is present in multiple observations including our maps of CH3OH and H2CO for Eup< 60 K (RA = 03:29:08.6, Dec = 31:13:12.6 (J2000)). We aim to clarify the nature of the IRAS 4-SWC emission. If it is result of a separate dense core (prestellar or protostellar), then we would expect a compact detection in continuum observations. Prestellar cores are typically detected in (sub-)millimeter dust continuum emission, in absorption at mid- and far-infrared wavelengths (Bacmann et al. 2000), and often show evidence of infall motions (Gregersen & Evans 2000). A protostar, on the other hand, is associated with compact radio or centimeter continuum source accompanied with molecular outflows (i.e., CO), and/or evidence of an internal heating source (e.g. near- or mid-infrared emission). IRAS 4-SWC is not seen in mid- and far-infrared wavelengths as compact emission (e.g., SCUBA, Spitzer; Sandell & Knee 2001) or in absorption. Dense cores of 0.3 M⊙ at similar distances in Perseus are found to show a peak flux density of ~100 mJy/beam at 1.1 mm (σ~ 15 mJy/beam) after adopting a temperature of 15 K, which is the value we determined for IRAS 4-SWC (Enoch et al. 2008). Given the lack of the predicted emission, we conclude that IRAS 4-SWC is not a separate dense core. The fact that IRAS 4-SWC is mainly present only in outflow tracers (e.g., CH3OH, SO) suggests that it could be an internal shock at a position of enhanced density in the IRAS 4A outflow.
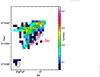 |
Fig. 6 Integrated intensity map (from +5 to +9 km s-1) of H2D+ 11,0–11,1 in colors, overplotted with N2H+ 4−3 in blue contours and DCO+ 5−4 in red contours. The blue contours are set to 5, 20, 30, and 40 × rms (rms: 0.02 K), and the red contours are set to 3, 5, and 8 × rms (rms: 0.03 K). |
3.2. Line profiles
Figures 7–9 show representative examples of the observed line profiles toward IRAS 4A, IRAS 4B, and IRAS 4C. In most cases, IRAS 4C shows narrow lines that can be fitted with a single Gaussian (<2 km s-1) and are 2 to 5 times weaker than the other two sources (Tables A.1–A.3). There are only few exceptions, for example, C17O, which is twice stronger toward IRAS 4C than IRAS 4B and has about the same intensity as toward IRAS 4A. Shah & Wootten (2001) also reported narrow lines toward IRAS 4C (NH3; 1.4 km s-1).
The majority of the lines toward IRAS 4A and IRAS 4B can be fitted by two Gaussian components, a narrow (1−3 km s-1) and a broad (5−12 km s-1) with the broadest toward IRAS 4A tracing outflow activity. We observe 5 to 10 times broader lines in IRAS 4A and IRAS 4B than in IRAS 4C. The fact that the line profiles from IRAS 4C do not show any signature of a broader outflow component (e.g. Fig. 7) argues against an outflow along the line of sight. In the alternative case of an outflow in the plane of the sky, we would expect to observe lobes related to the outflow in the CO maps, which is not the case (Sect. 3.1). The cone-like structure observed in Fig. 4 to the east of IRAS 4C could be a single lobe of an outflow from IRAS 4C, which is the nearest source. If IRAS 4C is at the same distance as IRAS 4A, then it is possible that the stronger, more powerful outflow from IRAS 4A would drag the west outflow lobe from IRAS 4C with it, resulting in mixing of the two outflows. This scenario would explain the missing outflow signatures in the line profiles of IRAS 4C for the extreme case that its outflow is located exactly in the plane of the sky, but the fact that the cone does not have its origin exactly in the continuum emission remains puzzling.
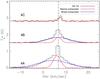 |
Fig. 7 Gaussian fit of a broad and a narrow component of CS 7−6 toward IRAS 4A, IRAS 4B, and IRAS 4C (bottom to top). Dense gas tracers such as CS 7−6 do not show absorption, but do show differences in line widths and strengths between the Class 0 objects IRAS 4A, IRAS 4B, and the IRAS 4C (single component). |
The absence of outflow signatures toward IRAS 4C could be a result of its evolutionary status. Broad velocity flows weaken as the core evolves (i.e., from Class 0 to Class I; Arce et al. 2007), which results in less clear spectral line evidence of the flows. In particular, the outflow momentum reduces from ~10-2M⊙ km s-1 to ~10-3M⊙ km s-1, as we move to more evolved stages (Machida & Hosokawa 2013). Outflows are also weaker in very early stages, in particular in the transition from a prestellar core to a Class 0 protostar, also resulting in less broad lines, owing to the lower masses involved in turbulence and/or infall. Thus the absence of outflow signatures towards IRAS 4C could mean either an earlier or a later evolutionary stage of the source compared to IRAS 4A and IRAS 4B. Orientation effects and/or mass may also play a crucial role in the observed differences.
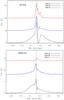 |
Fig. 8 CO and HCN line profiles for IRAS 4A, IRAS 4B, and IRAS 4C (bottom to top). Note the absorption toward all positions. IRAS 4A shows a broad wing component, followed by IRAS 4B, but IRAS 4C shows a steep line profile and only a very narrow red wing in both CO and HCN. The heavy absorption toward IRAS 4C makes it difficult to fit accurate Gaussians. The vertical line at +6.7 km s-1 indicates the ambient velocity of IRAS 4A and 4B. |
Figure 8 presents the line profiles of HCN and CO. HCN shows an absorption feature toward IRAS 4A and IRAS 4B, but not toward IRAS 4C, while CO shows absorption features in all sources. We observe a velocity offset of ~1 km s-1 between the peak intensities of IRAS 4A and IRAS 4B (+6.7 km s-1) and IRAS 4C (+8 km s-1). The absorption features can be interpreted as infall motions toward IRAS 4A and IRAS 4B, which appear as inverse P-cygni profiles. In that case, IRAS 4C does not show infall. Another possible explanation for the observed absorption is that there is a foreground gas and IRAS 4C is part of this foreground. The fact that the absorption of both sources appears at a similar velocity with the peak intensities of IRAS 4C favors the foreground scenario, however.
Figure 9 shows examples of H2CO and CH3OH line profiles toward the three sources. The 1.5 to 2.5 times weaker emission of the H2CO and CH3OH transitions toward the IRAS 4C source in comparison with the other two sources is striking. We do not detect H2CO transitions with Eup> 65 K toward IRAS 4C. For the methanol (CH3OH) lines, IRAS 4B shows the strongest emission of the sources for all observed transitions, while IRAS 4A shows about twice weaker emission, but 1.5 to 2 times broader lines than IRAS 4B. IRAS 4C only shows CH3OH transitions with Eup< 35 K. The methanol lines toward IRAS 4B show a red wing ~7 km s-1 at lower energies (Eup< 100 K), which is indicative of an outflow activity and mostly a single component at higher energies (100 K <Eup< 200 K), which possibly arises in the dense quiescent parts of the protostellar envelope. The red wing at lower energies and the absence of a blue component could be a result of absorption due to a dense, expanding, inner envelope. The methanol lines appear stronger in peak intensity toward IRAS 4B, indicating a higher abundance, while in IRAS 4A the wings are broader and show a blue shifted wing, indicating faster or stronger outflows. The formaldehyde lines follow the same pattern (Fig. 9).
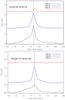 |
Fig. 9 Profiles of formaldehyde (top) and methanol (bottom) lines as observed toward the three sources IRAS 4A, IRAS 4B, and IRAS 4C. IRAS 4C is present at the lower transitions where IRAS 4A is the strongest peak. At higher transitions IRAS 4B is the strongest peak. In all cases IRAS 4A shows the broadest profile of the three sources. |
C2H is one of the few species that show the strongest emission toward IRAS 4C (Fig. 10). This species is thought to trace early stages of massive star formation (Beuther et al. 2008). However, Sakai et al. (2010) reported very bright C2H toward the low-mass late Class 0 source L 1527. More likely, the presence or absence of a particular species may signify some different chemistry rather than the final mass of a protostar, while for individual lines, excitation effects may play a role.
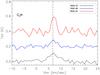 |
Fig. 10 Line profiles of C2H (N = 4−3, J = 9/2−7/2, F = 4−3) toward IRAS 4A, IRAS 4B, and IRAS 4C (bottom to top). C2H is stronger toward IRAS 4C. The intensity of the other two lines are comparable, but IRAS 4A shows a broader profile. The vertical line represents the ambient velocity of IRAS 4A and 4B at +6.7 km s-1. |
3.3. Velocity structure
The velocity distribution maps of several species (e.g., SO; Fig. 11) clearly show that although the peaks for IRAS 4A and IRAS 4B appear at a similar velocity (+6.7 km s-1), IRAS 4C and its surrounding area peak at a velocity higher by about 1 km s-1 (+7.9 km s-1).
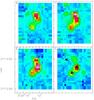 |
Fig. 11 Channel maps of SO 9(8)−8(7) obtained with the JCMT, with the central velocities given in km s-1. The emission from IRAS 4C appears at higher velocity channels (from +7 to +8 km s-1), while IRAS 4-SWC is observed at lower velocity channel (+5.6 km s-1). The peak north of IRAS 4A at about +7 km s-1 can be associated with an outflow or shock from IRAS 4A. |
IRAS 4-SWC peaks at a velocity lower by about 1 km s-1 (+5.6 km s-1), which indicates an overall velocity gradient in the NE-SW direction (ΔV~ 2.5 km s-1), probably due to the structure of the ambient cloud. NGC 1333 is characterized mostly by the +8 km s-1 velocity component, and it has been suggested that the IRAS 4 core (+6.7 km s-1) is a smaller embedded cloud with a different velocity (Choi et al. 2004; Langer et al. 1996). The observed HCN absorption toward IRAS 4A and IRAS 4B at +7.84 km s-1 (Fig. 8) is at a very similar velocity as the peak velocity (~8 km s-1) of almost all the observed lines toward IRAS 4C (Table A.3). This coincidence could indicate that IRAS 4C might not be a member of the IRAS 4 cloud, but is located in the foreground. Although the observed differences may lead to question the membership of IRAS 4C in the IRAS 4 cloud, they are small enough to conclude that IRAS 4C is not at a significantly different distance compared to the other two objects.
3.4. Interferometric continuum and line emission
Our CARMA continuum observations at 1.3 mm reveal the dust emission from IRAS 4C, which appears to trace a compact region (Fig. 12). A 2D Gaussian fit of this emission gives a deconvolved component size with a FWHM of 1.79′′× 1.35′′ (420 × 320 AU). The observed peak flux density of the continuum observations is 51 mJy/beam with a rms of ~ 3 mJy. Tobin et al. (2015) had a resolution higher by about three times, which consequently resulted in a smaller deconvolved size with a FWHM of 0.51′′× 0.22′′ (120 × 52 AU). Di Francesco et al. (2001), using IRAM PdBI (Beam FWHM: 2′′× 1.7′′) toward IRAS 4A and IRAS 4B, reported a deconvolved size of 920 × 720 AU and 600 × 560 AU, respectively. The reported differences are a result of the different angular resolutions of the studies.
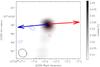 |
Fig. 12 CARMA continuum observations of NGC 1333/IRAS 4C at 1.3 mm (grayscale) overplotted with the red and blue wings of 13CO 2−1. The velocity range of the line is between +5 and +11 km s-1, and a siginificant part of the emission has been resolved out by the interferometer at the source velocity, while we still detect emission from the wings. The peaks of the blue (from +5 to +6.5 km s-1) and red (from +8.5 to +11 km s-1) wing show a small offset compared to the peak intensity of the continuum. The blue contours levels are set to 0.04, 0.06, 0.08, 0.10, and 0.13 Jy/beam (rms ~ 0.014 Jy/beam) and the red at 0.06, 0.09, 0.12, 0.15, and 0.18 Jy/beam (rms ~ 0.02 Jy/beam). The ellipse shows the beam size and shape at this wavelength (2.12″× 1.81″). The arrows represent the direction of blue- and redshifted outflow components (Tobin et al. 2015). |
The 2–1 transitions of CO, 13CO and C18O have also been detected in our CARMA data. The integrated intensity peaks of the blue (from +5 to +6.5 km s-1) and red (from +8.5 to +11 km s-1) wing of 13CO show a small offset (<1′′) compared to the peak intensity of the continuum (Fig. 12), with the blue to be in similar direction with the outflow, as indicated by Spitzer observations (further discussion in Sect. 4.1). The CO and 13CO lines show strong absorption at source velocities (~+8 km s-1) possibly as a result of resolved-out emission by the interferometer, while C18O shows only narrow emission with a FWHM of 1.7 ± 0.2 km s-1 at +7.9 ± 0.1 km s-1 (Fig. 13). Similar velocity offsets are observed also with our JCMT data (e.g., Fig. 7).
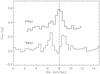 |
Fig. 13 CO isotopologs as observed with CARMA toward NGC 1333/IRAS 4C. 13CO shows a broader profile, and a significant part of the emission has possibly been resolved out by the interferometer, while C18O shows only narrow emission. The vertical line at +8 km s-1 is the velocity of the C18O peak. The plotted flux offset between the lines has been chosen to facilitate comparison. 12CO is not shown because it is heavily affected by absorption, which makes using it very difficult. |
We obtain a ~7σ detection of N2D+ near IRAS 4C, which has been previously observed toward all three sources (single dish; Friesen et al. 2013). Our maps reveal an offset between the continuum source and the N2D+ emission of 8.5″, which corresponds to 1900 AU (Fig. 14). An offset of up to 2000 AU between N2H+ 1−0 that traces the envelopes of the protostars and the N2D+ 2−1 and 3−2 has previously been reported by Tobin et al. (2013) toward eight protostellar objects and by Lee et al. (2015) towards three protostars in Perseus. N2D+ is expected to arise from environments where CO is depleted. Our finding suggests that this occurs in a region that is offset from the dense core.
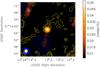 |
Fig. 14 Continuum emission toward IRAS 4C in colors, overplotted with the N2D+ 3−2 emission with blue contours at 0.45, 0.6, 0.7, 0.8, and 0.95 Jy/beam (rms ~ 15 mJy/beam) and with the C18O 2−1 emission with yellow contours at 0.04, 0.08, 0.10, 0.14, 0.20, and 0.29 Jy/beam (rms ~ 14 mJy/beam). We observe an offset between the continuum source and the N2D+ of 8.5′′. The beam sizes of the continuum (yellow) and the lines (blue) are also plotted in the bottom left corner. |
4. Evolutionary constraints
In our attempt to distinguish the evolutionary status of the three sources, we mainly studied the properties of the outflows, which are found to have speeds of 10−20 km s-1 (Arce & Sargent 2006) for Class 0 objects and a maximum of 3 km s-1 for an FHSC (Machida et al. 2008; Tomida et al. 2010), the temperature of the sources, which increases as a protostar evolves, and the deuterium fractionation, which can be used as a chemical clock (Belloche et al. 2006; Fontani et al. 2011, 2014).
4.1. Properties of the outflows
We have mapped the NGC 1333 IRAS 4 region in CO 3−2 (JCMT; Fig. 4). The spectra show a deeply self-absorbed line toward all the three sources, broad wings toward IRAS 4A (FWHM~ 22.0 ± 2 km s-1) and IRAS 4B (FWHM~ 15.0 ± 1 km s-1), and a weak red wing signature from IRAS 4C (FWHM~ 5.0 ± 0.4 km s-1). The accurate fitting with Gaussians is difficult because of the heavy absorption, especially toward IRAS 4C, which shows a much narrower line profile (Fig. 8). Our 13CO 3−2 JCMT line profiles can be fitted well with a single narrow component th a FWHM of ~1.9 ± 0.1 km s-1 toward IRAS 4C, however, while IRAS 4A can be fitted with a two-component Gaussian, a narrow one with a FWHM of ~2.0 ± 0.1 km s-1, and a broad one with a FWHM of ~10.0 ± 2 km s-1. The line profile of IRAS 4B can also be fitted with only a single component with a FWHM of ~2.4 ± 0.1 km s-1.
To search for compact outflows, which single-dish observations may not pick up, high-resolution interferometric CO or H2O observations toward protostellar cores are required (CARMA; Fig. 12).
13CO (J = 2−1) traces the low-velocity outflow in most class 0 protostars (Arce & Sargent 2006), but has also been observed in the inner envelope and the disk of extremely young protostars (e.g., L1527 IRS). To search for an outflow toward IRAS 4C, we used the 13CO line and integrated the velocities of the emission excluding the lack of emission that is possibly due to the spatial filtering by the interferometer from +6.5 km s-1 to +8.5 km s-1 (Fig. 13). We obtained a narrow velocity range from +5 to +6.5 km s-1 for the blueshifted emission and from +8.5 to +11 km s-1 for the redshifted emission, and we observed a smaller offset than in the dust continuum emission, indicating a potential low-velocity outflow (Fig. 12). We found an offset to the blue and red component of 13CO that corresponds to a PA of ~29 deg, while Tobin et al. (2015) found a PA of ~−21 deg for C18O 2−1 using the B- and C-array CARMA configuration. In that work, this offset is interpreted as a potential rotation signature, but because of the poor signal-to-noise ratio (S/N), a Keplerian rotation could not be tested. A VLA 8 mm image of IRAS 4C at ~0.08″ resolution also shows a dust emission connected to a disk structure and not an outflow (Segura-Cox et al., priv. comm.). Spitzer data have revealed nebulosity showing a scattered light cone, whose origin is at the location of the protostar (e.g., Fig. 19; Tobin et al. 2015). Thus the most likely direction of the outflow is orthogonal to the plane of the disk. This is not the direction that our 13CO shows, and we measure an offset ~50 deg between our 13CO and the C18O, which indicates that the two isotopologs do not trace exactly the same gas.
We measure ΔV= 1.5 km s-1 for the blueshifted emission and ΔV= 2.5 km s-1 for the red shifted emission. Some amount of the wing emission might also have been resolved out by the interferometer. Still, the observed velocity range for the potential outflow is very narrow, indicating at best a very slow outflow (~2 km s-1).
The characteristic outflow velocity Vobs that we measure provides a lower limit that can be corrected to the real flow velocity Vflow if the inclination angle i is known, using 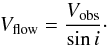 (2)Following the suggestion from Tobin et al. (2015) that IRAS 4C contains a disk nearly at edge-on inclination, which corresponds to an outflow inclination angle of <10°, by adopting an angle of 5°, we derive velocities of up to 17 km s-1 for the blueshifted emission and of up to 28 km s-1 for the redshifted emission. This is an order of magnitude higher than the measured velocities. In this case, we can explain the narrow lines, but we cannot explain why the outflow is not spatially visible in our larger JCMT maps (Fig. 4). We cannot exclude the scenario that our 13CO emission traces the disk and not the outflow, as suggested by Tobin et al. (2015).
At the same time, IRAS 4B shows a compact outflow with an inclination close to 90° (Maret et al. 2009), which means that it is almost perpendicular to the plane of the sky and the observed velocity is the highest possible. The morphology of the IRAS 4A outflow indicates an inclination close to 20°, which means that the observed velocities are underestimated by about a factor of 3. The inclination of the two outflows has been calculated before using the masers associated with them, which provided proper motion and radial velocity measurements (Marvel et al. 2008). Marvel and colleagues found the maser outflows to be nearly in the plane of the sky (2° for IRAS 4A, 13° for IRAS 4B), with the IRAS 4B estimate being more uncertain. Although in the studies mentioned above the inclination of IRAS 4B varies strongly, in each case IRAS 4A appears to drive the most powerful outflow close to the plane of sky, which is thus underestimated. The outflow velocities of IRAS 4A are at least 4 times higher than those of IRAS 4B, which may indicate that IRAS 4A is a less evolved source than IRAS 4B. We recall that 4A is a binary, however. In particular, there is evidence that the source to the NW (A2) has masers, while the source to the SE (A1) does not have masers (e.g., Park & Choi 2007). The H2O masers require warm dense shocked gas (Elitzur et al. 1992), and mainly disks and outflows in YSOs fulfil these criteria. This means that A2 is probably more evolved than the A1 source to the SE.
4.2. Mean envelope temperature
The determination of the temperature is another crucial parameter that we used to distinguish between the different evolutionary stages of objects with the same luminosity. We derived the kinetic temperature of the IRAS 4 region using the H2CO lines, which have been found to be good tracers of kinetic temperatures. We used the most recent collisional rate coefficients as derived by Wiesenfeld & Faure (2013) and the Einstein coefficients from the JPL database (Pickett et al. 1998).
We used the non-LTE radiative transfer program RADEX (van der Tak et al. 2007) to compare the observed integrated intensity fluxes with a grid of models for deriving kinetic temperatures. For the model input we used the molecular data from the LAMDA database (Schöier et al. 2005). RADEX predicts line intensities of several molecular transitions for a given set of parameters: kinetic temperature, column density, H2 density, background temperature, and line width.
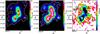 |
Fig. 15 Kinetic temperature map of NGC 1333 IRAS 4 (left). During the fitting procedure all the seven H2CO detected lines are taken into account for the positions with S/N> 3. The white contour shows the region where at least two lines were detected with S/N> 3. The kinetic temperature is higher toward the Class 0 objects IRAS 4A (~ 45 K) and IRAS 4B (~ 80 K), while it is significantly lower toward IRAS 4C (~ 12 K). We also note the compact emission toward IRAS 4-SWC (~ 15 K), which has been observed in channel maps of other molecules (e.g., CH3OH, and SO, Fig. 11). The tau map of H2CO 50,5–40,4 presents values in the optically thin regime throughout the cloud (middle; ~0.1−0.7). The best resulting χ2 varies between ~1−5 in the region of the sources (right). |
We performed a χ2 minimization to fit all the observed o-H2CO and p-H2CO fluxes simultaneously (up to seven lines, Table A.1), using 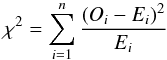 (3)integrated over the velocity range from +5 to +9 km s-1, which corresponds to the narrow emission. In this way, we tried to limit the contribution of the outflows and performed the analysis under the assumption that we traced the same gas. The χ2 (Eq. (3)) was computed as the quadratic sum of the differences between the observed (Oi) and the synthetic (Ei) line intensities for a range of kinetic temperatures (7 K <Tkin< 120 K), a column density of 2 × 1014 cm-2, and a H2 density of 3 × 105 cm-3. These volume and column densities have been obtained from the analysis by Maret et al. (2004) toward IRAS 4A and IRAS 4B, which is based on data at similar angular resolution as ours (JCMT, IRAM; 9−17″Maret et al. 2004). Adopting these values for the entire cloud suffers from uncertainties (see below) since it is expected that the rest of the cloud is most likely characterized by lower densities. In addition, the temperature of the background radiation field (CMB) is set to 2.73 K and the line width to 1.8 km s-1, which approximates the value that we have measured throughout the cloud for the narrow component. Finally, in our calculations we assumed a fixed ortho-to-para ratio of o-H2CO/p-H2CO = 3 and e-CH3OH/a-CH3OH of 1.
Figure 15 presents the kinetic temperatures of our modeling results, which vary between ~ 8−80 K, with the highest value stemming from IRAS 4B. The map shows several local peaks with the global one toward IRAS 4B. Core IRAS 4A is not a temperature peak, but the map instead shows two peaks northeast (~15′′) and southeast (~5′′) of IRAS 4A (~ 60 K). The gas that surrounds IRAS 4A and IRAS 4B is characterized by Tkin~ 15−30 K. Two weaker local peaks are observed toward the IRAS 4A and IRAS 4-SWC positions. Figure 15 presents the map of the H2CO 50,5–40,4 optical depth, which corresponds to the optically thin regime (~0.1−0.65), and the best fit χ2, which is lowest (~1) toward IRAS 4A and the surrounding gas. Interestingly, the τ map peaks at the position of IRAS 4A, while the Tkin map peaks at IRAS 4B. Only IRAS 4C is detected as a local peak in both the optical depth (i.e., column density) and kinetic temperature. The τ map also shows the two distinctive peaks toward IRAS 4A and IRAS 4B, and its entire distribution follows the morphology of the kinetic temperature map.
Our kinetic temperature estimates toward the Class 0 objects IRAS 4A and IRAS 4B are 45 K and 80 K, respectively, but the estimate is lower toward IRAS 4C (~ 12 K). Deutero-ammonia observations presented in Shah & Wootten (2001) also indicate very cold conditions toward IRAS 4C (15 K). IRAS 4-SWC is characterized by a kinetic temperature of ~15 K, which may be a result of an internal shock connected to the outflow of IRAS 4A or a separate core, as discussed in Sect. 3.1.
Maret et al. (2004) had performed a H2CO study toward a sample of eight low-mass protostars, including IRAS 4A and IRAS 4B. The collisional rate coefficients that were used in this study were taken from Green (1991). Our results are in excellent agreement with those Maret et al. (2004) reported (50 K for IRAS 4A; 80 K for IRAS 4B), especially given the different observations and collision rates used. In their analysis they used pointed observations toward IRAS 4A and IRAS 4B, therefore no analysis was performed toward IRAS 4C, and their H2CO observations were taken from IRAM and JCMT, allowing them to measure more lines but at different angular resolutions.
To gain a sense of the uncertainties in the above calculations, we ran additional models for IRAS 4A and IRAS 4B, where most lines were detected. For these models we varied the column density between 2 × 1012 cm-2 and 2 × 1016 cm-2. We found a best fit column density of 5 × 1014 cm-2 for IRAS 4A and 3 × 1014 cm-2 for IRAS 4B, which is 2.5 and 1.5 times higher than the previously adopted value of 2 × 1014 cm-2, but within the same order of magnitude. These values result in temperatures of 30 K for IRAS 4A and 64 K for IRAS 4B, which is 1.5 and 1.2 times lower than the values we obtained above. IRAS 4B remains warmer than IRAS 4A, while their absolute temperature difference remains at ~35 K, which highlights the temperature difference of the two systems.
Since we do not have a way to accurately measure the column density of IRAS 4C and because the other two sources were found to have a higher column density than adopted, we ran RADEX for IRAS 4C for a higher N(H2CO) adopting a value of 1.5 times higher than before, 3 × 1014 cm-2. The increase in column density results in a kinetic temperature of ~8 K, which is lower by 4 K than our previous estimate and confirms that IRAS 4C is the colder of the sources. We also ran our calculations for a 1.5 times lower column density using 7.5 × 1013 cm-2, which resulted in a temperature of ~18 K and is 1.7 times higher than what we obtained in our analysis. Even in this case, IRAS 4C remains the coldest of the sources, with absolute differences of ~20 K and ~40 K to IRAS 4A and IRAS 4B, respectively.
To test the assumption of constant volume density in our analysis, we repeated our calculations for nH2= 106 cm-3 and 104 cm-3 for the entire cloud. The lower value of 104 cm-3 was adopted because the cloud around the compact objects is most likely characterized by lower densities. In both cases the distribution of the kinetic temperature is the same as in Fig. 15, but the values vary. For the higher density the temperature is characterized by significantly lower values (7 K <Tkin< 22 K). IRAS 4B is again the warmest (~20 K), followed by IRAS 4A (~16 K) and IRAS 4C (~8 K). For the lower density the cloud is characterized by temperatures 20 K <Tkin< 82 K, resulting in ~ 60 K for IRAS 4B, ~ 35 K for IRAS 4A, and ~ 16 K for IRAS 4C. This result indicates that our solution is more sensitive to higher densities, which leads to an overestimation of temperatures for IRAS 4A and IRAS 4C at the adopted nH2= 3 × 105 cm-3, since they were found to be denser in our approach, as described in Sect. 4.3. Although the absolute values for kinetic temperatures vary with the different assumptions, IRAS 4B remains the warmest and IRAS 4C the coldest of the three sources in all our calculations.
4.3. Mass and density
We used our CARMA continuum observations to estimate the gas mass (Eq. (4)) and the H2 column (Eq. (5)) and volume density of IRAS 4C. We calculated these parameters by 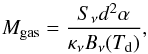 (4)where Sν= 0.061 Jy is the total flux density after fitting a 2D Gaussian of 2.3′′× 2.1′′, α= 100 is the gas-to-dust ratio, κν(1.3 mm) = 0.89 cm2 g-1 is the dust opacity per unit mass (Ossenkopf & Henning 1994), and Bν(Td) is the Planck function at dust temperature Td (~12 K; H2CO analysis described in Sect. 4.2). We found a Mgas= 0.16 M⊙. We adopted a distance d of 235 pc. We calculated the column density using
 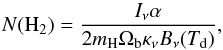 (5)where Iν is the peak flux density (0.048 Jy/beam), mH is the mass of hydrogen, and Ωb is the beam solid angle. The resulting N(H2) = 1.5 × 1024 cm-2, while the volume density, assuming a 2″ diameter for the adopted area as determined by a 2D Gaussian fit, is ~3.1 × 108 cm-3. This value is higher by three orders of magnitude than the values obtained by Maret et al. (2004) for IRAS 4A and IRAS 4B (3 × 105 cm-3) and the one we have adopted for IRAS 4C for our H2CO analysis (3 × 105 cm-3; Sect. 4.2) under the assumption that the three sources are characterized by similar volume densities, but the scales are different since the CARMA beam is ~10× smaller and thus traces a denser region.
Smith et al. (2000) derived masses of 10.9 M⊙ for IRAS 4A, 6.9 M⊙ for IRAS 4B, and 2.9 M⊙ for IRAS 4C using the SCUBA 850 μm continuum map of NGC 1333/IRAS 4, with a FWHM of the beam ~16″ and assuming the same temperature (30 K) for the three sources. The authors considered the CO 3−2 line contamination in the 850 μm SCUBA passband, as a possible cause of an underestimation of the calculated spectral index and overestimation of the masses, but it could still not explain the low spectral indices observed toward the three sources.
The mass of IRAS 4C that we obtain is about an order of magnitude lower, but the CARMA beam is ~10 times smaller. In addition, we used the most recent distance estimate of 235 pc (Hirota et al. 2008), compared to their distance of 350 pc (Herbig & Jones 1983). Correcting for the distance and the temperature and using their reported values for the total and peak flux density and their angular resolution, we found a volume density of 6 × 106 cm-3, which is about two orders of magnitude lower than the one obtained from the CARMA data and provides evidence of a density gradient at IRAS 4C. We followed the same process for IRAS 4A and IRAS 4B using a FWHM~ 25″ as a result of the Gaussian fit, and we measured the values of 2 × 106 cm-3 for IRAS 4A and 5 × 105 cm-3 for IRAS 4B. We found that IRAS 4C is three times denser than IRAS 4A, and IRAS 4A is four times denser than IRAS 4B. Since our CARMA observations do not cover IRAS 4A and IRAS 4B, we cannot further investigate possible density gradients.
Last, for a direct comparison, we determined the masses of the sources in a resolution similar to our JCMT maps. For this purpose, we used the SCUBA data (Smith et al. 2000), adopting the more recent distance of 235 pc and the temperatures we derived in Sect. 4.2. We calculated masses (Eq. (4)) of 2 M⊙ for IRAS 4A, 0.6 M⊙ for IRAS 4B, and 1.5 M⊙ for IRAS 4C. This is the first time that IRAS 4C appears with a higher mass than IRAS 4B because we did not use the same temperatures for all three sources, as previous studies, but the values determined in Sect. 4.2. The derived masses and column densities are very sensitive to the adopted opacity and temperatures, which can cause a difference of up to a factor of 3−5 given the temperature uncertainties discussed above.
4.4. Depletion of CO
Carbon monoxide and its isotopologs are broadly used as a tracer of N(H2) in studies of the interstellar medium. The most abundant, 12CO, can only provide a lower limit of the column density and the mass of the region since it is often optically thick in typical conditions of the molecular clouds. The less abundant isotopologs can then been used (e.g., 13CO and C18O), assuming optically thin emission.
To estimate the spatial distribution of N(CO), we used the C17O 3−2 line, assuming a constant 16O/17O of 2000 (Wilson 1999). We ran RADEX to derive the column density of C17O, using the gas temperature map as determined from the H2CO analysis and a constant volume density of 3 × 105 cm-3. We derived N(CO) for the region where Tpeak> 3 rms to be in the range of 2 × 1017 cm-2–9 × 1017 cm-2 (Fig. 16).
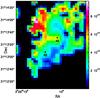 |
Fig. 16 Synthetic CO column density as determined from fitting the peak intensities for the range from +5 to +9 km s-1. |
The higher value is close to IRAS 4C. This is a result of the low kinetic temperature of IRAS 4C compared to the other two sources (~12 K), while the intensity of the C17O line is stronger toward IRAS 4C than toward the warmest IRAS 4B (Fig. 17). To be able to fit the relatively high intensity toward IRAS 4C for this low kinetic temperature, RADEX requires a higher column density because we used a constant volume density.
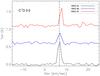 |
Fig. 17 C17O 3–2 line profiles toward IRAS 4A, IRAS 4B, and IRAS 4C. The line is strongest toward IRAS 4A, followed by IRAS 4C and then IRAS 4B. |
To derive the N(CO)/N(H2) for the three sources, we used Eq. (5) and applied the peak flux densities reported by Smith et al. (2000) from the 850 μm continuum. In this way, we ensured that the angular resolution between continuum and CO observations is about the same (HPBW~ 13.5″) and thus that we trace the same amount of gas. For the temperature we used 45 K, 80 K, and 12 K for IRAS 4A, IRAS 4B, and IRAS 4C, respectively, as determined in Sect. 4.2. We found the column density N(H2) toward IRAS 4A, IRAS 4B, and IRAS 4C to be 2.4 × 1023 cm-2, 1.3 × 1023 cm-2, and 3.6 × 1023 cm-2, resulting N(CO)/N(H2) of 2.4 × 10⁻⁶, 3.8 × 10⁻⁶ and 1.2 × 10⁻⁶. These values are ~ 1.5−2 orders of magnitude lower than the canonical [CO]/[H2] of 10-4, indicating significant depletion of CO.
The CO depletion factor, fD, can be calculated by  (6)where XECO is the expected abundance of CO relative to H2 (10-4) and XOCO is the ratio between the observed N(CO) and the observed N(H2).
We determined an fD of 42, 26, and 83 for IRAS 4A, IRAS 4B, and IRAS 4C, respectively. The highest degree of CO depletion is observed toward the coldest of the sources, IRAS 4C, while the lowest degree of CO depletion is detected toward the warmest source, IRAS 4B, as expected (e.g., Bacmann et al. 2002). Our solution is dependent on the assumed parameters, including the resulting kinetic temperature for the three sources and the assumption that H2CO and C17O trace the same gas. As discussed also in Sect. 4.2, IRAS 4C is the coldest of the sources under each assumption, and although the absolute values of depletion factors may vary, the estimated trend between the sources will therefore remain.
4.5. Deuteration
The deuterium fractionation (e.g., [N2D+]/[N2H+]) is another factor from which to estimate the evolutionary stage of IRAS 4C. More specifically, the [N2D+]/[N2H+] can be used as a chemical clock (Belloche et al. 2006; Pagani et al. 2013; Fontani et al. 2014) and has been measured to be ~15−20% for prestellar cores (e.g., L1544) and ~5−10% for Class 0 objects (e.g., L1521F). A measurement between these two limits is an indication for an object whose evolutionary stage lies between these two early star formation stages. The cosmic ratio [D]/[H] = 1.5 × 10⁻⁵ (Linsky et al. 1995), and higher observed values are typical for low-mass dense cores (e.g., Crapsi et al. 2005b; Parise et al. 2006). The reason is that at very low temperatures the reaction H3++ HD ⇐⇒ H2D++ H2+ΔE is driven strongly to the right, increasing the abundance of H2D+, in combination with the undergoing freeze-out of CO, which decreases the H2D+ destruction rate (e.g., prestellar cores Bacmann et al. 2003). This process leads to an enhancement of H2D+, and the D atom passes down to other species, which leads to the formation of more deuterated species such as N2D+. We do not have N2D+ observations toward all the sources, and our N2H+ emission is from JCMT data, which prevents us from determining [N2D+]/[N2H+] for our dataset.
We used RADEX to model the observed emission in HCO+, H13CO+, and DCO+. The collision rates of HCO+ and DCO+ with H2 were adopted from Flower (1999). The critical densities ncr of HCO+ 4−3 and DCO+ 5−4 at 50 K are ~9.1 × 106 cm-3 and ~9.3 × 106 cm-3, calculated based on Schöier et al. (2005).
For this purpose, we used the kinetic temperature map resulting from the H2CO analysis and a constant volume density of 3 × 105 cm-3 for the entire cloud. Fitting the integrated intensities of the lines for each spatial point enabled us to produce the column density maps of H13CO+ and DCO+. We found column densities ofbetween 8 × 10¹²–4 × 1013 cm-2 for H13CO+, with the higher value close to IRAS 4C, and 8 × 10¹³–1.5 × 1014 cm-2 for DCO+. HCO+ is typically optically thick, which we were able to test by determining the observed HCO+ 4−3/H13CO+ 4−3 ratio of the peak intensities for the range of +5 to +9 km s-1 (Fig. 18).
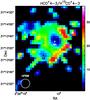 |
Fig. 18 Observed HCO+ 4–3/H13CO+ 4–3 ratio of the peak intensities for the range of +5 to +9 km s-1. The observed ratio takes values between 6 and 37, which is lower than the optically thin ratio of 60 and indicates that the main isotope HCO+ 4−3 is optically thick throughout the cloud. The effect is stronger toward the three embedded objects. |
The observed ratio is found to vary between 6 and 37, which is 10 to 1.5 times lower than the expected ratio of 60 under optically thin conditions, indicating that the main isotope HCO+ 4−3 is moderately optically thick throughout the cloud. The effect is stronger toward the three embedded objects, as expected. For this reason, we produced the [DCO+]/[HCO+] toward the three sources using a fixed isotopic ratio of [HCO+]/[H13CO+] = 60. We repeated our calculations and adopted the volume densities for each source as determined in Sect. 4.3. We determined a deuteration of ~12 ± 2% toward IRAS 4A, ~3.5 ± 1% toward IRAS 4B, and an upper limit of ~20% toward IRAS 4C. The lowest deuteration is detected toward IRAS 4B and is also correlated with the lower degree of depletion toward that source, as we determined in Sect. 4.4. For IRAS 4C the error is an order of magnitude higher than for the other two sources, since at these low temperatures a decrease or increase of temperature by only 5 K causes almost one and a half order of magnitude higher or lower N(DCO+) and N(HCO+), respectively. We would expect that IRAS 4C would show the higher degree of deuteration since it is the coldest of the sources and thus the enhancement of H2D+ abundance contributes to the enhancement of DCO+ through the reaction H2D++ CO =⇒ DCO++ H2. Although we report the highest deuteration toward IRAS 4C, this value is only an upper limit and we cannot conclude regarding its evolutionary status compared to the other two sources only based on their deuteration.
4.6. HCN/HNC
We tested our temperature estimates by using a method that is unconnected to the H2CO lines. The [HCN]/[HNC] ratio has been found to be sensitive to temperature (Schilke et al. 1992), while for cold molecular clouds it is expected to be ~1 (Sarrasin et al. 2010). More precisely, HNC/HCN have been found to be decreasing while the temperature increases, and vice versa (Graninger et al. 2014).
We followed a similar procedure as in Sect. 4.5 using the collisional rate coefficients for HCN and HNC from Dumouchel et al. (2010), scaled by a factor 1.37 to represent collisions with H2. We used the optically thin H13CN and adopted a HCN/H13CN = 60. We present the observed HCN/HNC ratio toward the three sources. We found a ratio of ~3.5 for IRAS 4A and ~4.2 for IRAS 4B. The isotopolog HN13C was not clearly detected, and we therefore assume that HNC is optically thin toward all three positions. None of the rarer isotopologs are observed toward IRAS 4C, therefore we assume that the main isotopologs are optically thin; we found the lowest observed ratio of ~0.85 there.
Our results clearly show the correlation between HCN/HNC and the temperature, since the lowest value corresponds to the colder source (4C) and the highest to the warmer source (4B). We also found more HNC than HCN toward IRAS 4C, where the temperature is as low as ~12 K and HNC emission is expected to be higher than HCN for such low temperatures (Padovani et al. 2011; Graninger et al. 2014).
5. Discussion and conclusions
IRAS 4C has been reported based on continuum observations in various previous works as a Class 0 object (e.g., Enoch et al. 2009). We took advantage of the direct comparison with the other two nearby Class 0 objects, IRAS 4A and IRAS 4B, using single-dish mapping observations as have been obtained during the JCMT line survey. In addition, we reported the mass and the volume density as determined using our CARMA observations.
5.1. Results
We distinguished the evolutionary stage of IRAS 4C from a comparison to the other two Class 0 objects, taking into account the derived physical parameters from our analysis sections, the projection effects, the mass, and the luminosity of the sources.
-
We did not observe extended bipolar emission from the outflowtoward IRAS 4C, as we would expect from anedge-on disk structure. IRAS 4A drives the fasteroutflow, followed by IRAS 4B andIRAS 4C. Outflows could be used as evolutionaryconstraints in the earlier phases of star formation.
-
We determined the lowest kinetic temperature toward IRAS 4C (~12 K), followed by IRAS 4A (~45 K) and IRAS 4B (~80 K).
-
We took into account the different derived temperatures of the sources and found IRAS 4C to have a three times higher mass than IRAS 4B. This can explain why the line profile of C17O is stronger toward IRAS 4C than IRAS 4B. IRAS 4A remains the most massive of the sources (2 M⊙).
-
The warmest source IRAS 4B is characterized by the lowest degree of depletion and deuteration and the highest HCN/HNC; this confirms its warm nature. In addition, IRAS 4C is characterized by the highest degree of depletion and HCN/HNC < 1, characteristic of objects with very low temperature. Owing to the large errors at such low temperatures, we can only provide an upper limit for the deuteration toward IRAS 4C (~20%).
-
IRAS 4A is ~twice cooler, ~three times more massive with ~four times stronger outflow activity and ~three times lower deuteration than IRAS 4B, and it is probably younger than IRAS 4B.
-
Our velocity distribution maps of several species show that IRAS 4A and IRAS 4B appear at different velocities from most of the region (+6.7 km s-1), while IRAS 4C and the surrounding area peak at a velocity higher about 1 km s-1 (+7.9 km s-1). The observed absorption of the HCN profiles at +7.84 km s-1 might be an indicator that IRAS 4C is not a member of IRAS 4 cloud, but is located in foreground. Our analysis is not dependent on the distance, however, with the exception of the mass calculation.
5.2. Discussion
Our JCMT data alone have revealed differences of the three sources that caused us to reconsider the true nature of IRAS 4C. The main differences appear in the a) chemical composition (i.e., the spectrum of IRAS 4C appears poorer than that of the other two); b) the spatial distribution of some species are more extended toward IRAS 4A and IRAS 4B, indicating stronger outflow activity; and c) the line profiles suggest weak or non-existent outflow activity in IRAS 4C.
Moreover, the H2CO kinetic temperature analysis revealed that IRAS 4C is characterized by the lowest kinetic temperature (~12 K), followed by IRAS 4A (~45 K) and IRAS 4B (~80 K). HCN/HNC and DCO+/HCO+ ratios support the temperatures estimated from the H2CO analysis. Furthermore, we determined the degree of CO depletion (N(CO)/N(H2)) and deuteration (N(DCO+)/N(HCO+)) for each object. We determined the lowest degree of depletion to be toward IRAS 4B, where the deuteration is lower. We report values of 12% for IRAS 4A source, 3.5% for IRAS 4B, and an upper limit of 20% for IRAS 4C. Last, we found the [HCN]/[HNC] of ~3.5 for IRAS 4A, ~4.2 for IRAS 4B, and ~0.85 for IRAS 4C, which agrees with the temperatures of the three sources.
We clearly observed differences between IRAS 4A, IRAS 4B, and IRAS 4C, which may be due to (a) differences in mass and/or luminosity; (b) a different orientation (edge-on vs. face-on); or (c) evolution.
Previous studies reported Lbol of 4.2 L⊙, 1.6 L⊙, and 0.49 L⊙ and Menv of 7.75 M⊙, 3.66 M⊙, and 0.5 M⊙ for IRAS 4A, IRAS 4B, and IRAS 4C, respectively, as detemined for a temperature of ~ 50 K (Enoch et al. 2009). We estimated masses of ~2 M⊙ for IRAS 4A, 0.6 M⊙ for IRAS 4B, and 1.5 M⊙ for IRAS 4C using different temperatures for each source as determined in Sect. 4.2. The mass of the envelope shows a linear correlation with the luminosity of CO lines (San José-García et al. 2013). The C17O emission toward IRAS 4C is stronger than for IRAS 4B, which can be explained by the fact that we found an about three times higher mass toward IRAS 4C than for IRAS 4B. The low bolometric luminosity toward IRAS 4C could be the main reason that we observe the weaker lines toward this source.
Dunham et al. (2008) reported LIR= 0.305 L⊙ for IRAS 4C as integrated for all existing detections between 1.25−70 μm, which corresponds to an internal luminosity LINT= 0.51 L⊙ and excludes the scenario that IRAS 4C is a VeLLO because its luminosity is >0.1 L⊙.
We finally detected an emission from a fourth source that we called IRAS 4-SWC, the nature of which is not clear. IRAS 4-SWC shows line peaks at lower velocity (~ 5.3 km s-1) and only narrow lines (~3 km s-1), which can either be a projection effect of the outflow or an indication that IRAS 4-SWC is a separate core. The non-detected emission at mid- and far-infrared at this position, while Winston et al. (2010) reported X-ray emission close to it, in combination with the fact that IRAS 4-SWC can be observed mostly in outflow tracers such as CH3OH means that it probably is not a separate core and instead connects it with internal shock from the IRAS 4A outflow.
5.3. Younger age scenario
We start with investigating the scenario that IRAS 4C is younger than the other two objects.
A lower temperature can be an indication of an earlier evolutionary state when the compared objects are characterized by the same luminosity. This is not the case for our sources, and we therefore cannot base our interpretation on the kinetic temperature alone. The deuteration ([N2D+]/[N2H+]) has been measured by Crapsi et al. (2005a) to be ~ 16−23% for a prestellar core (e.g., L1544) and ~ 5−10% for Class 0 objects (e.g., L1521F). Our results suggest that IRAS 4C is not the source with the higher deuteration, as expected for younger sources, but our large errors toward IRAS 4C (16%) do not allow us to clearly distinguish it from the other two sources.
The bolometric temperature can be additionally used to probe the various evolutionary stages from prestellar core to protostars (e.g., Enoch et al. 2009). Prestellar cores are characterized by Tbol~ 10−20 K, while Tbol< 50 K can be used to classify an object as early Class 0. The reported values for IRAS 4A and IRAS 4B are ~30−36 K (e.g., Kristensen et al. 2012; Motte & André 2001), while for IRAS 4C Tbol= 26 K (Dunham et al. 2008). Enoch et al. (2009) reported a value of ~ 50 K for all three objects. The variations between the reported values in different studies make the use of Tbol alone not reliable enough to separate the relative states of the sources.
Gutermuth et al. (2008) reported IRAS 4C as a deeply embedded source with incomplete IRAC photometry but a relatively bright MIPS 24 μm. IRAS 4A shows compact point-like emission at 3.6 μm and IRAS 4B at 4.5 μm (Young et al. 2015), which is associated with shock knots, while IRAS 4C shows a more extended weaker emission at 8 μm. This information tells us that IRAS 4C might contain a compact hydrostatic object that can cause warm dust to emit at 8 and 24 μm, which would exclude IRAS 4C from being a prestellar core (>70 μm).
Three-dimensional eradiation magneto-hydrodynamics simulations that reproduce the stage of a dense core collapse (Machida et al. 2008; Tomida et al. 2010) showed that a slow poorly collimated outflow can exist without the presence of a protostar, but rather due to the already formed FHSC. These simulations predict a very slow collimated outflow that does not exceed a velocity of 3 km s-1. On the other hand, both theory and observations (Shang 2007; Arce & Sargent 2006) report highly collimated outflows from YSOs that reach velocities of up to a few tens of km s-1. IRAS 4C does not seem to drive a strong outflow, while IRAS 4A and IRAS 4B do show a strong outflow activity (high-velocity gas). The orientation plays an important role for the observed outflow. Line emission from outflow tracers such as CO is more sensitive to the different orientation of the sources and can affect the strength of the observed outflow. The observed differences in the outflow activity might therefore be a result of orientation and/or evolution.
Although the orientation of the source may influence the interpretation of the outflow emission, it does not affect the estimated values of the degrees of CO depletion and deuteration. C17O, DCO+, and HCO+ are all species found to trace the envelope. Because the single-dish observations cannot resolve a disk structure, we assume that all of the observed emission comes from the bulk of gas that traces the envelope, and therefore it is independent of the source orientations. The determined values toward IRAS 4C indicate a colder, less evolved source than IRAS 4A and IRAS 4B, either between the prestellar and protostellar phase (FHSC), or a very young Class 0 object at the earliest accretion phase, which makes it one of the very few observed cases (e.g., André et al. 1999; Belloche et al. 2006).
5.4. Older age scenario
We now investigate the scenario that IRAS 4C is older than the other two objects.
Tobin et al. (2015) reported strong evidence of an edge-on disk-like structure around IRAS 4C, although the S/N in that work was not sufficient to test for Keplerian rotation. A disk structure indicates that IRAS 4C is a more evolved object than an FHSC, probably an object in the transition phase between Class 0 and Class I. An edge-on disk-like structure can cause an underestimation of the observed Tbol by even ~100 K (Launhardt et al. 2013). This would favor the scenario that IRAS 4C is a more evolved object with Tbol> 70 K, bringing it closer to the late Class 0 to early Class I stage. This would also agree with the fact that IRAS 4C is the object with the lowest luminosity, which might indicate weaker accreting activity and thus a more evolved object. Another indicator of evolutionary stage is the ratio Lsmm/Lbol, which is expected to be higher the less evolved the object, and it is considered to be more accurate than Tbol. This was found to be 5% for IRAS 4A, 5.5% for IRAS 4B, and 6.3% for IRAS 4C (Dunham et al. 2008; Sadavoy et al. 2014). Launhardt et al. (2013) reported values of 3% <Lsmm/Lbol< 7% for Class 0 and Class I objects, while Andre et al. (2000) have previously proposed a threshold of <0.3% for Class I objects. Furthermore, they reported 10% <Lsmm/Lbol< 30% for starless cores and objects that might host an embedded FHSC. This could limit the classification of IRAS 4C as an FHSC, but the reported values for the three sources are close enough, making it difficult to distinguish between the Class 0 and Class I stage. A rough classification would bring IRAS 4C to the Class 0 stage, but probably younger than the other two.
The collimation and bipolarity of an outflow can be used to distinguish Class 0 objects from the more evolved Class I objects. For Class I objects the outflow angle is wider, and later in the evolution, the swept-up material slows down because the driving force is reduced (Arce & Sargent 2006). Outflows in Class 0 sources have proven to be much stronger than in Class I objects (Bontemps et al. 1996).
Our CARMA observations indicate the presence of a slow outflow (~2 km s-1) that is not characterized by a wide angle and is rather compact. The nebulosity revealed by Spitzer shows a scattered light cone that originates at the location of the protostar, indicating that the most likely direction of the outflow is orthogonal to the plane of the disk. The edge-on disk scenario can explain the apparent low outflow velocity and thus partially why the line profiles from JCMT are so narrow toward IRAS 4C and deprived of the higher velocity activity, but it cannot explain that we do not observe a spatially extended outflow. The relatively wide cone-like structure to the east of IRAS 4C observed in our CO maps from the JCMT might be connected to the outflow activity. We may not observe a similar structure to the west of IRAS 4C because of the strong interaction with the red lobe of IRAS 4A. A more powerful outflow from 4A would sweep the red lobe of IRAS 4C away, but this requires a very specific geometry and distance of the sources and the outflows. This is the only scenario that can explain the observed outflow by an older age object, but the difference in VLSR argues against it. This explanation also cannot be valid if IRAS 4C is a foreground object because the outflow lobes certainly do not interact.
On the other hand, an outflow parallel to our line of sight could explain a more compact outflow, but this would mean that the observed velocity is very close to the real velocity and thus very slow, which is inconsistent with an older age.
5.5. Conclusions and future direction
Neither the younger nor the older age scenario seems to be fully consistent with the body of observational data on IRAS 4C. If IRAS 4C is old enough to reveal a disk structure, then we cannot fully explain the missing outflow and the cold nature of the source. If IRAS 4C is so young that it cannot drive a powerful outflow, then we cannot explain the low Lsmm/Lbol and the disk structure that has previously been observed. IRAS 4C appears not to be the strongest candidate among the FHSC candidates. Nevertheless, when all of the candidates located in Perseus (e.g., Pezzuto et al. 2012; Enoch et al. 2010) are confirmed, while statistics predict <0.2, it would be strong evidence that the lifespan of these objects is ≥103 yrs. This can be a result of a lower mass accretion rate (<4 × 10⁻⁵ M⊙/yr) or it might mean that special conditions apply to Perseus, perhaps non-stationary accretion. Tomida et al. (2010) predicted a lifespan longer than 104 yr for a protostar of 0.1 M⊙ from adopting an accretion rate of 10-5 M⊙/yr, and this would improve the situation in Perseus by an order of magnitude.
Applying FHSC and YSO disk models for IRAS 4C will help us to characterize this object better. In addition, the detailed study of the outflow of the observed FHSCs and VeLLOs may be helpful in understanding the missing link between these early stages of star formation.
Combined Array for Research in Millimeter-wave Astronomy; see https://www.mmarray.org
Acknowledgments
The authors thank Mark Krumholz for useful discussions. J.J.T. is supported by grant 639.041.439 from the Netherlands Organisation for Scientific Research (NWO).
References
- André, P., Motte, F., & Bacmann, A. 1999, ApJ, 513, L57 [NASA ADS] [CrossRef] [Google Scholar]
- Andre, P., Ward-Thompson, D., & Barsony, M. 2000, Protostars and Planets IV, 59 [Google Scholar]
- Arce, H. G., & Sargent, A. I. 2006, ApJ, 646, 1070 [NASA ADS] [CrossRef] [Google Scholar]
- Arce, H. G., Shepherd, D., Gueth, F., et al. 2007, Protostars and Planets V, 245 [Google Scholar]
- Bacmann, A., André, P., Puget, J.-L., et al. 2000, A&A, 361, 555 [Google Scholar]
- Bacmann, A., Lefloch, B., Ceccarelli, C., et al. 2002, A&A, 389, L6 [NASA ADS] [CrossRef] [EDP Sciences] [Google Scholar]
- Bacmann, A., Lefloch, B., Ceccarelli, C., et al. 2003, ApJ, 585, L55 [NASA ADS] [CrossRef] [EDP Sciences] [Google Scholar]
- Belloche, A., Parise, B., van der Tak, F. F. S., et al. 2006, A&A, 454, L51 [NASA ADS] [CrossRef] [EDP Sciences] [Google Scholar]
- Bergin, E. A., & Tafalla, M. 2007, ARA&A, 45, 339 [NASA ADS] [CrossRef] [Google Scholar]
- Beuther, H., Semenov, D., Henning, T., & Linz, H. 2008, ApJ, 675, L33 [NASA ADS] [CrossRef] [Google Scholar]
- Blake, G. A., Sandell, G., van Dishoeck, E. F., et al. 1995, ApJ, 441, 689 [Google Scholar]
- Bontemps, S., Andre, P., Terebey, S., & Cabrit, S. 1996, A&A, 311, 858 [NASA ADS] [Google Scholar]
- Bourke, T. L., Myers, P. C., Evans, II, N. J., et al. 2006, ApJ, 649, L37 [NASA ADS] [CrossRef] [Google Scholar]
- Buckle, J. V., Hills, R. E., Smith, H., et al. 2009, MNRAS, 399, 1026 [NASA ADS] [CrossRef] [Google Scholar]
- Caselli, P., Walmsley, C. M., Tafalla, M., Dore, L., & Myers, P. C. 1999, ApJ, 523, L165 [NASA ADS] [CrossRef] [Google Scholar]
- Chen, X., Arce, H. G., Zhang, Q., et al. 2010, ApJ, 715, 1344 [Google Scholar]
- Choi, M., Kamazaki, T., Tatematsu, K., & Panis, J.-F. 2004, ApJ, 617, 1157 [NASA ADS] [CrossRef] [Google Scholar]
- Crapsi, A., Caselli, P., Walmsley, C. M., et al. 2005a, ApJ, 619, 379 [Google Scholar]
- Crapsi, A., Devries, C. H., Huard, T. L., et al. 2005b, A&A, 439, 1023 [NASA ADS] [CrossRef] [EDP Sciences] [Google Scholar]
- Di Francesco, J., Myers, P. C., Wilner, D. J., Ohashi, N., & Mardones, D. 2001, ApJ, 562, 770 [NASA ADS] [CrossRef] [Google Scholar]
- Duarte-Cabral, A., Bontemps, S., Motte, F., et al. 2014, A&A, 570, A1 [NASA ADS] [CrossRef] [EDP Sciences] [Google Scholar]
- Dumouchel, F., Faure, A., & Lique, F. 2010, MNRAS, 406, 2488 [NASA ADS] [CrossRef] [Google Scholar]
- Dunham, M. M., Evans, II, N. J., Bourke, T. L., et al. 2006, ApJ, 651, 945 [NASA ADS] [CrossRef] [Google Scholar]
- Dunham, M. M., Crapsi, A., Evans, II, N. J., et al. 2008, ApJS, 179, 249 [NASA ADS] [CrossRef] [Google Scholar]
- Elitzur, M., Hollenbach, D. J., & McKee, C. F. 1992, ApJ, 394, 221 [NASA ADS] [CrossRef] [Google Scholar]
- Enoch, M. L., Young, K. E., Glenn, J., et al. 2006, ApJ, 638, 293 [NASA ADS] [CrossRef] [Google Scholar]
- Enoch, M. L., Evans, II, N. J., Sargent, A. I., et al. 2008, ApJ, 684, 1240 [NASA ADS] [CrossRef] [Google Scholar]
- Enoch, M. L., Evans, II, N. J., Sargent, A. I., & Glenn, J. 2009, ApJ, 692, 973 [NASA ADS] [CrossRef] [Google Scholar]
- Enoch, M. L., Lee, J.-E., Harvey, P., Dunham, M. M., & Schnee, S. 2010, ApJ, 722, L33 [Google Scholar]
- Evans, II, N. J., Allen, L. E., Blake, G. A., et al. 2003, PASP, 115, 965 [NASA ADS] [CrossRef] [Google Scholar]
- Evans, II, N. J., Dunham, M. M., Jørgensen, J. K., et al. 2009, ApJS, 181, 321 [NASA ADS] [CrossRef] [Google Scholar]
- Flower, D. R. 1999, MNRAS, 305, 651 [NASA ADS] [CrossRef] [Google Scholar]
- Fontani, F., Palau, A., Caselli, P., et al. 2011, A&A, 529, L7 [NASA ADS] [CrossRef] [EDP Sciences] [Google Scholar]
- Fontani, F., Sakai, T., Furuya, K., et al. 2014, MNRAS, 440, 448 [NASA ADS] [CrossRef] [Google Scholar]
- Friesen, R. K., Kirk, H. M., & Shirley, Y. L. 2013, ApJ, 765, 59 [NASA ADS] [CrossRef] [Google Scholar]
- Furuya, R. S., Kitamura, Y., Wootten, A., Claussen, M. J., & Kawabe, R. 2003, ApJ, 144, 71 [NASA ADS] [Google Scholar]
- Graninger, D. M., Herbst, E., Öberg, K. I., & Vasyunin, A. I. 2014, ApJ, 787, 74 [NASA ADS] [CrossRef] [Google Scholar]
- Green, S. 1991, ApJS, 76, 979 [NASA ADS] [CrossRef] [Google Scholar]
- Gregersen, E. M., & Evans, II, N. J. 2000, ApJ, 538, 260 [NASA ADS] [CrossRef] [Google Scholar]
- Gutermuth, R. A., Myers, P. C., Megeath, S. T., et al. 2008, ApJ, 674, 336 [NASA ADS] [CrossRef] [Google Scholar]
- Haschick, A. D., Moran, J. M., Rodriguez, L. F., et al. 1980, ApJ, 237, 26 [NASA ADS] [CrossRef] [Google Scholar]
- Hatchell, J., Richer, J. S., Fuller, G. A., et al. 2005, A&A, 440, 151 [NASA ADS] [CrossRef] [EDP Sciences] [Google Scholar]
- Herbig, G. H., & Jones, B. F. 1983, AJ, 88, 1040 [NASA ADS] [CrossRef] [Google Scholar]
- Hirota, T., Bushimata, T., Choi, Y. K., et al. 2008, PASJ, 60, 37 [NASA ADS] [CrossRef] [Google Scholar]
- Jørgensen, J. K., Harvey, P. M., Evans, II, N. J., et al. 2006, ApJ, 645, 1246 [NASA ADS] [CrossRef] [Google Scholar]
- Kristensen, L. E., van Dishoeck, E. F., Bergin, E. A., et al. 2012, A&A, 542, A8 [NASA ADS] [CrossRef] [EDP Sciences] [Google Scholar]
- Langer, W. D., Castets, A., & Lefloch, B. 1996, ApJ, 471, L111 [NASA ADS] [CrossRef] [Google Scholar]
- Larson, R. B. 1969, MNRAS, 145, 271 [NASA ADS] [CrossRef] [Google Scholar]
- Launhardt, R., Stutz, A. M., Schmiedeke, A., et al. 2013, A&A, 551, A98 [NASA ADS] [CrossRef] [EDP Sciences] [Google Scholar]
- Lee, C. W., Kim, M.-R., Kim, G., et al. 2013, ApJ, 777, 50 [NASA ADS] [CrossRef] [Google Scholar]
- Lee, K. I., Dunham, M. M., Myers, P. C., et al. 2015, ApJ, 814, 114 [NASA ADS] [CrossRef] [Google Scholar]
- Lefloch, B., Castets, A., Cernicharo, J., & Loinard, L. 1998, ApJ, 504, L109 [NASA ADS] [CrossRef] [Google Scholar]
- Linsky, J. L., Diplas, A., Wood, B. E., et al. 1995, ApJ, 451, 335 [NASA ADS] [CrossRef] [Google Scholar]
- Looney, L. W., Mundy, L. G., & Welch, W. J. 2000, ApJ, 529, 477 [NASA ADS] [CrossRef] [Google Scholar]
- Machida, M. N., & Hosokawa, T. 2013, MNRAS, 431, 1719 [NASA ADS] [CrossRef] [Google Scholar]
- Machida, M. N., Matsumoto, T., & Inutsuka, S.-i. 2008, ApJ, 685, 690 [NASA ADS] [CrossRef] [Google Scholar]
- Maret, S., Ceccarelli, C., Caux, E., et al. 2004, A&A, 416, 577 [NASA ADS] [CrossRef] [EDP Sciences] [Google Scholar]
- Maret, S., Bergin, E. A., Neufeld, D. A., et al. 2009, ApJ, 698, 1244 [NASA ADS] [CrossRef] [Google Scholar]
- Marvel, K. B., Wilking, B. A., Claussen, M. J., & Wootten, A. 2008, ApJ, 685, 285 [NASA ADS] [CrossRef] [Google Scholar]
- Millar, T. J., Bennett, A., & Herbst, E. 1989, ApJ, 340, 906 [NASA ADS] [CrossRef] [Google Scholar]
- Motte, F., & André, P. 2001, A&A, 365, 440 [NASA ADS] [CrossRef] [EDP Sciences] [Google Scholar]
- Ossenkopf, V., & Henning, T. 1994, A&A, 291, 943 [NASA ADS] [Google Scholar]
- Padovani, M., Walmsley, C. M., Tafalla, M., Hily-Blant, P., & Pineau Des Forêts, G. 2011, A&A, 534, A77 [NASA ADS] [CrossRef] [EDP Sciences] [Google Scholar]
- Pagani, L., Lesaffre, P., Jorfi, M., et al. 2013, A&A, 551, A38 [NASA ADS] [CrossRef] [EDP Sciences] [Google Scholar]
- Parise, B., Ceccarelli, C., Tielens, A. G. G. M., et al. 2006, A&A, 453, 949 [NASA ADS] [CrossRef] [EDP Sciences] [Google Scholar]
- Park, G., & Choi, M. 2007, ApJ, 664, L99 [NASA ADS] [CrossRef] [Google Scholar]
- Pezzuto, S., Elia, D., Schisano, E., et al. 2012, A&A, 547, A54 [NASA ADS] [CrossRef] [EDP Sciences] [Google Scholar]
- Pickett, H. M., Poynter, R. L., Cohen, E. A., et al. 1998, J. Quant. Spec. Radiat. Transf., 60, 883 [Google Scholar]
- Pineda, J. E., Arce, H. G., Schnee, S., et al. 2011, ApJ, 743, 201 [NASA ADS] [CrossRef] [Google Scholar]
- Plume, R., Fuller, G. A., Helmich, F., et al. 2007, PASP, 119, 102 [NASA ADS] [CrossRef] [Google Scholar]
- Rodríguez, L. F., Anglada, G., Torrelles, J. M., et al. 2002, A&A, 389, 572 [NASA ADS] [CrossRef] [EDP Sciences] [Google Scholar]
- Sadavoy, S. I., Di Francesco, J., André, P., et al. 2014, ApJ, 787, L18 [NASA ADS] [CrossRef] [Google Scholar]
- Sakai, N., Saruwatari, O., Sakai, T., Takano, S., & Yamamoto, S. 2010, A&A, 512, A31 [NASA ADS] [CrossRef] [EDP Sciences] [Google Scholar]
- San José-García, I., Mottram, J. C., Kristensen, L. E., et al. 2013, A&A, 553, A125 [NASA ADS] [CrossRef] [EDP Sciences] [Google Scholar]
- Sandell, G., & Knee, L. B. G. 2001, ApJ, 546, L49 [NASA ADS] [CrossRef] [Google Scholar]
- Santangelo, G., Codella, C., Cabrit, S., et al. 2015, A&A, 584, A126 [NASA ADS] [CrossRef] [EDP Sciences] [Google Scholar]
- Sarrasin, E., Abdallah, D. B., Wernli, M., et al. 2010, MNRAS, 404, 518 [NASA ADS] [Google Scholar]
- Sault, R. J., Teuben, P. J., & Wright, M. C. H. 1995, in Astronomical Data Analysis Software and Systems IV, eds. R. A. Shaw, H. E. Payne, & J. J. E. Hayes, ASP Conf. Ser., 77, 433 [Google Scholar]
- Schilke, P., Walmsley, C. M., Pineau Des Forets, G., et al. 1992, A&A, 256, 595 [NASA ADS] [Google Scholar]
- Schnee, S., Sadavoy, S., Di Francesco, J., Johnstone, D., & Wei, L. 2012, ApJ, 755, 178 [NASA ADS] [CrossRef] [Google Scholar]
- Schöier, F. L., van der Tak, F. F. S., van Dishoeck, E. F., & Black, J. H. 2005, A&A, 432, 369 [NASA ADS] [CrossRef] [EDP Sciences] [Google Scholar]
- Shah, R. Y., & Wootten, A. 2001, ApJ, 554, 933 [NASA ADS] [CrossRef] [Google Scholar]
- Shang, H. 2007, Ap&SS, 311, 25 [NASA ADS] [CrossRef] [Google Scholar]
- Smith, K. W., Bonnell, I. A., Emerson, J. P., & Jenness, T. 2000, MNRAS, 319, 991 [NASA ADS] [CrossRef] [Google Scholar]
- Tobin, J. J., Bergin, E. A., Hartmann, L., et al. 2013, ApJ, 765, 18 [NASA ADS] [CrossRef] [Google Scholar]
- Tobin, J. J., Looney, L. W., Wilner, D. J., et al. 2015, ApJ, 805, 125 [NASA ADS] [CrossRef] [Google Scholar]
- Tomida, K., Machida, M. N., Saigo, K., Tomisaka, K., & Matsumoto, T. 2010, ApJ, 725, L239 [NASA ADS] [CrossRef] [Google Scholar]
- van der Tak, F. F. S., Black, J. H., Schöier, F. L., Jansen, D. J., & van Dishoeck, E. F. 2007, A&A, 468, 627 [NASA ADS] [CrossRef] [EDP Sciences] [Google Scholar]
- van Kempen, T. A., Hogerheijde, M. R., van Dishoeck, E. F., et al. 2006, A&A, 454, L75 [NASA ADS] [CrossRef] [EDP Sciences] [Google Scholar]
- Wiesenfeld, L., & Faure, A. 2013, MNRAS, 432, 2573 [NASA ADS] [CrossRef] [Google Scholar]
- Wilson, T. L. 1999, Rep. Prog. Phys., 62, 143 [Google Scholar]
- Winston, E., Megeath, S. T., Wolk, S. J., et al. 2010, AJ, 140, 266 [NASA ADS] [CrossRef] [Google Scholar]
- Wootten, A. 1995, Ap&SS, 224, 43 [NASA ADS] [CrossRef] [Google Scholar]
- Yıldız, U. A., Kristensen, L. E., van Dishoeck, E. F., et al. 2012, A&A, 542, A86 [NASA ADS] [CrossRef] [EDP Sciences] [Google Scholar]
- Young, C. H., Jørgensen, J. K., Shirley, Y. L., et al. 2004, ApJS, 154, 396 [NASA ADS] [CrossRef] [Google Scholar]
- Young, K. E., Young, C. H., Lai, S.-P., Dunham, M. M., & Evans, II, N. J. 2015, AJ, 150, 40 [NASA ADS] [CrossRef] [Google Scholar]
Appendix A: Line detections toward the three sources
Molecular line detections for NGC 1333-IRAS 4A – JCMT data.
Molecular line detections for NGC 1333-IRAS 4B – JCMT data.
Molecular line detections for NGC 1333-IRAS 4C - JCMT data
All Tables
All Figures
|
Fig. 1 Main line detections of the spectra extracted for the three positions of NGC 1333: IRAS 4A, IRAS 4B, and IRAS 4C covering the full JCMT range 330−373 GHz. The gap seen at 368−369.5 GHz is due to poor atmospheric transmission. The spectra are plotted with a vertical offset at 0.3, 0.7 and 1.1 intensity levels (K) to facilitate comparison. The coordinates of the three sources IRAS 4A (RA = 03:29:10.51, Dec = 31:13:31.4 (J2000)), IRAS 4B (RA = 03:29:12.01, Dec = 31:13:08.0 (J2000)) and IRAS 4C (RA = 03:29:13.64, Dec = 31:13:57.5 (J2000)) are taken from Sandell & Knee (2001). |
| In the text | |
|
Fig. 2 Integrated intensity map (core; from +5 to +10 km s-1) of H2CO 51,5–41,4 in colors, overplotted with its blue (from −5 to +5 km s-1) and red (from +10 to +17 km s-1) wing emission in blue and red contours, respectively. H2CO peaks toward IRAS 4B and shows a weak emission toward IRAS 4C, but is not connected to outflows. Note also the small peak to the southwest of IRAS 4A. The red and blue contour levels are set to 10, 30, 50, 70, and 100 × rms (rms: 0.02 K). |
| In the text | |
|
Fig. 3 Integrated intensity map (core; from +5 to +9 km s-1) of C17O 3−2 in colors, overplotted with the HCN 4−3 contours tracing outflow activity, namely red wing (from +10 to +25 km s-1) in red contours and blue wing (from −10 to +4 km s-1) emission in blue contours. The plot shows the bipolar outflows driven by IRAS 4A and IRAS 4B Class 0 objects. We do not see such activity toward IRAS 4C. C17O is stronger toward IRAS 4C than toward IRAS 4B. The red and blue contour levels are set to 10, 30, 50, 70, and 100 × rms (rms: 0.02 K). The contours at the top arise because the map is noisier toward the edges. |
| In the text | |
|
Fig. 4 Integrated intensity map (core; from +5 to +9 km s-1) of CO 3−2 in colors, overplotted with the red wing (from +10 to +25 km s-1) emission (red contours) and blue wing (from −10 to +4 km s-1) emission in blue contours. The plot clearly shows the strong bipolar outflow driven by the IRAS 4A Class 0 object. The red and blue contours levels are set to 100, 300, 500, and 800 × rms (rms: 0.02 K). |
| In the text | |
|
Fig. 5 Integrated intensity map (from −11 to +23 km s-1) of SiO 8−7 in colors, overplotted with the blue (from −5 to +5 km s-1) and red (from +9 to +15 km s-1) wing emission from CH3OH 7−1,7–6−1,6 in blue and red contours, respectively. The SiO peaks north of IRAS 4A close to the peak redshifted emission of CH3OH and traces the shock activity in the region. No emission connected to IRAS 4C is observed. The red and blue contour levels are set to 5, 30, 50, 70, 100, and 150 × rms (rms: 0.02 K). |
| In the text | |
|
Fig. 6 Integrated intensity map (from +5 to +9 km s-1) of H2D+ 11,0–11,1 in colors, overplotted with N2H+ 4−3 in blue contours and DCO+ 5−4 in red contours. The blue contours are set to 5, 20, 30, and 40 × rms (rms: 0.02 K), and the red contours are set to 3, 5, and 8 × rms (rms: 0.03 K). |
| In the text | |
|
Fig. 7 Gaussian fit of a broad and a narrow component of CS 7−6 toward IRAS 4A, IRAS 4B, and IRAS 4C (bottom to top). Dense gas tracers such as CS 7−6 do not show absorption, but do show differences in line widths and strengths between the Class 0 objects IRAS 4A, IRAS 4B, and the IRAS 4C (single component). |
| In the text | |
|
Fig. 8 CO and HCN line profiles for IRAS 4A, IRAS 4B, and IRAS 4C (bottom to top). Note the absorption toward all positions. IRAS 4A shows a broad wing component, followed by IRAS 4B, but IRAS 4C shows a steep line profile and only a very narrow red wing in both CO and HCN. The heavy absorption toward IRAS 4C makes it difficult to fit accurate Gaussians. The vertical line at +6.7 km s-1 indicates the ambient velocity of IRAS 4A and 4B. |
| In the text | |
|
Fig. 9 Profiles of formaldehyde (top) and methanol (bottom) lines as observed toward the three sources IRAS 4A, IRAS 4B, and IRAS 4C. IRAS 4C is present at the lower transitions where IRAS 4A is the strongest peak. At higher transitions IRAS 4B is the strongest peak. In all cases IRAS 4A shows the broadest profile of the three sources. |
| In the text | |
|
Fig. 10 Line profiles of C2H (N = 4−3, J = 9/2−7/2, F = 4−3) toward IRAS 4A, IRAS 4B, and IRAS 4C (bottom to top). C2H is stronger toward IRAS 4C. The intensity of the other two lines are comparable, but IRAS 4A shows a broader profile. The vertical line represents the ambient velocity of IRAS 4A and 4B at +6.7 km s-1. |
| In the text | |
|
Fig. 11 Channel maps of SO 9(8)−8(7) obtained with the JCMT, with the central velocities given in km s-1. The emission from IRAS 4C appears at higher velocity channels (from +7 to +8 km s-1), while IRAS 4-SWC is observed at lower velocity channel (+5.6 km s-1). The peak north of IRAS 4A at about +7 km s-1 can be associated with an outflow or shock from IRAS 4A. |
| In the text | |
|
Fig. 12 CARMA continuum observations of NGC 1333/IRAS 4C at 1.3 mm (grayscale) overplotted with the red and blue wings of 13CO 2−1. The velocity range of the line is between +5 and +11 km s-1, and a siginificant part of the emission has been resolved out by the interferometer at the source velocity, while we still detect emission from the wings. The peaks of the blue (from +5 to +6.5 km s-1) and red (from +8.5 to +11 km s-1) wing show a small offset compared to the peak intensity of the continuum. The blue contours levels are set to 0.04, 0.06, 0.08, 0.10, and 0.13 Jy/beam (rms ~ 0.014 Jy/beam) and the red at 0.06, 0.09, 0.12, 0.15, and 0.18 Jy/beam (rms ~ 0.02 Jy/beam). The ellipse shows the beam size and shape at this wavelength (2.12″× 1.81″). The arrows represent the direction of blue- and redshifted outflow components (Tobin et al. 2015). |
| In the text | |
|
Fig. 13 CO isotopologs as observed with CARMA toward NGC 1333/IRAS 4C. 13CO shows a broader profile, and a significant part of the emission has possibly been resolved out by the interferometer, while C18O shows only narrow emission. The vertical line at +8 km s-1 is the velocity of the C18O peak. The plotted flux offset between the lines has been chosen to facilitate comparison. 12CO is not shown because it is heavily affected by absorption, which makes using it very difficult. |
| In the text | |
|
Fig. 14 Continuum emission toward IRAS 4C in colors, overplotted with the N2D+ 3−2 emission with blue contours at 0.45, 0.6, 0.7, 0.8, and 0.95 Jy/beam (rms ~ 15 mJy/beam) and with the C18O 2−1 emission with yellow contours at 0.04, 0.08, 0.10, 0.14, 0.20, and 0.29 Jy/beam (rms ~ 14 mJy/beam). We observe an offset between the continuum source and the N2D+ of 8.5′′. The beam sizes of the continuum (yellow) and the lines (blue) are also plotted in the bottom left corner. |
| In the text | |
|
Fig. 15 Kinetic temperature map of NGC 1333 IRAS 4 (left). During the fitting procedure all the seven H2CO detected lines are taken into account for the positions with S/N> 3. The white contour shows the region where at least two lines were detected with S/N> 3. The kinetic temperature is higher toward the Class 0 objects IRAS 4A (~ 45 K) and IRAS 4B (~ 80 K), while it is significantly lower toward IRAS 4C (~ 12 K). We also note the compact emission toward IRAS 4-SWC (~ 15 K), which has been observed in channel maps of other molecules (e.g., CH3OH, and SO, Fig. 11). The tau map of H2CO 50,5–40,4 presents values in the optically thin regime throughout the cloud (middle; ~0.1−0.7). The best resulting χ2 varies between ~1−5 in the region of the sources (right). |
| In the text | |
|
Fig. 16 Synthetic CO column density as determined from fitting the peak intensities for the range from +5 to +9 km s-1. |
| In the text | |
|
Fig. 17 C17O 3–2 line profiles toward IRAS 4A, IRAS 4B, and IRAS 4C. The line is strongest toward IRAS 4A, followed by IRAS 4C and then IRAS 4B. |
| In the text | |
|
Fig. 18 Observed HCO+ 4–3/H13CO+ 4–3 ratio of the peak intensities for the range of +5 to +9 km s-1. The observed ratio takes values between 6 and 37, which is lower than the optically thin ratio of 60 and indicates that the main isotope HCO+ 4−3 is optically thick throughout the cloud. The effect is stronger toward the three embedded objects. |
| In the text | |
Current usage metrics show cumulative count of Article Views (full-text article views including HTML views, PDF and ePub downloads, according to the available data) and Abstracts Views on Vision4Press platform.
Data correspond to usage on the plateform after 2015. The current usage metrics is available 48-96 hours after online publication and is updated daily on week days.
Initial download of the metrics may take a while.