Fig. 9
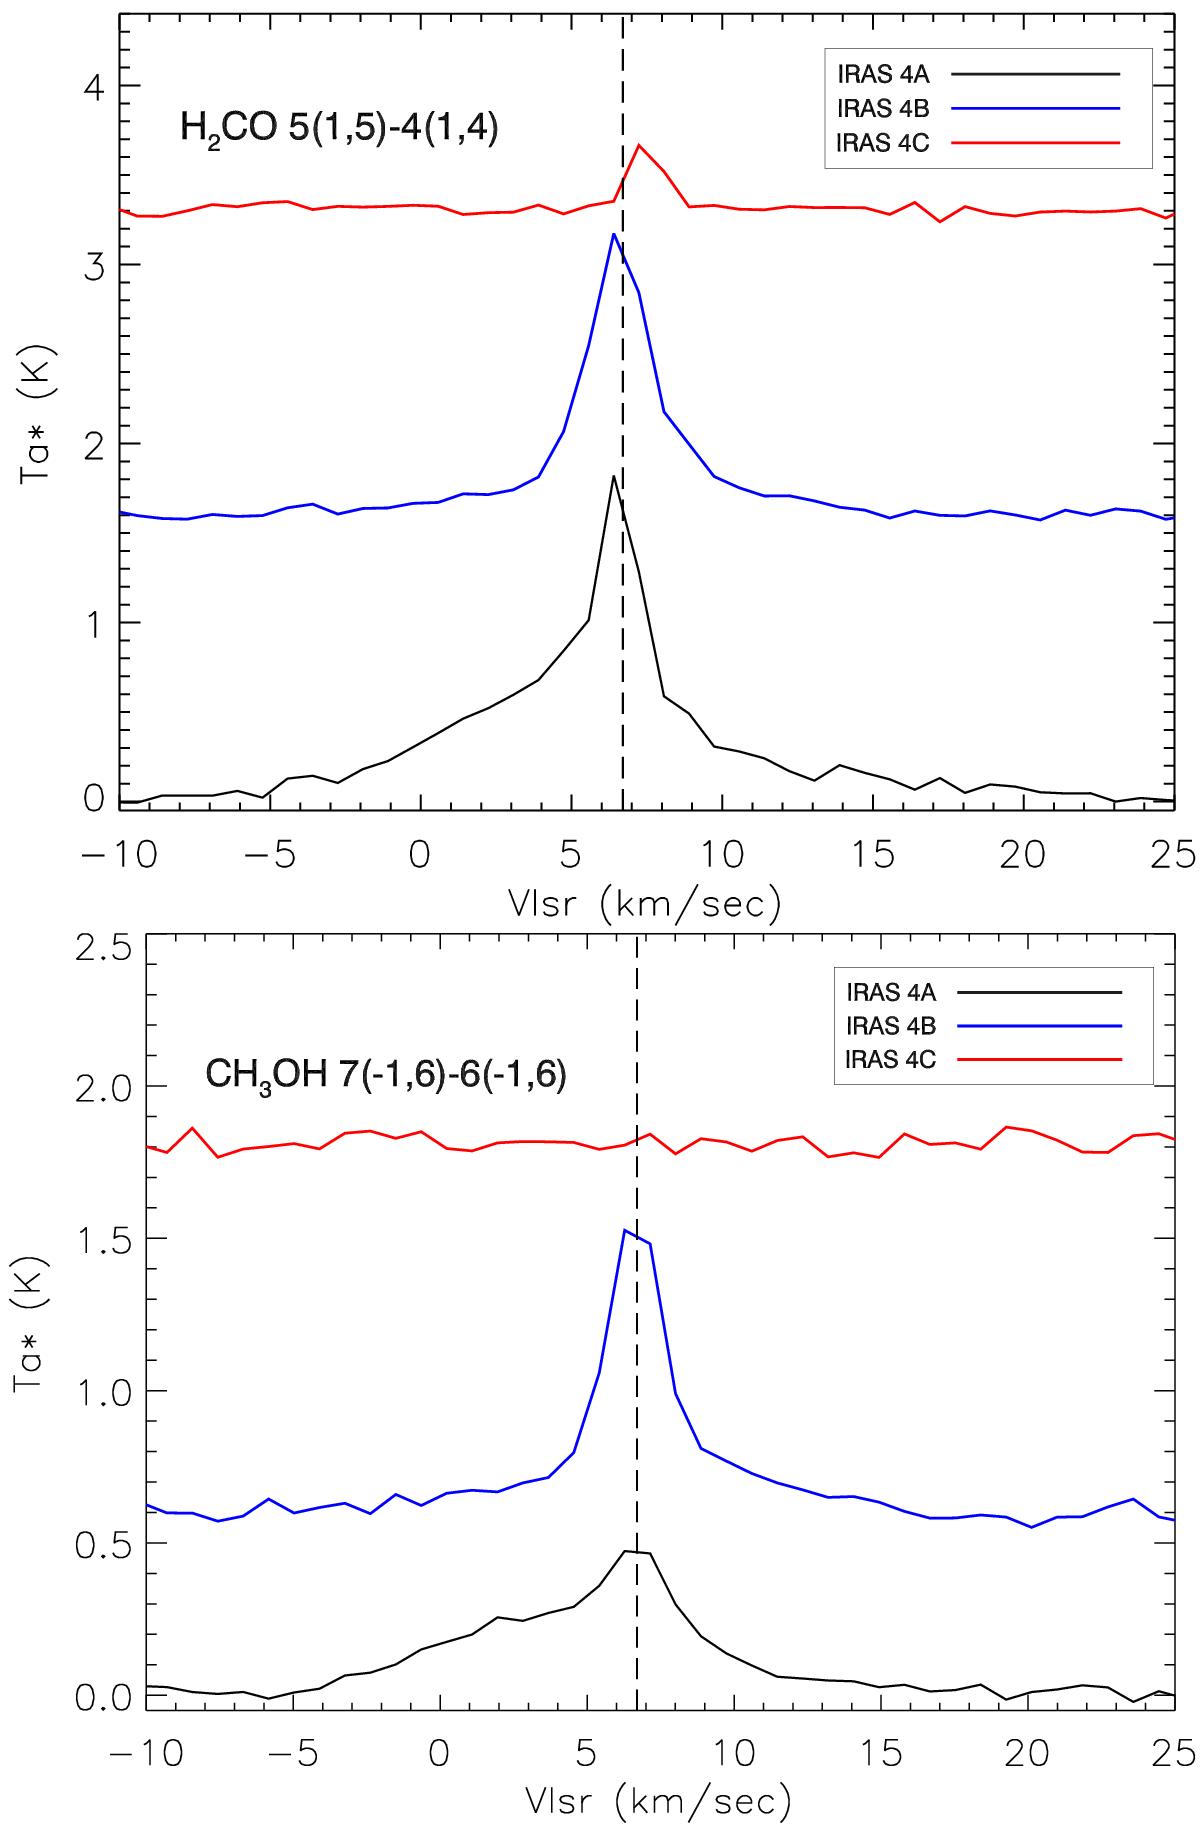
Profiles of formaldehyde (top) and methanol (bottom) lines as observed toward the three sources IRAS 4A, IRAS 4B, and IRAS 4C. IRAS 4C is present at the lower transitions where IRAS 4A is the strongest peak. At higher transitions IRAS 4B is the strongest peak. In all cases IRAS 4A shows the broadest profile of the three sources.
Current usage metrics show cumulative count of Article Views (full-text article views including HTML views, PDF and ePub downloads, according to the available data) and Abstracts Views on Vision4Press platform.
Data correspond to usage on the plateform after 2015. The current usage metrics is available 48-96 hours after online publication and is updated daily on week days.
Initial download of the metrics may take a while.