Fig. 8
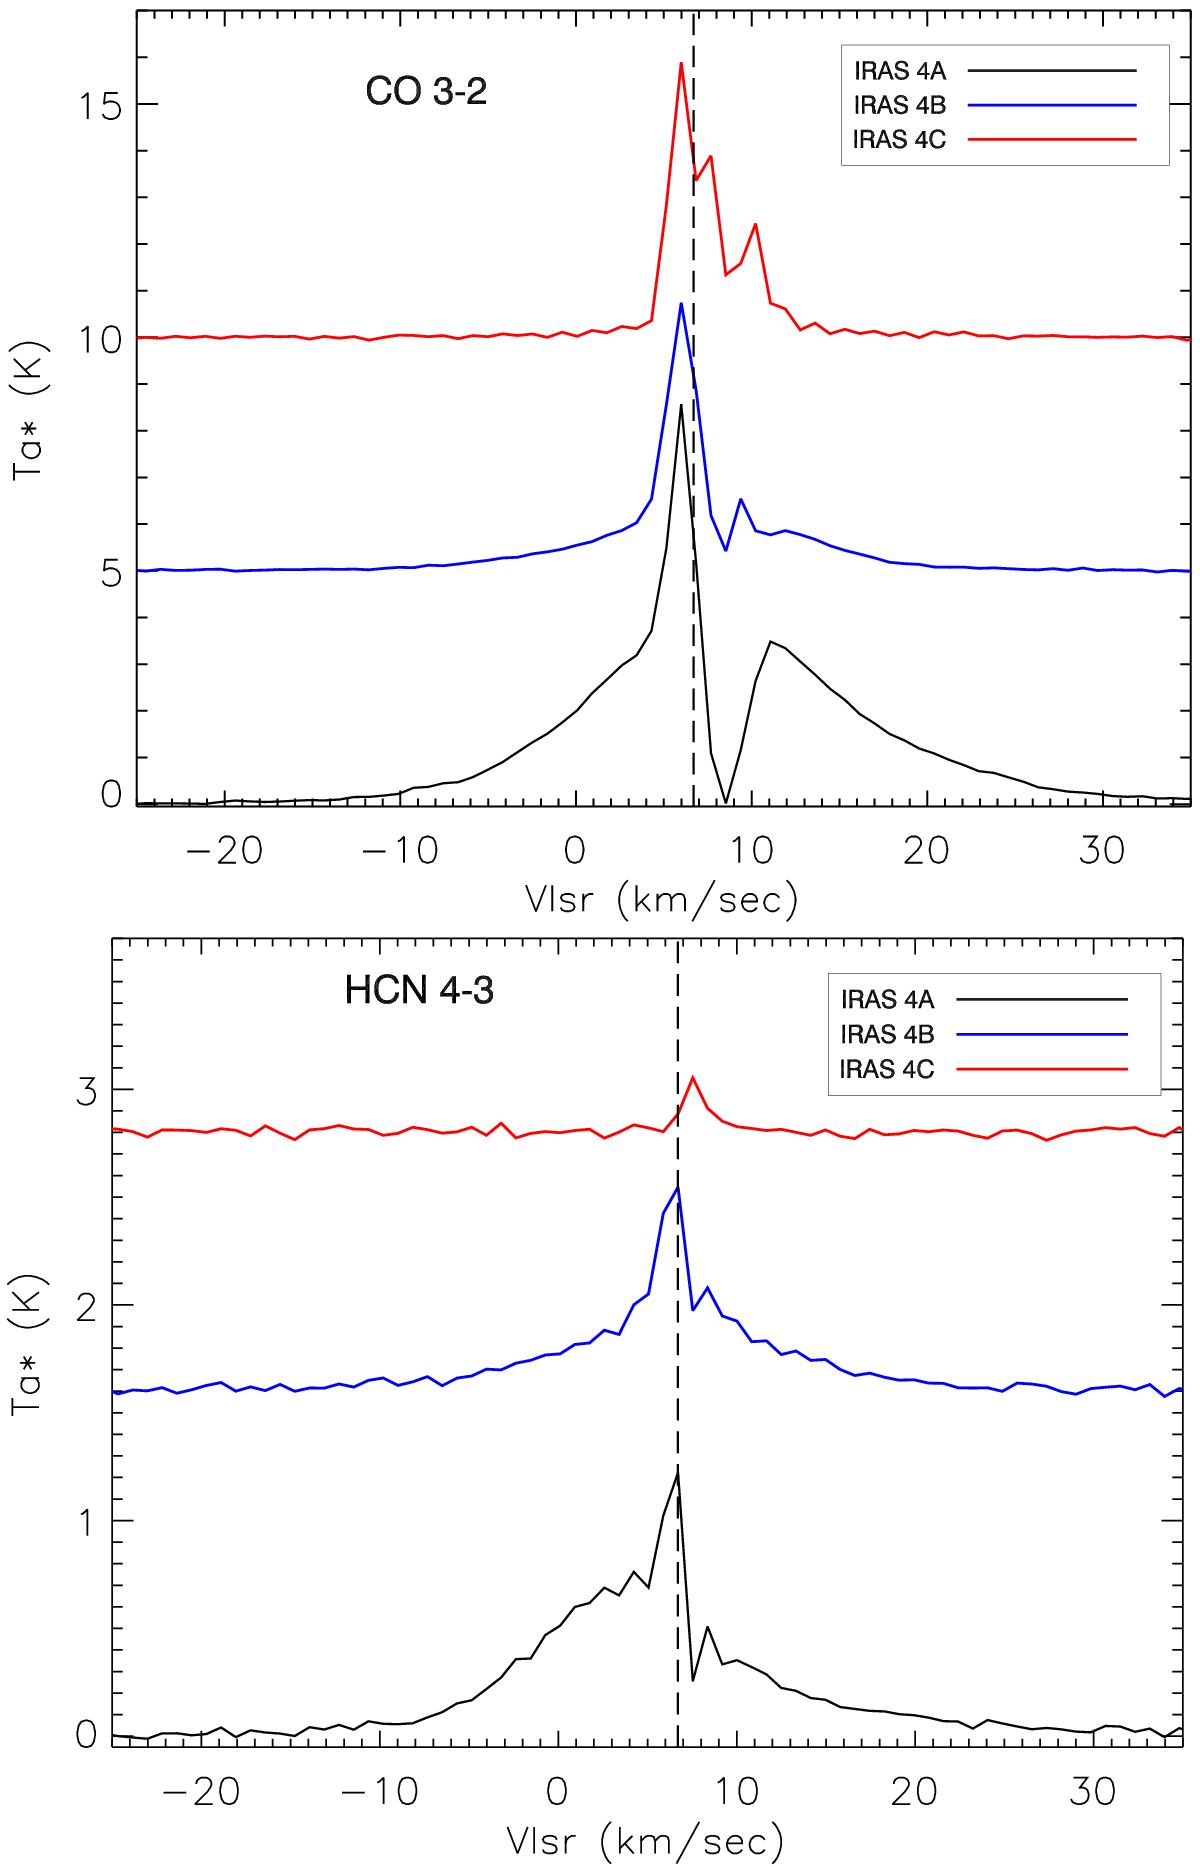
CO and HCN line profiles for IRAS 4A, IRAS 4B, and IRAS 4C (bottom to top). Note the absorption toward all positions. IRAS 4A shows a broad wing component, followed by IRAS 4B, but IRAS 4C shows a steep line profile and only a very narrow red wing in both CO and HCN. The heavy absorption toward IRAS 4C makes it difficult to fit accurate Gaussians. The vertical line at +6.7 km s-1 indicates the ambient velocity of IRAS 4A and 4B.
Current usage metrics show cumulative count of Article Views (full-text article views including HTML views, PDF and ePub downloads, according to the available data) and Abstracts Views on Vision4Press platform.
Data correspond to usage on the plateform after 2015. The current usage metrics is available 48-96 hours after online publication and is updated daily on week days.
Initial download of the metrics may take a while.