Fig. 13
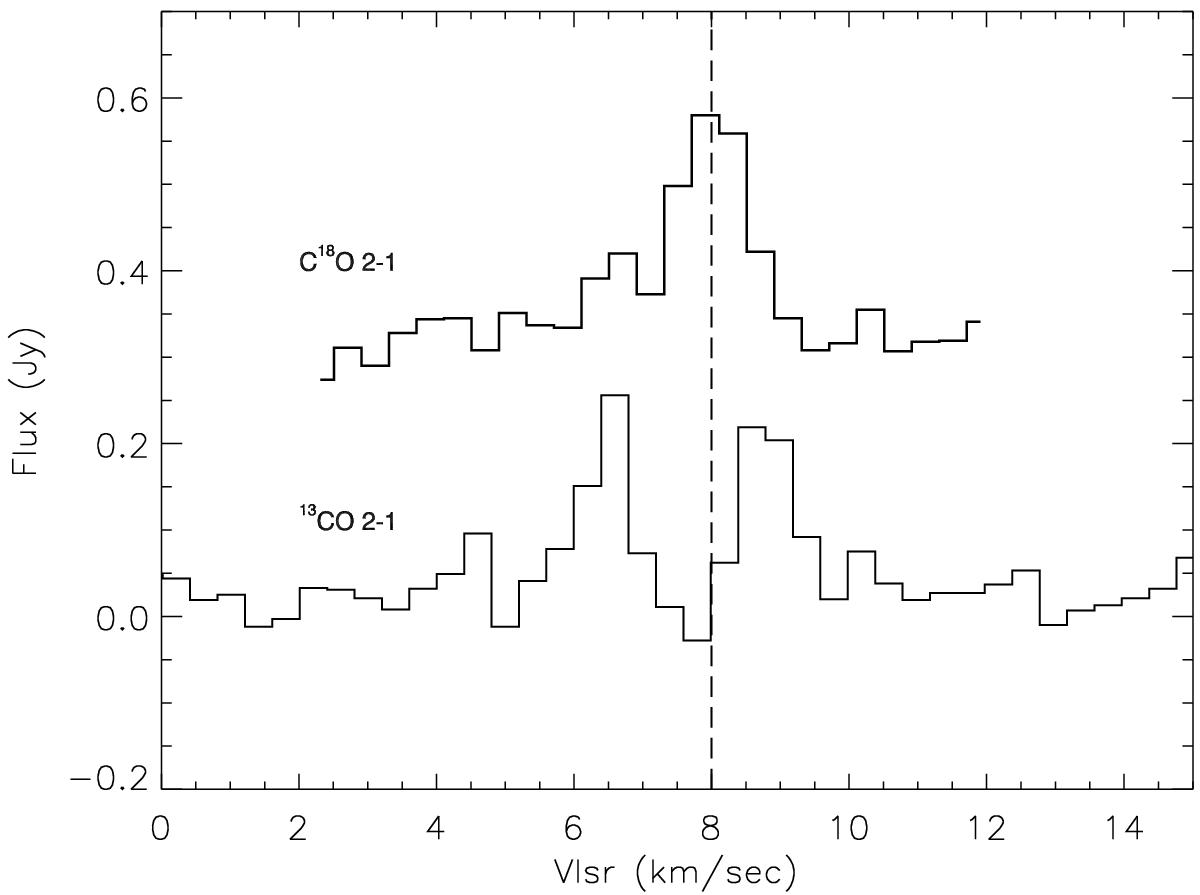
CO isotopologs as observed with CARMA toward NGC 1333/IRAS 4C. 13CO shows a broader profile, and a significant part of the emission has possibly been resolved out by the interferometer, while C18O shows only narrow emission. The vertical line at +8 km s-1 is the velocity of the C18O peak. The plotted flux offset between the lines has been chosen to facilitate comparison. 12CO is not shown because it is heavily affected by absorption, which makes using it very difficult.
Current usage metrics show cumulative count of Article Views (full-text article views including HTML views, PDF and ePub downloads, according to the available data) and Abstracts Views on Vision4Press platform.
Data correspond to usage on the plateform after 2015. The current usage metrics is available 48-96 hours after online publication and is updated daily on week days.
Initial download of the metrics may take a while.