Fig. 5
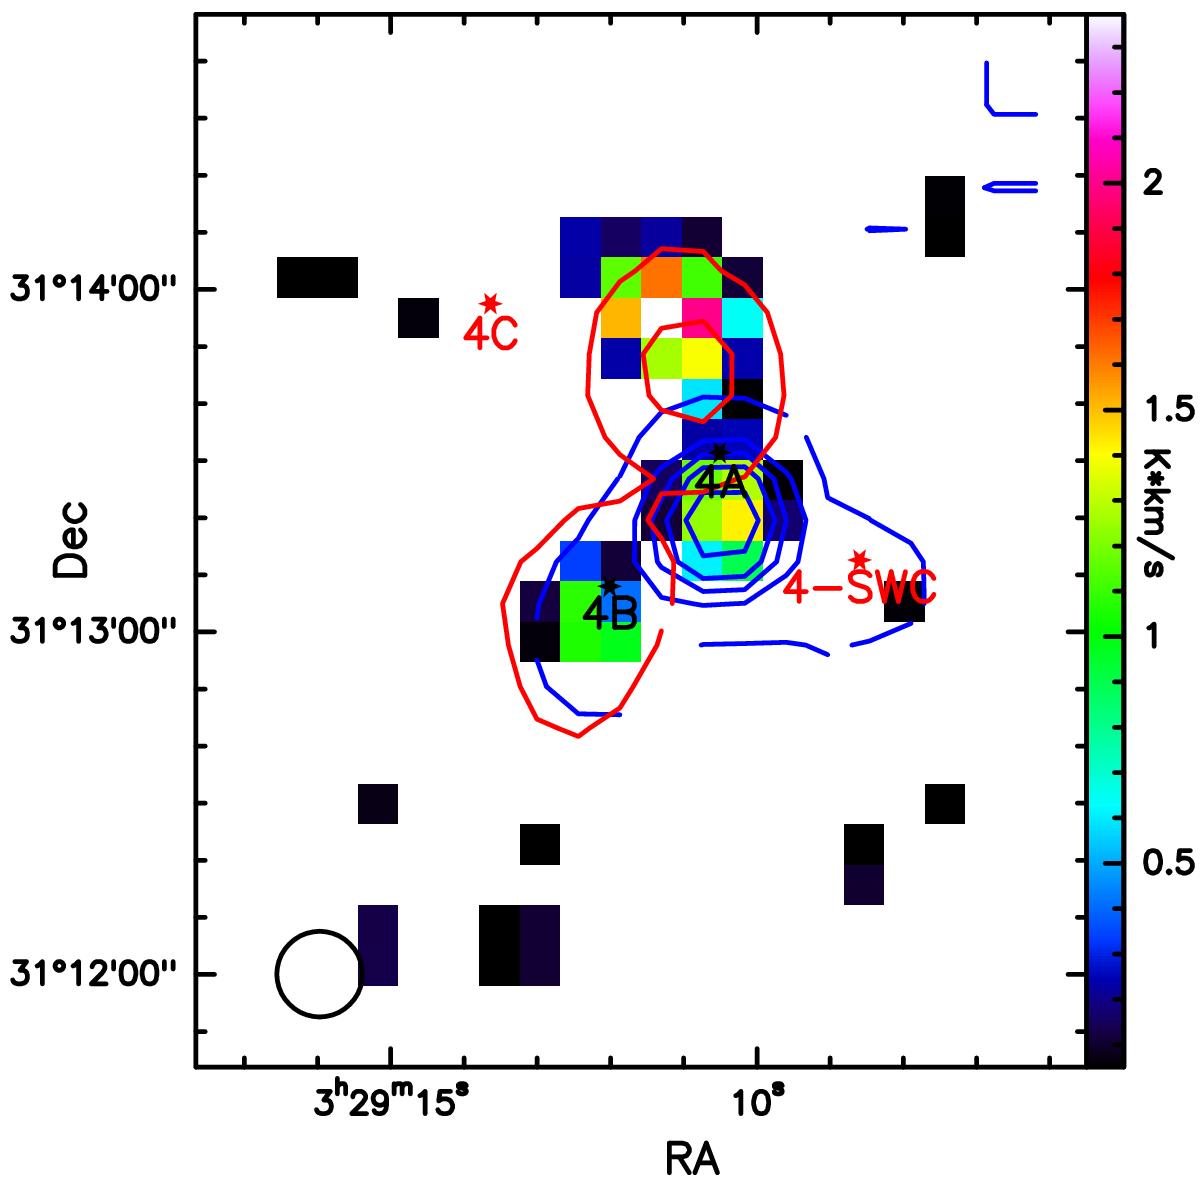
Integrated intensity map (from −11 to +23 km s-1) of SiO 8−7 in colors, overplotted with the blue (from −5 to +5 km s-1) and red (from +9 to +15 km s-1) wing emission from CH3OH 7−1,7–6−1,6 in blue and red contours, respectively. The SiO peaks north of IRAS 4A close to the peak redshifted emission of CH3OH and traces the shock activity in the region. No emission connected to IRAS 4C is observed. The red and blue contour levels are set to 5, 30, 50, 70, 100, and 150 × rms (rms: 0.02 K).
Current usage metrics show cumulative count of Article Views (full-text article views including HTML views, PDF and ePub downloads, according to the available data) and Abstracts Views on Vision4Press platform.
Data correspond to usage on the plateform after 2015. The current usage metrics is available 48-96 hours after online publication and is updated daily on week days.
Initial download of the metrics may take a while.