Fig. 11
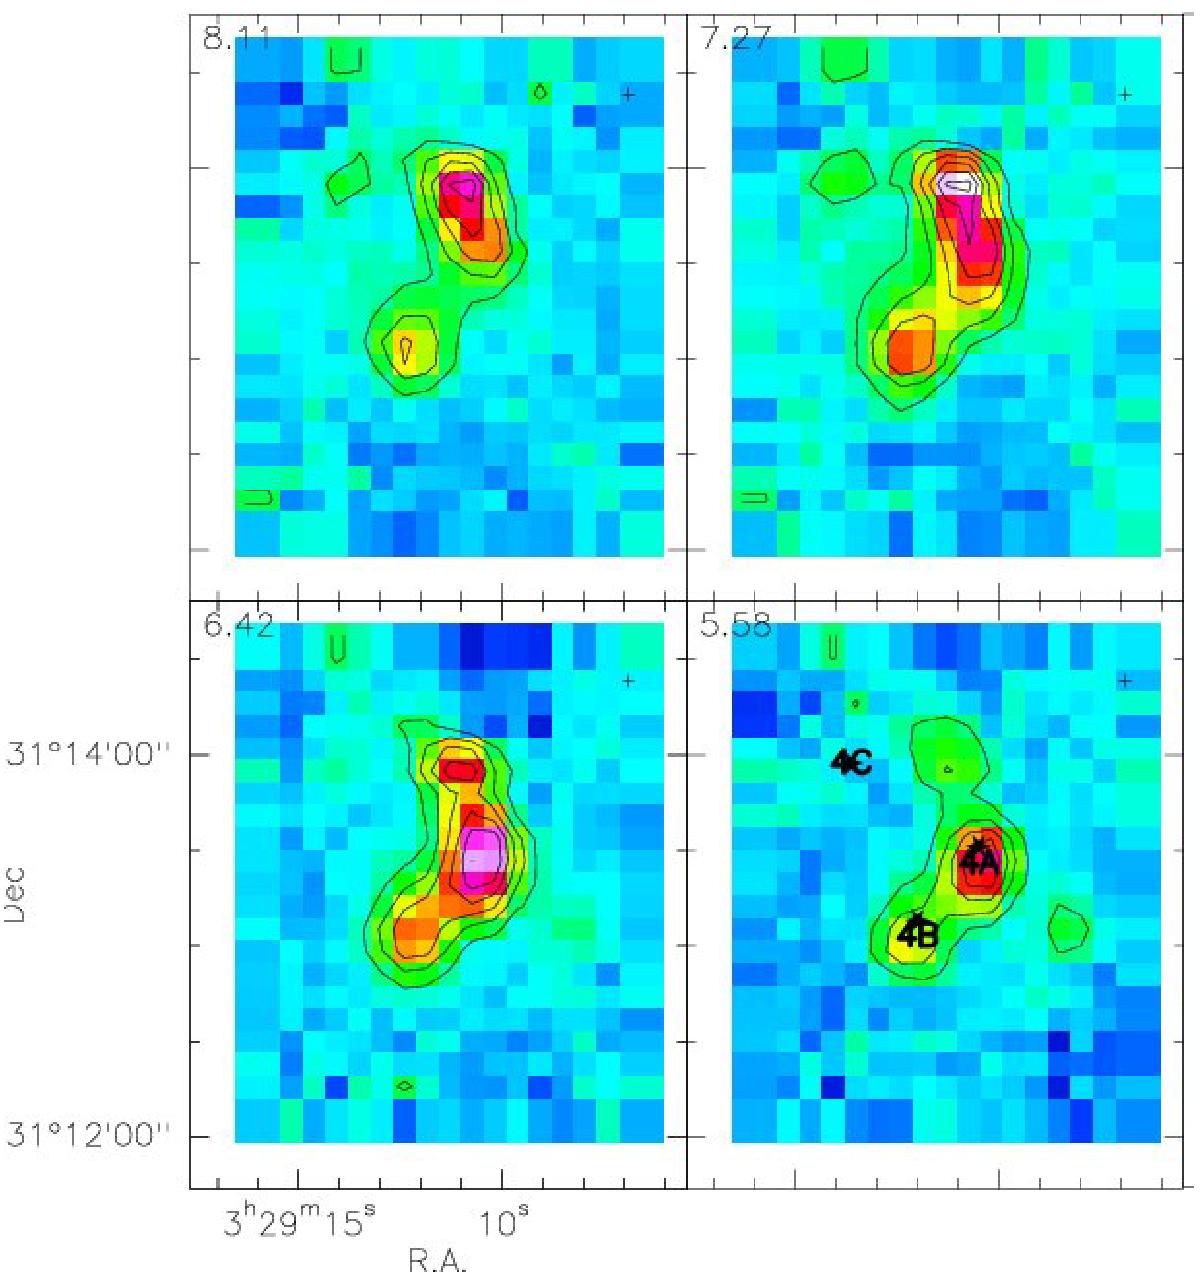
Channel maps of SO 9(8)−8(7) obtained with the JCMT, with the central velocities given in km s-1. The emission from IRAS 4C appears at higher velocity channels (from +7 to +8 km s-1), while IRAS 4-SWC is observed at lower velocity channel (+5.6 km s-1). The peak north of IRAS 4A at about +7 km s-1 can be associated with an outflow or shock from IRAS 4A.
Current usage metrics show cumulative count of Article Views (full-text article views including HTML views, PDF and ePub downloads, according to the available data) and Abstracts Views on Vision4Press platform.
Data correspond to usage on the plateform after 2015. The current usage metrics is available 48-96 hours after online publication and is updated daily on week days.
Initial download of the metrics may take a while.