


| Issue |
A&A
Volume 711, July 2026
|
|
|---|---|---|
| Article Number | A190 | |
| Number of page(s) | 7 | |
| Section | Stellar structure and evolution | |
| DOI | https://doi.org/10.1051/0004-6361/202659483 | |
| Published online | 14 July 2026 | |
Calibrating angular momentum transport in intermediate-mass stars from gravity-mode asteroseismology
II. Modelling 2937 BAF-type stars
Université Paris-Saclay, Université Paris Cité, CEA, CNRS, AIM, 91191, Gif-sur-Yvette, France
★ Corresponding author: This email address is being protected from spambots. You need JavaScript enabled to view it.
Received:
17
February
2026
Accepted:
20
June
2026
Abstract
Context. The asteroseismology of gravity-mode (g-mode) pulsators covering BAF-type stars has shown that angular momentum is redistributed during the main sequence. The efficiency of the transport, however, remains largely uncalibrated.
Aims. This aim of this paper is to exploit a sample of 2937 characterised g-mode pulsators (the largest sample to date) to place constraints on the efficiency of angular momentum transport by assuming an effective viscosity or an Eddy viscosity based on the Tayler–Spruit dynamo within a fully diffusive framework.
Methods. We computed grids of rotating stellar evolution models that we then used to simulate a population of stars by sampling from these grids with prior distributions on the mass, age, and initial rotation rate. We then compared these simulated distributions of rotation frequencies and specific angular momentum (J/M) to those of the sample of observed stars.
Results. We find that a fully diffusive framework for the transport of angular momentum during the main sequence is sufficient to explain the observed evolution of near-core rotation frequencies, the observed differential rotation, and the observed mass dependence of J/M when the effective viscosity (assumed constant) is 106 cm2 s−1 or higher. Viscosities predicted by the Tayler–Spruit dynamo are in general far above this value and can explain the data as well.
Conclusions. Future observational studies of main sequence g-mode pulsators are encouraged to measure core-to-surface rotation rates, particularly of B-type stars. For this work we have exploited the constraining potential of near-core rotation frequencies alone, while the contrast with the surface rotation would allow us to further unravel the mechanisms driving the transport.
Key words: asteroseismology / stars: evolution / stars: interiors / stars: rotation
© The Authors 2026
 Open Access article, published by EDP Sciences, under the terms of the Creative Commons Attribution License (https://creativecommons.org/licenses/by/4.0), which permits unrestricted use, distribution, and reproduction in any medium, provided the original work is properly cited.
This article is published in open access under the Subscribe to Open model. This email address is being protected from spambots. You need JavaScript enabled to view it. to support open access publication.
1. Introduction
The internal transport of angular momentum (AM) in stars can be driven by diffusive processes (magneto-hydrodynamical instabilities), advective processes (meridional circulation), a torque due to large-scale magnetic fields, and internal gravity waves (see e.g. Aerts et al. 2019 for an overview). The magnitudes of the torques generated by each of these processes is one of the largest uncertainties in current stellar evolution models. Excited gravity-mode (g-mode) pulsations in BAF-type dwarfs are powerful tools used to access rotation frequencies in the layer close to the boundary between the convective core and radiative envelope. Aerts et al. (2025) exploited a linear relation between the dominant pulsation frequency and the near-core rotation frequency, relying on the assumption that the dominant oscillation is a prograde dipole mode, as is the case for the majority of g-mode pulsators (Van Reeth et al. 2015; Li et al. 2020; Pedersen et al. 2021). Aerts (2025) presents a sample of (i) 2464 g-mode pulsators with estimated near-core rotation frequencies (model independent) by Aerts et al. (2025) and estimated masses and ages (model dependent) by Mombarg et al. (2024b), and (ii) 490 F-type g-mode pulsators with estimated near-core rotation frequencies by Li et al. (2020) and estimated masses and ages by Fritzewski et al. (2024). The sample covers stars of masses ranging from ∼1.3 M⊙ to 8.8 M⊙.
Aerts (2025) found a break in the specific angular momentum  when plotted as a function of stellar mass, where the rotation frequency Ω is assumed to be constant throughout the star. Stars with masses ≲2.5 M⊙ show a steeper mass dependence for J/M compared to stars above this mass. She suggests the break could be the result of weak magnetised stellar winds that apply an external torque on the stars below the break. However, prescriptions for mass loss rates of low-mass stars have only been calibrated up to ∼1.3 M⊙ (Matt et al. 2015). Additionally, stronger internal dynamo-driven magnetic fields in A- and F-type stars (Brun et al. 2005) compared to B-type stars can drive stronger internal AM transport. Furthermore, Aerts (2025) observes an increase in the specific AM with age for stars with masses ≳2.5 M⊙, which suggests that these stars develop differential rotation.
For a sample of 52 slowly pulsating B-type (SPB) stars, Pedersen (2022) has provided evidence that AM is being rearranged throughout the stars, investigating cases with no AM transport, instantaneous AM transport, and AM transport driven by a Tayler–Spruit (TS) dynamo, all for an initial rotation rate of 10 per cent of the critical rotation frequency. Similarly, Moyano et al. (2023) find that models including the TS dynamo better match asteroseismically derived near-core rotation frequencies of F-type pulsators (γ Doradus) compared to models that include only hydrodynamical instabilities. Slowly rotating γ Dor stars that are situated near the end of the main sequence with measured near-core and surface rotation frequencies have been used by Mombarg (2023), the first paper in this series, to calibrate the efficiency of AM transport in a fully diffusive framework. This calibration was done by assuming a constant effective viscosity or calculating the viscosity from (magneto-)hydrodynamical processes (Heger et al. 2000, 2005).
For this paper we expanded this effort from F-type stars up to B-type stars using the sample of Aerts (2025), currently the largest sample of characterised g-mode pulsators, to investigate whether stellar models with only diffusive AM transport can explain the observed distributions and what constraints can be placed on the efficiency (viscosity) of the transport. This sample contains stars that cover a large range of critical rotation rates according to the measured distributions (see Fig. 2 in Aerts 2025).
2. Method
For this paper we used the sample of Aerts (2025) that contains 2937 BAF-type g-mode pulsators with measured near-core rotation frequencies. The number of stars is slightly smaller than the sum of the two samples mentioned in the Introduction, due to duplicate stars and outliers. Previous studies that aimed at placing constraints on the efficiency of AM transport typically did this by choosing the most extreme initial conditions such that the rotation velocities of the sample (or some percentile) are contained within the fast and slow rotating models (e.g. Gallet & Bouvier 2013; Ouazzani et al. 2019; Li et al. 2020; Pedersen 2022; Moyano et al. 2023). Here, we aim to model the entire observed distributions of the rotation frequencies. This additionally requires a calibration of the initial conditions.
2.1. Initial conditions
To simulate a population of g-mode pulsators, we require priors on the initial mass, the initial rotation rate, and the efficiency of the core-boundary mixing (CBM) or also called convective core overshoot. We rely on the grid of stellar structure and evolution models computed by Mombarg et al. (2024b) with MESA r24.03.1 (Paxton et al. 2011, 2013, 2015, 2018, 2019; Jermyn et al. 2023), and compute additional grids with the same physics. The rotation is initialised at the zero age main sequence (ZAMS), starting from solid body rotation, where the angular velocity, Ω, is set to a specified fraction of the Keplerian critical rotation frequency. We do not account for any AM loss due to stellar winds. For the CBM, an exponentially decaying diffusion constant is assumed (Freytag et al. 1996),
 (1)
(1)
where the scale height is based on the local pressure scale height (HP), multiplied by a factor fCBM. The subscript ‘0’ indicates quantities evaluated at the convective interface. The grids cover masses from 1.3 to 9 M⊙ (step size between 0.1 and 1 M⊙), CBM fCBM ∈ [0.005, 0.015, 0.025], and initial rotation rates from 0.05 to 0.55 times the initial Keplerian critical rotation frequency,
 (2)
(2)
The work of Mombarg et al. (2024a) provides distributions for the mass, initial rotation, and CBM efficiency based on 539 γ Dor stars observed with the Kepler mission. The work shows that the mass distribution of γ Dor stars approximately follows a Gaussian distribution. This is because g-mode pulsations in γ Dor stars are only expected to be excited during a part of the main sequence (e.g. Dupret et al. 2004). For the more massive stars this is during the later part, while for the lower-mass stars it is the other way around. Furthermore, this Gaussian-like distribution has also been found in the γ Dor mass regime using ∼14 000 g-mode pulsators observed with Gaia and TESS (Mombarg et al. 2024b). The higher-mass SPB pulsators, however, seem to follow a Salpeter initial mass function (dN/dM ∝ M−2.35).
The distribution of the initial rotation rate (as a fraction of the critical rate) is also found to be similar to the Gaussian distribution centred around ∼0.25 by Mombarg et al. (2024a). Lastly, the probability distribution of fCBM decreases linearly with the value of fCBM, where a value of 0.005 is roughly twice as likely as a value of 0.035. For this work, we assumed that these distributions also hold for SPBs, and used them as priors to construct a synthetic population.
In the fully diffusive framework assumed here, the local AM transport is described by
 (3)
(3)
where νeff is the effective viscosity. Here, d/dt is the Lagrangian derivative,  . To facilitate future comparisons with schemes that are not fully diffusive, we can relate the effective viscosity to an AM flux, FJ, via
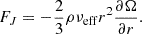 (4)
(4)
We assume shellular rotation, where the local rotation frequency depends only on the stellar radius (Zahn 1992).
2.2. Angular momentum transport
In this paper we focus on g-mode pulsators with measured near-core rotation frequencies. As shown in Fig. 10 of Mombarg (2023) for a 2 M⊙ star, the near-core rotation frequency starts to corotate with the convective core for effective viscosities above ∼ 105 cm2 s−1. Therefore, the evolution of the near-core rotation does not change when increasing the viscosity beyond this value. Moreover, to reproduce the observed near-uniform rotation profiles of γ Dor stars found by Van Reeth et al. (2018), Li et al. (2020), and Saio et al. (2021), effective viscosities higher than 2 ⋅ 105–5 ⋅ 107 cm2 s−1 are needed. A similar conclusion was reached previously by Ouazzani et al. (2019) based on the near-core rotation frequencies alone. The AM transport in the grid of Mombarg et al. (2024b) that we use here is also done in a fully diffusive description, assuming a constant effective viscosity of 106, 107, or 108 cm2 s−1.
The observational limits are illustrated in Fig. 1, where we show the effect of the viscosity on the evolution of the near-core rotation frequency, Ωnc. As can be seen in the top panel, for F-type stars any viscosity higher than order 106 cm2 s−1 will not change the evolution. For the higher-mass B-type stars (bottom panel), the limit is of the order of 107 cm2 s−1. Additionally, we also investigate AM transport via the TS dynamo as implemented in MESA r24.03.1 (and earlier versions) following Spruit (2002) and Heger et al. (2005). The viscosities predicted from the TS dynamo are typically several orders of magnitude higher than the effective viscosities covered in this work for the stars studied here, and should thus be able to drive the required AM transport.
 |
Fig. 1. Evolution of the near-core rotation frequency for initial rotation rates of 5, 30, and 55 per cent of the critical rotation frequency. The solid lines correspond to models with fCBM = 0.005; the dashed lines correspond to models with fCBM = 0.025. |
2.3. Simulating a stellar population
As mentioned, we rely on previous work of Mombarg et al. (2024a) who derived a distribution for the CBM efficiency of a large sample of g-mode pulsators. We use this distribution as our prior on the CBM efficiency,
 (5)
(5)
We assume a normal distribution of initial rotation rates (as a fraction of the initial critical rotation frequency) following Mombarg et al. (2024a) and we leave the mean  and standard deviation σω0 as free parameters to be calibrated to the observed sample,
 (6)
(6)
We sample the masses and ages according to the observed distributions. For the ages, we use the normalised hydrogen-mass fraction in the core, Xc/Xini, as a proxy. We generated a population of 1000 stars with the stellar parameters drawn from these probability density functions (PDFs). While interpolation between stellar evolution tracks with conditional normalising flows has been proven to be possible, interpolation of the stellar age remains challenging with the set-up of Mombarg et al. (2024b). Therefore, we simply selected the closest stellar model for each of the 1000 simulated stars and we performed a linear interpolation of the relevant quantities between two MESA time steps. For a given target age, using Xc/Xini, we computed the rotation frequency and radius at that point for each of the 1000 simulated stars and performed a Gaussian kernel density estimate (KDE), using the Silverman method (Silverman 1986), on the resulting distributions for Ωnc and J/M.
3. Modelling mass dependence of J/M
As mentioned, the study by Aerts (2025) shows that the mass dependence of the specific AM, estimated as  , changes around 2.5 M⊙, where the decrease in J/M with decreasing mass becomes steeper below this mass. This raises the question of whether the lower-mass stars that still have a small convective outer layer experience some external torque. Here, we investigate whether the observed J/M values can be explained without the need for any external torques.
We simulated a population of 3000 stars using the observed mass and Xc/Xini distributions as priors. As mentioned before, we assume that the initial rotation rates (expressed as a fraction of the Keplerian critical rotation frequency at the ZAMS) follow a normal distribution (Mombarg et al. 2024a), where we calibrate the mean and standard deviation of the distribution to the observations. As is shown in Li et al. (2024, their Fig. 12), the measured rotation frequencies of g-mode pulsators in the young open cluster NGC2516 are nearly constant as a function of effective temperature down to ∼7600 K. Below this temperature, a drop in the near-core rotation frequency is observed (for a handful of stars in total). Here, we find that stars below ∼1.7 M⊙ require a different initial distribution of the rotation rate ω0, with a lower average than the stars more massive than 1.7 M⊙. We take  for M ≤ 1.7 M⊙ and
  for M > 1.7 M⊙. Although the exact choice to have two mass regimes with a division at 1.7 M⊙ is somewhat arbitrary, we find indications that stars below roughly 1.7 M⊙ undergo a different rotational evolution during the pre-main sequence (e.g. AM loss via magnetised winds) that slows them down compared to stars more massive than this.
Figure 2 shows the specific AM of the observational sample and the simulated sample. In general, the simulated data are in agreement with the observational data, with some deviation at the higher-mass end where the observations are sparse. We note that no stars in the simulated population are situated above the upper limits found by Aerts (2025), indicated by the yellow and blue lines in Fig. 2. Furthermore, the simulated population contains a few stars above log M = 0.3 with lower J/M than the lower limit of the sample. These are models with an initial rotation rate of ω0 = 0.05. The ridge seen in the simulated data (grey points) is due to the discrete step size in the initial rotation rate. When we compare distributions, the use of KDEs will smooth out these discrete steps.
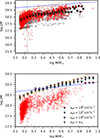 |
Fig. 2. Specific AM as a function of stellar mass. The red symbols correspond to the sample of Aerts (2025); the grey symbols correspond to the simulated sample of 3000 stars. The symbols with black outlines indicate the bin average. The blue and orange lines indicate the upper limits given by Aerts (2025). The vertical grey dashed line indicates 1.7 M⊙, diving the two mass ranges with different priors on the initial rotation rate. The symbol size scales linearly with Xc/Xini. The bottom panel shows the upper limits in the grids for different values of viscosity. |
The physical upper limits on J/M of the models in the grid show us that stars exist above the upper limit given by Aerts (2025) for M > 2.5 M⊙, as shown by the triangles in the bottom panel of Fig. 2. Increasing the effective viscosity means less differential rotation, and thus the upper limit moves closer to the yellow line in Fig. 2. If in the future the sample can be complimented with stars more massive than ∼6 M⊙, it could be possible to place upper limits on the viscosity. For now, the data does not allow us to make any distinction between the viscosities tested in this work. We conclude that no external torques are required to explain the data of Aerts (2025).
4. Modelling time evolution of Ω and J/M
We started with the stars with masses ≥1.7 M⊙, of which there are 702 in the sample. We considered the grid with a constant viscosity νeff = 107 cm2 s−1. Sampling a population of 1000 stars from the observed mass and Xc/Xini distributions, we find that a normal distribution of the initial rotation frequencies at the ZAMS with  reproduces the observed J/M values quite well. We truncated the normal distribution between
  and 0.55, given the limits of our grids. Figure 3 shows the predicted distribution of near-core rotation frequencies across the main sequence in comparison with the observations from Aerts (2025). We find a decrease in the average near-core rotation frequency per Xc/Xini-bin that is similar to the observed value. In addition, the most extreme cases are also well modelled with our assumption of the initial rotation frequencies at the ZAMS. This is more clearly visible in Fig. 4, where the kernel density estimates (KDEs) of the Ωnc distributions are shown for five sections along the main sequence.
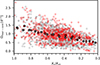 |
Fig. 3. Near-core rotation frequencies vs normalised hydrogen-mass fraction in the core (age proxy). The red symbols show the sample of Aerts (2025); the grey points show a simulated population of 1000 stars assuming a constant viscosity νeff = 107 cm2 s−1. The symbols with black edges indicate the bin averaged values, where the bin size is computed according to Scott’s rule. |
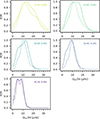 |
Fig. 4. Distributions of the near-core rotation frequency for five Xc/Xini bins across the main sequence. The dashed lines indicate the sample of Aerts (2025), and the solid lines indicate the simulated population assuming a constant viscosity νeff = 107 cm2 s−1. |
To make a statistically emphasised conclusion of whether the observed and simulated PDFs are consistent, we performed two-sample Kolmogorov–Smirnov (KS) tests and assumed the distributions are not drawn from the same underlying PDF if the p-value is lower than 0.05. For each age (Xc/Xini) bin, we constructed distributions of the rotation frequencies and specific AMs. According to the p-values from the two-sample KS tests, the simulated distributions of the specific AMs are consistent with observed distributions across the main sequence, as shown in Fig. 5. In other words, our priors on the mass, CBM, and initial rotation, as well as the assumed efficiency of the angular momentum transport are accurate enough to explain all available data on the 702 g-mode pulsators more massive than 1.7 M⊙. The p-values that we find for the Ωnc distributions show that the simulated distributions are mostly consistent with the observed (model-independent) ones.
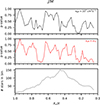 |
Fig. 5. p-value of two-sample KS tests for the observed and simulated sample using a sliding Xc/Xini bin of size 0.1. The upper panel corresponds to the grid with constant viscosity, the bottom panel to the grid with the TS dynamo. We reject the hypothesis that the observed and simulated J/M distributions are different if the p-value is below 0.05, indicated by the horizontal dashed line. |
We find that decreasing or increasing the viscosity by one order of magnitude does not change the resulting Ωnc and J/M distributions much. For the values of the effective viscosity tested here, only stars with masses ≳7 M⊙ and high initial rotation rates show differences in the near-core rotation frequency larger than the average observational uncertainty towards the very end of the main sequence (cf. Fig. 1). Such stars, however, are very uncommon in the sample.
5. Modelling differential rotation
Although it is not easy to directly measure surface rotation frequencies of B-type stars with asteroseismology, we also make predictions for the level of radial differential rotation. Figure 6 shows the predicted distribution of core-to-surface rotation rates as a function of mass for a population of 1000 stars. As can been seen in panel (b), for a constant νeff = 107 cm2 s−1, stars below roughly 3 M⊙ show very low levels of differential rotation and for masses below 9 M⊙ we expect most stars to have Ωnc/Ωsurf < 1.3. A viscosity ten times smaller (larger) yields differential rotation rates mostly below Ωnc/Ωsurf < 2 (1.08). In the case of the TS dynamo, the highest level of differential rotation in the simulated population is expected around 4 M⊙ and Ωnc/Ωsurf ≲ 1.2. In the models, however, the level of differential rotation that is developing is similar across mass (slightly lower for the lowest masses). Therefore, the peak in the simulated population is the result of the fact that the number of stars in the sample Aerts (2025) sharply decreases around 4 M⊙. This highlights how observed measurements can be misinterpreted if they are only compared to theoretical upper and lower limits. We also note that the level of differential rotation in the models with the TS dynamo decreases with the rotation frequency, as is expected from the dependence of the predicted viscosity on the rotation frequency. Future studies of g-mode pulsators on the main sequence should focus on populating such diagrams in order to further improve the verification of the theoretically predicted viscosities linked to the TS dynamo. In any case, the majority of stars is still expected to be close to uniform rotation as shown in Fig. 6. In the case of a few γ Dor stars, the ratio of the near-core rotation frequency to the rotation frequency of the convective core itself has been measured (Saio et al. 2021, not used in this study). Moyano et al. (2024) argue that, based on these ratios, the prescription of the TS dynamo of Spruit (2002) is too efficient and that the associated viscosity needs to be scaled down by roughly three orders of magnitude.
 |
Fig. 6. Ratio of the near-core rotation frequency to the average surface rotation frequency as a function of stellar mass for a simulated population of 1000 stars for different assumptions on the AM transport. The symbol size scales linearly with Xc/Xini |
Although no direct surface rotation frequencies are available, the sample of Aerts et al. (2025) also contains 969 stars for which the projected surface rotation frequency Ωsurf sin i could be estimated from the Gaia vbroad measurements as it provides an approximation of R★Ωsurf ⋅ sin i, where the radius estimate comes from Mombarg et al. (2024b). We simulate another population of 1000 stars with masses between 1.4 and 4.5 M⊙, corresponding to the masses covered in this subsample of Aerts et al. (2025). For each star in the simulated population, we generate an inclination by uniformly sampling in cos i ∼ U(0, 1) and computing  . We note, however, that in principle prograde dipole modes are not expected to be observed close to 0° due to cancellation effects. We find that our synthetic population mostly shows Ωnc/(Ωsurf sin i) ratios close to one, while the sample of Aerts et al. (2025) peaks around 1.15, as shown in Fig. 7. The observations suggest that there is a small degree of differential rotation. In order to have the models develop this level of differential rotation, viscosities lower than νeff = 106 cm2 s−1 are required. There is some tension between the variance in the simulated population compared to the observed population. We note, however, that the measurement of Ωnc/(Ωsurf sin i) has large uncertainties (Aerts 2025) and that the (near-)core-to-surface rotation ratios derived by Van Reeth et al. (2018), Li et al. (2020), and Saio et al. (2021) are close to one.
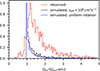 |
Fig. 7. Observed and simulated distributions of the near-core rotation frequency to the projected surface rotation frequency. The assumed effective viscosity here is νeff = 106 cm2 s−1. The blue line shows the distribution that we expect when the stars are uniformly rotating, with a uniform distribution of the inclination. |
Since the sample is dominated by lower-mass stars, varying the viscosity within the range that we study here does not significantly change the resulting distribution. The distribution resulting from the TS grid is indistinguishable from uniform rotation. Furthermore, because the measurement of the projected surface rotation frequency comes from the observed rotational broadening, it is likely that this subsample of stars with measured surface rotation velocities is biased towards fast(er) rotating stars.
6. Rotational chemical mixing
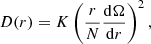
In this section we look at the chemical mixing. If the chemical diffusion coefficient were equal to the effective viscosities that we explore here, many of the models would experience chemically homogenous evolution. Therefore, we consider that the chemical diffusion coefficient is different from the effective viscosity, where the chemical mixing is driven by classical rotational mixing. We have applied a form of rotational chemical mixing in our stellar models following the works of Zahn (1992) and Chaboyer & Zahn (1992), where the chemical diffusion coefficient scales as
 (7)
(7)
where K is the thermal diffusivity and N is the Brunt-Väisälä frequency. We do not assume any minimum shear for this shear instability to be active. Since the mixing efficiency scales with the gradient of the rotation profile, it is dependent on the efficiency of AM transport. The nitrogen-14 isotope is a useful tracer of the internal mixing as massive stars build up a nitrogen-14 excess in the convective core as a result of the CNO cycle. If the mixing is efficient enough, the abundance at the surface can be enriched with material from the core. For an effective viscosity of νeff = 106 cm2 s−1, we predict that a small fraction of the (more massive) stars in the sample should have a measurable overabundance of nitrogen-14 at the surface, as shown in Fig. 8. The range covered is consistent with spectroscopic measurements of SPBs carried out by Gebruers et al. (2021), even though their sample size is rather small. The higher values of the effective viscosity do not result in any changes to the nitrogen-14 surface abundance throughout the main sequence.
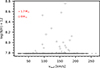 |
Fig. 8. Simulated nitrogen-14 surface abundance as a function of the surface rotation velocity at the equator for a population of 1000 stars, assuming an effective viscosity of νeff = 106 cm2 s−1. The symbol sizes scale with the stellar mass. Most models do not show any enhancement at the surface compared to the baseline around 7.8 for Z = 0.014 and a solar composition as per Asplund et al. (2009). |
7. Conclusion
We have used a sample of 2937 g-mode pulsators from Aerts (2025) with characterised masses and ages (Mombarg et al. 2024b) and near-core rotation frequencies (Aerts et al. 2025), covering masses between 1.3 to 8.8 M⊙, to place constraints on the efficiency of AM transport on the main sequence. Assuming AM is transported via diffusive processes only, where the efficiency is given by a constant effective viscosity, we find that viscosities of the order of ∼106 cm2 s−1 can explain the observed evolution of the near-core rotation frequencies of g-mode pulsators. Additional models with viscosities predicted by the TS dynamo show that they meet this requirement of sufficiently large viscosity. Using the assumption of uniform rotation at the ZAMS, we can explain the data with initial critical rotation rates that follow a normal distribution, where there is a dichotomy between stars above and below 1.7 M⊙. Future observational studies of main sequence g-mode pulsators should focus on measuring core-to-surface rotation rates (or rotation profiles via inversion techniques), particularly of B-type stars, as in this work we have fully exploited the constraining potential of near-core rotation frequencies alone. From the theoretical point of view, stellar models including different parametrisations for the transport of AM and chemical mixing have to be computed (e.g. Talon & Charbonnel 2005; Fuller et al. 2019). The predicted flux of AM must then be compared to the flux corresponding to the value of the effective viscosity that we calibrate in this paper. This would allow us to rule out or confirm the possible action of the investigated mechanism.
Data availability
The grids of MESA models are available on Zenodo at: https://zenodo.org/records/20731921
Acknowledgments
We thank the anonymous referee for the remarks on the manuscript. We also thank Conny Aerts for the useful discussions. The research leading to these results has received funding from the European Research Council (ERC) under the Horizon Europe programme (Synergy Grant agreement N°101071505: 4D-STAR). While partially funded by the European Union, views and opinions expressed are however those of the authors only and do not necessarily reflect those of the European Union or the European Research Council. Neither the European Union nor the granting authority can be held responsible for them. The computational resources and services used in this work were provided by the VSC (Flemish Supercomputer Center), funded by the Research Foundation - Flanders (FWO) and the Flemish Government department EWI. S.M. acknowledges support from the PLATO CNES grant at CEA-irfu/DAp. This research made use of the numpy (Harris et al. 2020) and matplotlib (Hunter 2007) Python software packages.
References
- Aerts, C. 2025, A&A, 704, A332 [NASA ADS] [CrossRef] [EDP Sciences] [Google Scholar]
- Aerts, C., Mathis, S., & Rogers, T. M. 2019, ARA&A, 57, 35 [Google Scholar]
- Aerts, C., Van Reeth, T., Mombarg, J. S. G., & Hey, D. 2025, A&A, 698, C3 [NASA ADS] [CrossRef] [EDP Sciences] [Google Scholar]
- Asplund, M., Grevesse, N., Sauval, A. J., & Scott, P. 2009, ARA&A, 47, 481 [NASA ADS] [CrossRef] [Google Scholar]
- Brun, A. S., Browning, M. K., & Toomre, J. 2005, ApJ, 629, 461 [Google Scholar]
- Chaboyer, B., & Zahn, J. P. 1992, A&A, 253, 173 [NASA ADS] [Google Scholar]
- Dupret, M. A., Grigahcène, A., Garrido, R., Gabriel, M., & Scuflaire, R. 2004, A&A, 414, L17 [NASA ADS] [CrossRef] [EDP Sciences] [Google Scholar]
- Freytag, B., Ludwig, H. G., & Steffen, M. 1996, A&A, 313, 497 [NASA ADS] [Google Scholar]
- Fritzewski, D. J., Aerts, C., Mombarg, J. S. G., Gossage, S., & Van Reeth, T. 2024, A&A, 684, A112 [NASA ADS] [CrossRef] [EDP Sciences] [Google Scholar]
- Fuller, J., Piro, A. L., & Jermyn, A. S. 2019, MNRAS, 485, 3661 [NASA ADS] [Google Scholar]
- Gallet, F., & Bouvier, J. 2013, A&A, 556, A36 [NASA ADS] [CrossRef] [EDP Sciences] [Google Scholar]
- Gebruers, S., Straumit, I., Tkachenko, A., et al. 2021, A&A, 650, A151 [NASA ADS] [CrossRef] [EDP Sciences] [Google Scholar]
- Harris, C. R., Millman, K. J., van der Walt, S. J., et al. 2020, Nature, 585, 357 [NASA ADS] [CrossRef] [Google Scholar]
- Heger, A., Langer, N., & Woosley, S. E. 2000, ApJ, 528, 368 [NASA ADS] [CrossRef] [Google Scholar]
- Heger, A., Woosley, S. E., & Spruit, H. C. 2005, ApJ, 626, 350 [Google Scholar]
- Hunter, J. D. 2007, Comput. Sci. Eng., 9, 90 [NASA ADS] [CrossRef] [Google Scholar]
- Jermyn, A. S., Bauer, E. B., Schwab, J., et al. 2023, ApJS, 265, 15 [NASA ADS] [CrossRef] [Google Scholar]
- Li, G., Van Reeth, T., Bedding, T. R., et al. 2020, MNRAS, 491, 3586 [Google Scholar]
- Li, G., Aerts, C., Bedding, T. R., et al. 2024, A&A, 686, A142 [NASA ADS] [CrossRef] [EDP Sciences] [Google Scholar]
- Matt, S. P., Brun, A. S., Baraffe, I., Bouvier, J., & Chabrier, G. 2015, ApJ, 799, L23 [Google Scholar]
- Mombarg, J. S. G. 2023, A&A, 677, A63 [NASA ADS] [CrossRef] [EDP Sciences] [Google Scholar]
- Mombarg, J. S. G., Aerts, C., & Molenberghs, G. 2024a, A&A, 685, A21 [NASA ADS] [CrossRef] [EDP Sciences] [Google Scholar]
- Mombarg, J. S. G., Aerts, C., Van Reeth, T., & Hey, D. 2024b, A&A, 691, A131 [NASA ADS] [CrossRef] [EDP Sciences] [Google Scholar]
- Moyano, F. D., Eggenberger, P., Salmon, S. J. A. J., Mombarg, J. S. G., & Ekström, S. 2023, A&A, 677, A6 [NASA ADS] [CrossRef] [EDP Sciences] [Google Scholar]
- Moyano, F. D., Eggenberger, P., & Salmon, S. J. A. J. 2024, A&A, 681, L16 [NASA ADS] [CrossRef] [EDP Sciences] [Google Scholar]
- Ouazzani, R. M., Marques, J. P., Goupil, M. J., et al. 2019, A&A, 626, A121 [NASA ADS] [CrossRef] [EDP Sciences] [Google Scholar]
- Paxton, B., Bildsten, L., Dotter, A., et al. 2011, ApJS, 192, 3 [Google Scholar]
- Paxton, B., Cantiello, M., Arras, P., et al. 2013, ApJS, 208, 4 [Google Scholar]
- Paxton, B., Marchant, P., Schwab, J., et al. 2015, ApJS, 220, 15 [Google Scholar]
- Paxton, B., Schwab, J., Bauer, E. B., et al. 2018, ApJS, 234, 34 [NASA ADS] [CrossRef] [Google Scholar]
- Paxton, B., Smolec, R., Schwab, J., et al. 2019, ApJS, 243, 10 [Google Scholar]
- Pedersen, M. G. 2022, ApJ, 940, 49 [NASA ADS] [CrossRef] [Google Scholar]
- Pedersen, M. G., Aerts, C., Pápics, P. I., et al. 2021, Nat. Astron., 5, 715 [NASA ADS] [CrossRef] [Google Scholar]
- Saio, H., Takata, M., Lee, U., Li, G., & Van Reeth, T. 2021, MNRAS, 502, 5856 [Google Scholar]
- Silverman, B. W. 1986, in Density Estimation for Statistics and Data Analysis, (London: Chapman and Hall), Monogr. Stat. Appl. Probab., 26 [Google Scholar]
- Spruit, H. C. 2002, A&A, 381, 923 [CrossRef] [EDP Sciences] [Google Scholar]
- Talon, S., & Charbonnel, C. 2005, A&A, 440, 981 [NASA ADS] [CrossRef] [EDP Sciences] [Google Scholar]
- Van Reeth, T., Tkachenko, A., Aerts, C., et al. 2015, ApJS, 218, 27 [Google Scholar]
- Van Reeth, T., Mombarg, J. S. G., Mathis, S., et al. 2018, A&A, 618, A24 [NASA ADS] [EDP Sciences] [Google Scholar]
- Zahn, J. P. 1992, A&A, 265, 115 [NASA ADS] [Google Scholar]
All Figures
|
Fig. 1. Evolution of the near-core rotation frequency for initial rotation rates of 5, 30, and 55 per cent of the critical rotation frequency. The solid lines correspond to models with fCBM = 0.005; the dashed lines correspond to models with fCBM = 0.025. |
| In the text | |
|
Fig. 2. Specific AM as a function of stellar mass. The red symbols correspond to the sample of Aerts (2025); the grey symbols correspond to the simulated sample of 3000 stars. The symbols with black outlines indicate the bin average. The blue and orange lines indicate the upper limits given by Aerts (2025). The vertical grey dashed line indicates 1.7 M⊙, diving the two mass ranges with different priors on the initial rotation rate. The symbol size scales linearly with Xc/Xini. The bottom panel shows the upper limits in the grids for different values of viscosity. |
| In the text | |
|
Fig. 3. Near-core rotation frequencies vs normalised hydrogen-mass fraction in the core (age proxy). The red symbols show the sample of Aerts (2025); the grey points show a simulated population of 1000 stars assuming a constant viscosity νeff = 107 cm2 s−1. The symbols with black edges indicate the bin averaged values, where the bin size is computed according to Scott’s rule. |
| In the text | |
|
Fig. 4. Distributions of the near-core rotation frequency for five Xc/Xini bins across the main sequence. The dashed lines indicate the sample of Aerts (2025), and the solid lines indicate the simulated population assuming a constant viscosity νeff = 107 cm2 s−1. |
| In the text | |
|
Fig. 5. p-value of two-sample KS tests for the observed and simulated sample using a sliding Xc/Xini bin of size 0.1. The upper panel corresponds to the grid with constant viscosity, the bottom panel to the grid with the TS dynamo. We reject the hypothesis that the observed and simulated J/M distributions are different if the p-value is below 0.05, indicated by the horizontal dashed line. |
| In the text | |
|
Fig. 6. Ratio of the near-core rotation frequency to the average surface rotation frequency as a function of stellar mass for a simulated population of 1000 stars for different assumptions on the AM transport. The symbol size scales linearly with Xc/Xini |
| In the text | |
|
Fig. 7. Observed and simulated distributions of the near-core rotation frequency to the projected surface rotation frequency. The assumed effective viscosity here is νeff = 106 cm2 s−1. The blue line shows the distribution that we expect when the stars are uniformly rotating, with a uniform distribution of the inclination. |
| In the text | |
|
Fig. 8. Simulated nitrogen-14 surface abundance as a function of the surface rotation velocity at the equator for a population of 1000 stars, assuming an effective viscosity of νeff = 106 cm2 s−1. The symbol sizes scale with the stellar mass. Most models do not show any enhancement at the surface compared to the baseline around 7.8 for Z = 0.014 and a solar composition as per Asplund et al. (2009). |
| In the text | |
Current usage metrics show cumulative count of Article Views (full-text article views including HTML views, PDF and ePub downloads, according to the available data) and Abstracts Views on Vision4Press platform.
Data correspond to usage on the plateform after 2015. The current usage metrics is available 48-96 hours after online publication and is updated daily on week days.
Initial download of the metrics may take a while.