


| Issue |
A&A
Volume 711, July 2026
|
|
|---|---|---|
| Article Number | A253 | |
| Number of page(s) | 15 | |
| Section | Interstellar and circumstellar matter | |
| DOI | https://doi.org/10.1051/0004-6361/202659263 | |
| Published online | 21 July 2026 | |
Gas kinematics in 70 μm dark molecular clumps with ammonia
1
Guangxi Key Laboratory for Relativistic Astrophysics, School of Physical Science and Technology, Guangxi University,
Nanning
530004,
PR China
2
School of Astronomy and Space Science, Nanjing University,
163 Xianlin Avenue,
Nanjing
210023,
PR China
3
Key Laboratory of Modern Astronomy and Astrophysics (Nanjing University), Ministry of Education,
Nanjing
210023,
PR China
4
Korea Astronomy and Space Science Institute,
No. 776, Daedeok-daero, Yuseong-gu,
Daejeon,
Republic of Korea
5
Department of Astronomy, Xiamen University,
Zengcuo’an West Road,
Xiamen
361005,
China
6
Department of Earth, Environment, and Physics, Worcester State University,
Worcester,
MA
01602,
USA
7
Center for Astrophysics Harvard & Smithsonian,
60 Garden Street,
Cambridge,
MA
02138,
USA
8
Shanghai Astronomical Observatory, Chinese Academy of Sciences,
80 Nandan Road,
Shanghai
200030,
China
9
State Key Laboratory of Radio Astronomy and Technology,
A20 Datun Road, Chaoyang District,
Beijing
100101,
PR China
★ Corresponding authors: This email address is being protected from spambots. You need JavaScript enabled to view it.
; This email address is being protected from spambots. You need JavaScript enabled to view it.
Received:
2
February
2026
Accepted:
10
June
2026
Abstract
We present an investigation of the gas kinematics and an assessment of the evolutionary stages of dense cores embedded in four infrared dark clouds (IRDCs) using the NH3(1,1) and NH3(2,2) lines obtained from the VLA and GBT observations. There is no 1.3 cm continuum emission counterpart in 1.3 mm continuum emission revealed by the SMA toward these IRDCs. The low production rate of Nuv ~ 1044 s−1 for the Lyman continuum photons indicates that the four IRDCs are in very early evolutionary stages, where free-free emission is still absent. We identified 61 dense cores at the size scale of ~0.1 pc using the inner satellite groups of NH3(1,1) line. Among them, 38 dense cores exhibit a single velocity component, while 23 dense cores show multiple velocity components. We find that the nonthermal velocity dispersion (σnon) increases with an increasing radial distance from the center of dense core within the inner 0.1 pc toward eight dense cores, indicating that the turbulence is likely dissipated toward the center of these dense cores. In addition, two dense cores in AGAL031.024+00.262 and one core in AGAL024.314+00.086 exhibit nearly sonic motions on a small scale of 0.01 pc. The weakening of nonthermal support against gravity suggests that these dense cores are close to gravitational collapse or are already undergoing collapse. Conversely, there are seven dense cores in AGAL031.024+00.262 displaying a decrease in σnon with increasing radial distance from the center. By comparing this trend with the outflow revealed by CO J=2–1 line, we find that these cores are likely associated with embedded star formation activities. Higher angular resolution observations on subparsec scales are essential to reveal the transition from thermal- to nonthermal-dominated regions, especially in dense cores associated with multiple velocity components.
Key words: stars: formation / stars: protostars / ISM: clouds / ISM: kinematics and dynamics / infrared: ISM
© The Authors 2026
 Open Access article, published by EDP Sciences, under the terms of the Creative Commons Attribution License (https://creativecommons.org/licenses/by/4.0), which permits unrestricted use, distribution, and reproduction in any medium, provided the original work is properly cited.
This article is published in open access under the Subscribe to Open model. This email address is being protected from spambots. You need JavaScript enabled to view it. to support open access publication.
1 Introduction
Star formation occurs through the collapse of dense cores within molecular clouds (Zinnecker & Yorke 2007; Motte et al. 2018). In the early stages, nonthermal motions or turbulence within dense cores play an important role by providing support against gravity (McKee & Ostriker 2007). However, once turbulence dissipates on small spatial scales of less than 0.1 pc, thermal motions can become the dominant source of support (Myers & Lazarian 1998; Williams & Myers 2000). This transition accelerates the onset of gravitational collapse, making it crucial to determine the evolutionary phase of the dense cores. To investigate turbulence dissipation, it is necessary to characterize the physical environment of dense cores, particularly their kinematic properties prior to star formation (e.g., Tatematsu et al. 2014; Ohashi et al. 2016; Li et al. 2020b). Prestellar cores, the immediate precursors of protostellar cores, are deeply embedded within protoclusters, which makes them difficult to observe directly during very early stage (Rathborne et al. 2006; Bergin & Tafalla 2007). Before the onset of collapse, the formation mechanisms of high-mass prestellar cores remain far less understood than those of low-mass cores, largely because of the limited observational constraints available for these earliest evolutionary stages (Beuther et al. 2025).
Infrared dark clouds (IRDCs) are considered potential sites for the early stage of star formation and have been extensively studied in recent decades (Bergin & Tafalla 2007; Zhang & Wang 2011; Battersby et al. 2014; Li et al. 2019; Sanhueza et al. 2019; Li et al. 2020b). Egan et al. (1998) first used the 8 μm dust data from the mid-IR survey conducted by the Midcourse Space Experiment (MSX) to identify numerous small, cold, and dense clouds. Building on this result, Carey et al. (1998) conducted rotational line observations of H2CO to investigate the physical properties of ten MSX dark clouds, confirming a temperature of 20 K and volume density of 105 cm−3. Peretto & Fuller (2009) utilized the Spitzer GLIMPSE and MIPSGAL data to further identify Spitzer dark clouds, 80% of which were previously undetected in the MSX dark clouds. Molinari et al. (2010) used the Herschel data across five longer wavelengths obtained from the Hi-GAL survey. Based on the catalog by Schuller et al. (2009) using the Atacama Pathfinder Experiment (APEX) surveys towards the Galaxy at 870 μm, observations with high spatial resolution provided more detailed features of the clumps through interferometric arrays (e.g., Sanhueza et al. 2019; Towner et al. 2021; Pandian et al. 2024, etc.). Most research focuses on the fragmentation from parsec to subparsec scales towards massive clumps, offering a series of snapshots of different evolutionary stages of IRDCs (Wang et al. 2014 Svoboda et al. 2019; Avison et al. 2023). Furthermore, attention is given to the condensed regions of clumps that are perceived as prestellar cores. Systematic analysis of dense cores in IRDCs, including their kinematics and dynamics, has unveiled the initial conditions of the early stages through dust and molecular line emission (Devine et al. 2011; Dirienzo et al. 2015; Li et al. 2020a; Pillai et al. 2023; Li et al. 2023).
A recent study by Li et al. (2019) reported the results of seven 70 μm IRDCs from SMA observations. Forty-four dense cores were identified by the 1.3 mm continuum and 12CO J=2–1 and C18O J=2–1 were employed to study the dynamical property. Nine dense cores have masses exceeding 27 M⊙, potentially leading to the formation of massive stars in the protoclusters assuming 30% of core star formation efficiency. CO outflows were detected in seventeen dense cores, which are distributed in 6 out of 7 clumps, indicating that these 70 μm dark clumps are not quiescent. The spectral lines of HCN J=3–2 and HCO+ J=3–2 are simultaneously detected in compact regions (e.g., MM 1 and MM 7 in AGAL031.024+00.262). The C-bearing molecules generally freeze out on the surface of dust at temperatures below 20 K, leading to underestimated abundances (Goldsmith 2001; Caselli & Ceccarelli 2012; Caselli et al. 2022). However, N-bearing species such as NH3 and N2H+ are largely unaffected in similar environments and are widely used to study the properties of dense cores (Hily-Blant et al. 2010; Friesen et al. 2010; Hacar et al. 2017). The inversion line ratios of NH3(1,1) and NH3(2,2) have been commonly used in other clouds to determine the kinetic temperature of dense gas in cold regions (~15 K) (Ho & Townes 1983; Tafalla et al. 2004; Lu et al. 2014; Bőgner et al. 2022). Moreover, the intrinsic offset width of the hyperfine structure is not affected by feedback and turbulence, provided that it serves as a tracer for the kinematics of the clumps (e.g., Wienen et al. 2012, 2015; Sepúlveda et al. 2020). In particular, the kinematic properties of ammonia in dense regions of IRDCs at early evolutionary stages provide a powerful diagnostic for identifying turbulence dissipation and for further confirming the gravitational collapse of dense cores leading to star formation (Myers & Lazarian 1998; Wang et al. 2008). To characterize the initial internal kinematics of dense cores and evaluate the role of nonthermal and thermal support in the early phases of dense cores, we used ammonia transitions to probe the kinematics of dense gas in 70 μm IRDCs.
We selected four sources from the original sample of seven presented in Li et al. (2019) and updated their distances using the method established by Reid et al. (2019). The remaining three 70 μm IRDCs were excluded because the VLA observations of AGAL016.418–00.634 suffer from significant missing flux and lack complementary GBT data. The VLA data for AGAL008.691–00.401 are of relatively poor quality and AGAL030.844+00.177 was not observed in this work. In this study, we used the NH3(1,1) and NH3(2,2) data obtained from the combined VLA and GBT observations to investigate the kinematics of dense cores identified from the ammonia emission. This paper is organized as follows. In Sect. 2, we describe the VLA and GBT observations and data reduction. Sect. 3 presents the methods used for the analysis of the ammonia lines. Sect. 4 presents the results from the continuum and ammonia line observations. The kinematic properties are discussed in Sect. 5 and are summarized in Sect. 6.
Summary of observations.
2 Observation and data reduction
2.1 Very Large Array observations
These VLA observations in the K band via the D-array configuration were carried out in 2018 November and October and in 2021 April, March, and June (Project code: 18A-250 and 21A-128, PI: Shanghuo Li). Ammonia inversion transitions of NH3(J,K)=(1,1) at 23.6944955 GHz and NH3(J,K)=(2,2) at 23.7226333 GHz were simultaneously observed in four sources. The 8 MHz bandwidth consists of 1024 channels with a channel width of 7.812 kHz, corresponding to a velocity resolution of 0.1 km s−1 at 23.7 GHz in dual-polarization mode. For the continuum bandwidth of 128 MHz, there are 64 channels per 2 MHz. A total of 14 spectral windows (SPWs) were combined for the continuum, resulting in about 1.6 GHz line-free bandwidth for imaging the 1.3 cm continuum.
The calibration and imaging of data are based on the CASA 6.5.4 software package (CASA Team 2022). We used the same calibrator for every IRDC listed in Table 1. AGAL031.024+00.262 was observed in two projects that were combined to a uvdata with noise weighting. To achieve a high signal-to-noise ratio (S/N), we used natural weighting to image the 1.3 cm continuum. The beam parameters are provided in the last column of Table 1.
2.2 GBT archive data
The Radio Ammonia Mid-Plane Survey (RAMPS) was conducted between March 16, 2014 and January 31, 2019 using the 100 m Robert C. Byrd Green Bank Telescope (GBT; Hogge et al. 2018). The pilot survey was mapping the first quadrant of the Galaxy (1 = 10°–40°, |b|<0.4°), including four sources of VLA observation. The K-band Focal Plane Array (KFPA) consists of seven receivers, covering a frequency range of 18–27.5 GHz. The observations were conducted with a spectral resolution corresponding to a channel width of 1.4 kHz, providing a velocity resolution of 0.018 km s−1 at the rest frequency of NH3(1,1). At this frequency, each receiver has a beam size of approximately 34″, corresponding to the full width at half maximum (FWHM) of a Gaussian beam. Further details can be found in Hogge et al. (2018).
2.3 Combine VLA data and GBT data
To mitigate the missing-flux problem inherent to interferometric observations, we followed an established procedure that combines single-dish data and interferometer data1. The procedure is carried out in the uv domain that has pseudo visibility generated from the GBT cube using the MIRIAD software package and then joined to interferometric visibilities to the image (Sault et al. 1995). We first used the regrid task to match the spatial resolution and spectral resolution of GBT data and VLA data. The pseudo visibility was origin from the result of uvrandom and uvmodel tasks after deconvolution for the GBT cube. Next, the inverse Fourier transform of the combined visibility in the invert task product generated a dirty image. We applied a robust weighting of 0.5 for AGAL014.492–00.139 and AGAL022.376+00.447 to effectively suppress sidelobe contamination, along with a robust weighting of 1.5 for AGAL024.314+00.086 and AGAL031.024+00.262 to better recover extended emission during the clean task. The final images were produced using the restor task, which uses the clean beam to convolve the clean model.
After combining the VLA and GBT data, more than 90% of the total flux in ammonia lines was recovered. For each IRDC, we smoothed the original elliptical synthesized beam along its major axis to obtain a circle, independently of the beam direction. The resulting beam sizes are listed in Table 1. Following the order of the source names in the table, the root mean square (rms) noise levels in the line-free channels of the NH3(1,1) line are approximately 0.4, 0.2, 0.5, and 0.2 K per channel of 0.3 km s−1, respectively.
3 Methods
The NH3 (1,1) and NH3 (2,2) inversion transitions were used to derive the kinematic properties of the four clumps. The field of view of the VLA observations is about three times larger than previous observations of these clumps from the SMA (Li et al. 2019), allowing us to trace more extended structures. We employed the combined VLA and GBT data for the subsequent analysis.
3.1 Extracted structures from the NH3(1,1) inner satellite group
Dense gas structures can be traced by both dust continuum emission and ammonia line emission. Before applying optical-depth corrections, the integrated intensity distribution of the NH3(1,1) main components, which are generally optically thick, does not reliably reflect the underlying gas density structure (see Sect. 5.3 for a detailed discussion). To compare the physical properties of dense cores identified from the continuum and ammonia data, we extracted dense cores from the intensity map of the NH3(1,1) inner satellite line using the dendrogram algorithm (Rosolowsky et al. 2008b), as shown in Fig. 1.
In the astrodendro framework2, structures are hierarchically identified as “leaves,” “branches,” and “trunks,” corresponding to substructures, intermediate structures, and the overall emission, respectively. A leaf represents an individual structure that satisfies a minimum intensity threshold, a peak intensity criterion, and a minimum difference from σ, where σ is the noise level of the velocity-integrated intensity, calculated as rms · ![Mathematical equation: $\[\sqrt{\Delta V \cdot \delta V}\]$](/articles/aa/full_html/2026/07/aa59263-26/aa59263-26-eq1.png) . Here, ΔV is the velocity integration range, and δV is the velocity resolution. We integrated the NH3(1,1) emission over velocity ranges of 43.7–52.1 km s−1, 73.1–81.2 km s−1, and 103.2–111.3 km s−1 for AGAL014.492-00.139, AGAL022.376+00.447, and AGAL024.314+00.086, respectively. For AGAL031.024+00.262, the two integration intervals used were 67.5–73.2 km s−1 and 101.7–106.8 km s−1. These intervals target the left inner satellite of the blueshifted component and the right inner satellite of the redshifted component. This ensures that the contributions from different velocity features and their respective hyperfine satellite components are properly captured. In this work, we adopted a minimum intensity threshold of 5σ, a peak intensity threshold of 7σ, and a minimum Δσ of 1.5σ. In addition, we masked out leaves smaller than two-thirds of the synthesized beam size to eliminate spurious detections.
. Here, ΔV is the velocity integration range, and δV is the velocity resolution. We integrated the NH3(1,1) emission over velocity ranges of 43.7–52.1 km s−1, 73.1–81.2 km s−1, and 103.2–111.3 km s−1 for AGAL014.492-00.139, AGAL022.376+00.447, and AGAL024.314+00.086, respectively. For AGAL031.024+00.262, the two integration intervals used were 67.5–73.2 km s−1 and 101.7–106.8 km s−1. These intervals target the left inner satellite of the blueshifted component and the right inner satellite of the redshifted component. This ensures that the contributions from different velocity features and their respective hyperfine satellite components are properly captured. In this work, we adopted a minimum intensity threshold of 5σ, a peak intensity threshold of 7σ, and a minimum Δσ of 1.5σ. In addition, we masked out leaves smaller than two-thirds of the synthesized beam size to eliminate spurious detections.
3.2 Deriving physical parameters from line fitting
We used the pyspeckit package to simultaneously fit the NH3(1,1) and NH3(2,2) spectra with the cold_ammonia model (Rosolowsky et al. 2008a; Friesen et al. 2009; Mangum & Shirley 2015), implemented within the integrated development environment (Ginsburg & Mirocha 2011; Ginsburg et al. 2022). The fitting assumes a common excitation temperature for all hyperfine components and adopts the Rayleigh-Jeans approximation. The model parameters with the initial guesses are excitation temperature (Tex = 5 K), para-ammonia column density (log10(Ntot) = 15 cm−2), kinetic temperature (Tk = 15 K), velocity dispersion (σv) from the second-moment map of the NH3(1,1) main line, and the velocity of the local standard of rest (VLSR) from the first-moment map of the NH3(1,1) main line. The best-fit parameters are obtained using the MPFIT algorithm, which performs a non-linear least-squares minimization (Markwardt 2009).
Parameter maps of AGAL031.024+00.262 were generated using the extended implementation of pyspeckit3, which employs the same ammonia_model but compiled in Cpython for improved computational efficiency. To discriminate between one and two velocity components, up to a maximum separation of ~18 km s−1, we used Bayesian evidence (Z) computed via nested sampling (Skilling 2004). Model comparisons were performed using the Bayes factor ![Mathematical equation: $\[K_{j}^{i}=Z_{i} / Z_{j}\]$](/articles/aa/full_html/2026/07/aa59263-26/aa59263-26-eq2.png) , where
, where ![Mathematical equation: $\[K_{j}^{i}>11\]$](/articles/aa/full_html/2026/07/aa59263-26/aa59263-26-eq3.png) indicates that model i is strongly preferred (Sokolov et al. 2020). Specifically,
indicates that model i is strongly preferred (Sokolov et al. 2020). Specifically, ![Mathematical equation: $\[K_{0}^{1}\]$](/articles/aa/full_html/2026/07/aa59263-26/aa59263-26-eq4.png) distinguishes single-component spectra from non-detections, and
distinguishes single-component spectra from non-detections, and ![Mathematical equation: $\[K_{1}^{2}\]$](/articles/aa/full_html/2026/07/aa59263-26/aa59263-26-eq5.png) identifies spectra that require two components.
identifies spectra that require two components.
For AGAL014.492–00.139 and AGAL024.314+00.086, the typical velocity separation between components is ~3 km s−1. We find that most ammonia cores cannot be reliably decomposed into two components at the current angular resolution, except in regions where the velocity separation exceeds 3 km s−1. The five hyperfine components of NH3(1,1) are heavily blended in two-component regions, indicating the complex kinematic environment of IRDCs. Therefore, the spectra within the regions of each dense core are spatially averaged for subsequent analysis.
The velocity dispersion (σv) consists of both thermal and nonthermal components, as well as the contribution from the spectral channel width (σchan). Therefore, the nonthermal component is expressed as
![Mathematical equation: $\[\sigma_{n o n}^2=\sigma_v^2-\sigma_{\text {th,} \mathrm{NH}_3}^2-\sigma_{\text {chan }}^2.\]$](/articles/aa/full_html/2026/07/aa59263-26/aa59263-26-eq6.png) (1)
(1)
The thermal component of ammonia is given by σth,NH3 = ![Mathematical equation: $\[\sqrt{k_{B} T / \mu_{\mathrm{NH}_{3}}}\]$](/articles/aa/full_html/2026/07/aa59263-26/aa59263-26-eq7.png) , where μNH3 ≈ 17 amu. The sound speed is cs ≈ 0.22 km s−1 at Tk = 15 K for a mean molecular weight μ = 2.37. The one-dimensional Mach number is then defined as ℳ = σnon/cs, where ℳ < 1, ℳ = 1–2, and ℳ > 2 correspond to subsonic, transonic, and supersonic motions, respectively (Monsch et al. 2018). The intrinsic line width with smaller than the channel width of σchan = 0.12 km s−1 is not considered in this study. The total parameters are listed in Table A.1.
, where μNH3 ≈ 17 amu. The sound speed is cs ≈ 0.22 km s−1 at Tk = 15 K for a mean molecular weight μ = 2.37. The one-dimensional Mach number is then defined as ℳ = σnon/cs, where ℳ < 1, ℳ = 1–2, and ℳ > 2 correspond to subsonic, transonic, and supersonic motions, respectively (Monsch et al. 2018). The intrinsic line width with smaller than the channel width of σchan = 0.12 km s−1 is not considered in this study. The total parameters are listed in Table A.1.
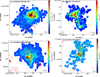 |
Fig. 1 Velocity-integrated intensity of the NH3(1,1) inner left satellite line shown in the background, overlaid with black contours of the 1.3 mm continuum and red contours of the 1.3 cm continuum. The exception is panel (d), which shows the inner left satellite line of the blue component and the inner right satellite line of red components for AGAL031.024+00.262. The noise level (σ) of the velocity-integrated intensities are 0.6, 1.1, 0.3, and 0.3 K km s−1, respectively. The blue contours show the leaf structures identified by the astrodendro framework. The dotted circle marks the field of view in the SMA observation. The beam size in the left bottom consists of the ammonia lines for the red ellipse and 1.3 mm continuum for the black ellipse. The adopted contours are different for each of the four sources. The rms noise levels are listed in Table 2. (a) Contours start at 3 · rms, stepping with 4 · rms for the black contours and 2 · rms for the red contours. (b) Contours start at 3.5 · rms, stepping with 1 · rms for both black and red contours. (c) Contours start at 3 · rms, stepping with 4 · rms for the black contours and 2 · rms for the red contours. (d) Contours start at 3 · rms, stepping with 3 · rms for the black contours and 1 · rms for the red contours. |
4 Result
4.1 Continuum emission
The continuum emission can be used to trace the evolutionary stages of star formation (e.g., Kim & Koo 2001; Eden et al. 2019). Based on the 1.3 cm continuum observations, the peak brightness temperatures range from 4.5 mK in AGAL022.376+00.447 to 19.6 mK in AGAL024.314+00.086, except for a compact point source in AGAL024.314+00.086 that reaches a peak brightness temperature of ~0.88 K. Extended continuum structures (0.4~0.7 pc) are detected in AGAL024.314+00.086 and AGAL014.492–00.139, while the emission regions in the other sources are generally comparable to the beam size.
To confirm whether the 1.3 cm continuum originates from dust thermal emission, we compared its intensity distribution with that of the 1.3 mm continuum. As shown in Fig. 1, the 1.3 cm continuum emission is offset from that of the 1.3 mm continuum emission obtained from SMA observations (Li et al. 2019). The 1.3 mm continuum emission is dominated by thermal dust radiation. Assuming the optically thin limit following equation (2) of Casey (2012) and adopting a spectral index of β ~ 1.5, the flux density scales as
![Mathematical equation: $\[S_\nu \propto \nu^\beta B_\nu(T) \propto \frac{\nu^{4.5}}{\mathrm{e}^{h \nu / k_B T}-1},\]$](/articles/aa/full_html/2026/07/aa59263-26/aa59263-26-eq8.png) (2)
(2)
where Sν is the flux density at a frequency, ν, Bν(T) is the Planck function, and T is the dust temperature, respectively. Based on this relation, the 1.3 cm continuum intensity can be extrapolated to the 1.3 mm continuum intensity to further confirm the evolutionary stage, as listed in Table 2. The brightness temperature derived from the spectral index of 4.5 is significantly lower at 1.3 cm compared to 1.3 mm, consistent with thermal dust emission decreasing rapidly with decreasing frequency. However, the observed 1.3 cm emission is unlikely to be thermal dust radiation, as the extrapolated flux would be below the detection sensitivity of the SMA observations in Li et al. (2019).
Free–free emission, which typically originates from late evolutionary stages of star formation, generally exhibits brightness temperatures much greater than 1 K at 1.3 cm continuum, exceeding the maximum value of 0.88 K found in our results. In addition, we calculated the production rate, Nuv, of Lyman continuum photons to further assess the possibility of free–free emission given the detection sensitivity of the VLA observations. The production rate, Nuv, is related to the thermal spectral luminosity LT and characterizes HII regions photoionized by hot stars (Condon 1992). The value of Nuv can be derived using equation 2 in Condon (1992), expressed as
![Mathematical equation: $\[\left(\frac{N_{\mathrm{uv}}}{\mathrm{~s}^{-1}}\right) \geq 6.3 \times 10^{52}\left(\frac{T_e}{10^4 \mathrm{~K}}\right)^{-0.45}\left(\frac{\nu}{\mathrm{GHz}}\right)^{0.1}\left(\frac{L_T}{10^{20} \mathrm{~W} \mathrm{~Hz}^{-1}}\right),\]$](/articles/aa/full_html/2026/07/aa59263-26/aa59263-26-eq9.png) (3)
(3)
where the electron temperature is Te = 8000 K, the observing frequency is ν = 23.4 GHz, and LT = 4πD2Sν. This equation assumes optically thin emission and, thus, it provides a limit on Nuv. For the four clumps, we derived the flux density, Sν, within a circular region with a radius equal to the beam major axis, centered on the peak position. The compact point source in AGAL024.314+00.086 is excluded from the calculation. The resulting parameters are listed in Table 2.
We find that the values of Nuv = 5 × 1043 ~ 2.5 × 1044 s−1 for the four clumps corresponds to spectral type of B2–B3, assuming a single zero-age main sequence star as the ionizing source, with stellar mass of 7~8 M⊙ (Panagia 1973; Vacca et al. 1996; Hanson et al. 1997; Diaz-Miller et al. 1998; Martins et al. 2005). The 1.3 cm continuum emission is possibly produced by shock-induced ionization from outflows or jets and is not associated with HII regions (Díaz-Márquez et al. 2024). Therefore, we conclude that the seventeen dense cores in the four clumps reported by Li et al. (2019) that exhibit no outflows are likely to be in the early stages of star formation.
Comparison of the 1.3 cm and 1.3 mm continuum emission.
4.2 Properties of ammonia cores
We initially identified 92 dense cores from the velocity-integrated intensity of the NH3(1,1) inner satellite line, which is generally optically thin. Among them, 61 cores satisfy the size criterion of being larger than 2/3 of the beam size, which removes spurious detections and allows them to be classified as ammonia cores. Within this sample, 38 cores exhibit a single velocity component, while 23 show multiple velocity components in the NH3(1,1) main line.
4.2.1 Averaged physical parameters
For each of the 61 ammonia cores, the NH3(1,1) and NH3(2,2) spectra were averaged over regions corresponding to the core sizes due to S/N limitations. The averaged spectra were then fitted, and the derived physical parameters are summarized in Table A.1 of the appendix. The kinetic temperatures span from 10.53 K to 26.61 K. The ammonia column densities range from 3.07 × 1014 cm−2 to 8.19 × 1015 cm−2. The velocity dispersions vary between 0.18 km s−1 and 1.84 km s−1. The observed line profiles are affected not only by optical depth effects, but also by local protostellar feedback such as molecular outflows. Twelve ammonia cores have counterpart 1.3 mm continuum emission, among which five are associated with CO J = 2–1 outflows (Li et al. 2019).
The ammonia cores showing single velocity component, the thermal component ranges from 0.20 to 0.24 km s−1, while the nonthermal component spans from 0.22 to 1.2 km s−1. For AGAL031.024+00.262, we adopted a uniform kinetic temperature of Tk = 13 K for ammonia cores whose the NH3(2,2) main line intensities are characterized by S/N < 3. All ammonia cores in AGAL014.492–00.139, AGAL022.376+00.447, and AGAL024.314+00.086 show supersonic motions, whereas four ammonia cores in AGAL031.024+00.262 exhibit sonic levels.
Nine cores show multiple velocity components, each consisting of a narrow and a broad feature. For example, core 9 of AGAL014.492–00.139 exhibits a sonic component with ℳ = 1.18 and a supersonic component with ℳ = 4.06. Core 8 of AGAL024.314+00.086 similarly shows a supersonic component (ℳ = 5.47) accompanied by a nearly sonic one (ℳ = 1.01). The kinetic temperatures of the narrow and broad components differ by >4 K. Thermal motions dominate the narrow component in core 8, whereas turbulence drives the broad component. This contrasts with other ammonia studies, where both components are typically supersonic (e.g., Choudhury et al. 2020). The thermal to nonthermal transition may indicate progressive turbulent energy dissipation (Tatematsu et al. 2014).
AGAL031.024+00.262 contains two molecular clumps with distinct physical conditions. The blueshifted components are systematically colder by ~2 K and have ammonia column densities approximately a factor of two lower than those of the redshifted components. Two cores in this region show both subsonic and supersonic components. In core 16, the blue component is supersonic (ℳ = 1.8), whereas the red component is sonic (ℳ = 0.43). Conversely, in core 24, the blue component is subsonic (ℳ = 0.58) and the red component is strongly supersonic (ℳ = 2.89). The dominance of thermal motions in some of these components indicates that turbulence has largely dissipated in the central regions, resulting in quiescent gas characteristic of very early evolutionary stages of star formation.
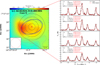 |
Fig. 2 Left: example of identified dense core, outlined by a blue ellipse with its center marked by a red star. The colored background is the NH3(1,1) satellite-line intensity, also shown with gray contours. The red circle indicates the beam sizes of the NH3(1,1) line. Right: averaged NH3(1,1) line profile for each annular region as a black solid line, and the averaged spectral profile with the pixel-by-pixel velocity axis referenced to VLSR as a red dashed line. The fitting parameters are denoted by black and red text, respectively. The VLSR values of the spectra are 114.26, 114.27, 114.18, and 114.07 km s−1 for the black lines before they are aligned to zero. Top to bottom: spectra corresponding to regions from the core center to the outer areas. |
4.2.2 Internal radial gradient of σnon
The multiple velocity components in the NH3(1,1) spectra cause line broadening that cannot be cleanly decomposed on pixel-by-pixel basis when the velocity separation is smaller than ~3 km s−1. As a result, reliable pixel-by-pixel maps of velocity dispersion and kinetic temperature cannot be obtained for all dense cores. To investigate the radial variations of kinematic and thermal properties, we averaged the spectra based on a series of concentric annuli. From the outer envelope toward the core center, the annuli were spaced at intervals of one-third of the major axis of beam. The maximum radius was defined as the sum of the major axis of ammonia core and half of the beam size. Within each annulus, the spectra were spatially averaged to improve the S/N. The annular regions may contain velocity gradient or vary systemic velocity across different positions, which could broaden the FWHM and introduce a bias in the radial gradient of σnon. We used the method described by Goodman et al. (1993) to fit the velocity field of the dense cores. The typical velocity gradient ranges from 0.5 to 3.8 km s−1 pc−1. Although the current spatial resolution does not allow us to disentangle the contributions of infall and/or rotation to the FWHM. The influence of velocity gradients and variations on the FWHM can be significantly mitigated by aligning each spectrum to a common velocity center (here, VLSR, com = 0) before averaging them over the annular region (see Fig. 2).
The averaged NH3(1,1) and NH3(2,2) spectra in each subregion were then fitted simultaneously using the cold_ammonia model implemented in pyspeckit, yielding radial profiles of velocity dispersion and kinetic temperature. A sample of the spectral line is shown in Fig. 2, where we compare the direct average of spectra in the annular region to those with aligned spectra. The spectral line shows systematically lower FWHM after the velocity alignment, effectively reducing the influence of variations in the systemic velocity across different positions within the annulus. Therefore, we applied the result derived from the velocity alignment spectra to our work. The radial gradient of σnon for AGAL031.024+00.26 is presented in Fig. 3. The other source present in Fig. B.1 of appendix. The derived parameters are listed in Table B.1.
As shown in Fig. 3 and Fig. B.1, the radial behavior of σnon varies significantly among the ammonia cores. The σnon increases outward, exhibiting supersonic motions on scales of 0.01~0.11 pc toward the five cores in AGAL022.376+00.447 and AGAL024.314+00.086. In addition to these ammonia cores, core 1 of AGAL014.492–00.139 and core 11 of AGAL024.314+00.086 span a smaller radial range, exhibiting only minor variations of 0.01 km s−1 and 0.02 km s−1, which are not included in the discussion below. Core 15 of AGAL024.314+00.086, on the other hand, displays a much larger change of 0.24 km s−1 across a distance of 0.0157~0.1091 pc. These trends indicate that the turbulence intensity generally decreases toward the core centers. If such turbulence dissipation causes the nonthermal component to approach sonic or subsonic levels, the cores may experience faster gravitational collapse than those dominated by supersonic turbulence. For example, core 1 of AGAL031.024+00.262 shows a σnon of 0.23 km s−1 at its center of ~0.0086 pc, transitioning to a transonic value of 0.39 km s−1 in the outer region of ~0.0423 pc. In contrast, cores 6, 8, and 9 in AGAL031.024+00.262 exhibit enhanced turbulence toward their centers, with Δσnon from 0.14 to 0.20 km s−1.
The ammonia cores in AGAL031.024+00.262 associated with multiple velocity components reveal further kinematic complexity. In cores 17 and 18, which coincide with the 1.3 mm continuum emission, the blueshifted components show a pronounced outward increase in σnon in contrast to the redshifted components. The difference in σnon between the distinct velocity components ranges from 0.02 to 0.15 km s−1. In core 21, the spatial variation of σnon is 0.23 km s−1 for the blue component and 0.14 km s−1 for the red component. Notably, both components trace a transition from the sonic to the supersonic regime. In core 22, a similar decreasing trend is observed in both components, with differences of 0.05 km s−1 in the blue component and 0.12 km s−1 in the red component.
The kinematic temperature profiles across the annuli remain relatively flat within individual cores. Central temperatures range from 10.4 to 24.8 K, while outer regions spans from 11.0 to 16.1 K. As shown in Fig. 4, the kinematic behaviors in ammonia cores exhibit a similar distribution. The σnon increases with Tk, indicating that feedback from ongoing star formation activities enhances the stability of dense cores and highlights the significance of turbulence in differentiating evolutionary stages.
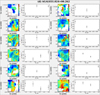 |
Fig. 3 Left: σnon map of the NH3(1,1) main line shown as the colored background. The dashed circular ring outlines the averaged regions used for the NH3(1,1) and NH3(2,2) spectra. The black contours show the 1.3 mm continuum with the same contour levels as those in Fig. 1. The black circle indicates the beam size of the 1.3 mm continuum observation, while the red circle denotes the beam size of the NH3(1,1) line. Right: radial variation of σnon from the center to the outer regions, marked in black. For the source AGAL031.024+00.262, the two colored labels represent the blue- and redshifted components of the NH3(1,1) main line. |
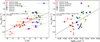 |
Fig. 4 Correlations between σnon and both Tk and Ntot for the ammonia cores with single velocity components, as well as for the blue- and redshifted components of AGAL031.024+00.262. Different colored markers represent the averaged parameters of each core, and the black outlines indicate the ammonia cores that are associated with the 1.3 cm continuum emission. |
5 Discussion
5.1 Turbulence dissipation and enhancement
Stable dense cores require sufficient internal support through turbulence, magnetic pressure, and thermal motions to counteract self-gravity (McKee & Ostriker 2007). As described above, both thermal and nonthermal motions are present in the ammonia cores under varying local conditions, influenced by internal and external feedback processes. Offner et al. (2022) proposed three evolutionary phases characterized by different turbulence regimes dependent on spatial scale and gas density. Using magnetohydrodynamic (MHD) simulations, they modeled three-dimensional (3D) velocity dispersion gradients in 0.1 pc cores and suggested a typical core lifetime on the order of 105 yr.
Comparing our observational results with their predictions, we find that five ammonia cores, out of a total of 33 cores in AGAL014.492–00.139, AGAL022.376+00.447, and AGAL024.314+00.086, exhibit similar behavior on a characteristic scale of ~0.1 pc, where the nonthermal velocity component is shown to decrease toward the core center. The minimum observed σnon of 0.2 km s−1 lies at the lower end of the 3D velocity dispersion gradients modeled by Offner et al. (2022). However, since NH3 line widths trace only the one-dimensional projection, the true 3D velocity dispersions must be larger. This implies that turbulence remains significant and cannot be ignored, both before and after the collapse of dense cores. In these five ammonia cores, the central regions exhibit reduced σnon, providing less nonthermal motions support against gravity compared to the outer envelopes. This trend suggests that turbulence dissipates toward higher-density regions, thereby facilitating inward gas accretion in the absence of additional forces opposing gravitational collapse (Moon & Ostriker 2025).
In AGAL031.024+00.262, the radial behavior of σnon is more diverse. One core shows an increase in σnon within 0.0423 pc, while three single velocity component cores show decreasing trends from the center to the outer region. For the multiple velocity component cases (cores 17, 18, and 21), σnon behaves differently between velocity components that cores 17 and 18 show enhanced σnon in the blueshifted components but decreasing values in the redshifted ones. The revealed CO outflow in core 17 indicates the presence of at least one embedded protostar, suggesting that the central turbulence enhancement is likely driven by feedback from ongoing star formation. The outflow likely originates from the redshifted component, while the blue component shows an outward increase in σnon, implying that star formation may be occurring on smaller scales (<0.01 pc). In contrast, the decrease in σnon for both the blueshifted and redshifted components in core 22 suggests that ongoing star formation activities are affecting the surrounding environment, despite the absence of detectable 1.3 mm continuum emission and outflow in this study.
Compared with the coherent cores identified by Choudhury et al. (2021) in L1688, the velocity dispersion increases from the core center (0.2~0.4 km s−1) to the shell (~0.6 km s−1) surrounding the core. Both exhibit two velocity components exhibiting a similar trend. In addition, they confirm that the velocity dispersion difference Δσv is 0.15~0.25 km s−1 for a transition scale of 0.2 pc. In this work, core 1 and core 21, the turbulence has largely dissipated on small scales (~0.1 pc), leaving the gas predominantly thermally supported. Thermal pressure dominates in the central regions of the blue component of core 1 and the red component of core 21. These components exhibit low kinetic temperatures (e.g., Tk = 10.5 K for core 21) and low total column densities (Ntot = 5.9 × 1014 cm−2), compared with typical values of ~14 K and 1015 cm−2 for the other cores. These cores appear dynamically quiescent and may soon undergo gravitational collapse to form prestellar or protostellar objects, consistent with the second phase described by Offner et al. (2022). Ammonia cores that exhibit outward-increasing σnon profiles are likely at earlier evolutionary stages.
Due to the low S/N (<3) of the NH3(2,2) main line and the presence of multiple velocity components across three clumps, reliable radial density profiles cannot be obtained to further constrain the evolutionary states. Higher angular resolution and higher sensitivity observations at sub-parsec scales will be essential to reveal the transitions between thermally dominated and turbulence-dominated regions within these ammonia cores.
5.2 Evolutionary stage of the ammonia cores
As described in Sect. 4.1, the 1.3 mm and 1.3 cm continuum emission show positional offsets within the SMA field of view. The 1.3 mm continuum emission may primarily trace thermal dust emission in cold regions with temperatures of ~15 K for this work, which decreases with frequency following a spectral index of 4.5 (Casey 2012). The flux density therefore drops by nearly four orders of magnitude from 1.3 mm to 1.3 cm, requiring extremely high sensitivity at longer wavelengths that is not achieved in the current VLA data. The 1.3 cm continuum emission exhibits extended structures in AGAL014.492–00.139 and AGAL024.314+00.086, which likely trace nonthermal dust emission from background sources and are not further investigated in this work.
Ammonia is also used to trace dense gas and to probe the evolutionary stages of dense cores (Sánchez-Monge et al. 2013). We identified twelve ammonia cores associated with 1.3 cm continuum emission and five cores with detected outflows. Starless cores that are transonic or supersonic and show no detected outflows, yet they are located near protostars and are likely perturbed by these outflows. Therefore, they exhibit broader FWHM (Sánchez-Monge et al. 2013). From the CO J = 2–1 results of Li et al. (2019), the outflow lengths typically exceed 0.1 pc, comparable to the sizes of the ammonia and 1.3 mm continuum cores. The interior feedback can result in the heated component of molecular gas and inject turbulence. The correlations of σnon present middle trend (R ~ 0.56) comparing with the Tk and Ntot, as shown in Fig 4. The ammonia cores associated with the 1.3 mm continuum do not show significant differences in Tk or Ntot among the four clumps, indicating that the dense gas traced by both ammonia and dust shows a similar physical condition.
In AGAL014.492–00.139, all single-component ammonia cores exhibit fully supersonic motions (ℳ > 2), indicating that nonthermal motions dominate the internal support. Outflows are detected in cores 4 and 5 in the CO J = 2–1 transition, corresponding to the MM1 and MM2 cores identified by Li et al. (2019). Core 4 shows a narrow component with σv = 0.43 km s−1 and Tk = 21.6 K, and a broad component with σv = 1.2 km s−1 and Tk = 16.6 K. Similarly, core 5 exhibits a narrow component (σv = 0.37 km s−1, Tk = 22.2 K) and a broad one (σv = 0.92 km s−1, Tk = 14.0 K). The broad component of core 4 has the greatest FWHM among all ammonia cores and corresponds to the longest outflow dynamical timescale of 2.51 × 10⁴ yr, while core 5 drives the maximum mass outflow of 0.148 M⊙ with the shortest timescale of 0.4 × 10⁴ yr. The broad component of core 5 may indicate that it is more strongly perturbed by the outflow. The two components differ by a factor of ~7 in total ammonia column density, with a peak value of Ntot = 8.2 × 1015 cm−2 in core 5. The narrow components trace more quiescent gas (σnon = 0.4 and 0.33 km s−1), although higher-density tracers such as N2H+ will be needed to confirm embedded cores (Priestley et al. 2023).
In AGAL022.376+00.447, core 2 shows a relatively low nonthermal velocity dispersion (σnon = 0.36 km s−1), while the other six cores yield Mach numbers of ℳ = 2.0~3.4. Although most cores are supersonic, high-velocity CO J = 2–1 emission has not been detected around them, with the exception of core 6, which exhibits a redshifted component offset by ~0.1 pc from the peak of the 1.3 mm continuum. These results suggest that AGAL022.376+00.447 is at an earlier evolutionary stage than AGAL014.492–00.139, with less developed feedback activity.
AGAL024.314+00.086 shows a centrally concentrated morphology in both ammonia and 1.3 mm continuum maps, consisting of two clumps separated by ΔVLSR ≈ 3 km s−1. Outflows are detected in cores 8 and 9. Core 9 is supersonic and has the highest ammonia column density (Ntot ~ 3.0 × 1015 cm−2) among all cores, consistent with the strong outflow (0.087 M⊙) associated with MM1 in Li et al. (2019). Core 8 contains both narrow and broad components: the narrow component (σv = 0.25 km s−1) lies near the sound speed, whereas the broad component is supersonic, warmer (Tk = 19.3 K), and likely perturbed and heated by the outflow.
The source AGAL031.024+00.262, located in the Scutum–Centaurus arm, contains two velocity components separated by ~18 km s−1. Core 18, which drives the outflow, exhibits two supersonic components (similar to cores 16, 17, and 26), which are associated with 1.3 cm continuum emission. Feedback from embedded protostars appears to influence the surrounding gas over timescales longer than ~3.8 × 10³ yr, comparable to the MM1 core in AGAL014.492–00.139 (Li et al. 2019). The blue components at 78 km s−1 trace nearly sonic gas in cores 1, 24, and 25, while the red components at 96 km s−1 are subsonic in cores 16 and 19, and approximately sonic in core 21. The differences in the kinematic properties between the blue and red components suggest that they do not represent the same physical structure. Future observations using higher density tracers such as N2H+ will be essential to clarify the evolutionary links between the components and to confirm the nature of the embedded protostellar activity (Fehér et al. 2024).
5.3 Optical depth effects on the extracted structure
The NH3(1,1) inversion transition consists of 18 hyperfine components arising from six underlying fine-structure levels, which are grouped into five observable spectral features comprising one main line and four satellite lines, including two inner and two outer satellites. Under the assumption of local thermodynamic equilibrium (LTE) and optically thin conditions, the theoretical relative intensities of the inner satellite group is approximately 0.28, and those of the outer satellite group is approximately 0.22, with respect to the main line (e.g., Ho & Townes 1983; Mangum & Shirley 2015). This hyperfine structure enables an estimate to be made of the optical depth, τ, under the LTE assumption, following equation D1~D5 in Mangum & Shirley (2015). The NH3 column density is then corrected by the factor τ/(1 − e−τ) (Mangum & Shirley 2015).
In AGAL022.376+00.447, the five NH3(1,1) components observed with the VLA and GBT show predominantly single velocity components, enabling reliable measurement of the line intensity ratios. In contrast, the satellite lines in the other three clumps are strongly blended due to multiple velocity components. Therefore, the optical depths of the main component, τm, and the inner satellite component, τs, in AGAL022.376+00.447 are derived from the intensity ratio (Im/Is) between the main line and the inner satellite group, adopting their theoretical relative strengths.
The resulting histogram of τm shows that most pixels fall within an Im/Is ratio of 1.6–1.7. Considering a 20% uncertainty in this ratio, an observed value of ~1.6 corresponds to τm ≈ 3.31, with a minimum of 2.26 and a maximum of 5.4. The bias in τm therefore roughly doubles and becomes further amplified in the column-density correction factor. The inner-satellite lines become optically thick at τm ~ 3.6, and all satellite lines become optically thick when τm > 4.5. Under such conditions, the main-line intensity becomes saturated, producing a flattened intensity distribution in the NH3(1,1) main line. This effect may lead to an apparently uniform structure in regions where the emission is actually optically thick.
The presence of multiple velocity components affects the inferred optical depth, as illustrated in Fig 5. Although the multi-component fit yields a smaller residual (rms2/rms1 = 0.88), the narrow component at lower velocities has an optical depth comparable to that obtained from a single component fit, and its satellite lines remain close to the optically thin regime. In contrast, the broad component is fully optically thick and likely traces denser gas regions. Therefore, accurately resolving the structure requires higher angular resolution observations to distinguish between genuine substructures and self-absorption effects caused by optically thick NH3(1,1) emission. However, for AGAL022.376+00.447, optical depths lower than τm < 4.5 have only a minor influence on the structural identification derived from the NH3(1,1) satellite lines. We then corrected the intensity map of inner satellite group by the factor of τs/(1 − e−τs), as shown in Fig. 1b.
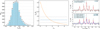 |
Fig. 5 Distribution of the NH3(1,1) main line to inner left satellite line ratios in pixel space for AGAL022.376+00.447 shown in the first panel. The second panel presents the variation of this ratio as a function of optical depth for the NH3(1,1) main line, where the yellow curve denotes the modeled trend, the blue horizontal line marks the reference ratio of 1.6, and the dashed lines indicate the corresponding 20% uncertainty. The third panel displays the averaged NH3(1,1) spectra of core 1 in AGAL022.376+00.447, with the fitted components shown as blue and red profile. |
6 Summary
We present the ammonia kinematics of four 70 μm dark molecular clumps based on VLA and GBT data. We used physical parameters derived from spectral line fitting of the NH3(1,1) and NH3(2,2) transitions to study the properties of ammonia cores on a scale of ~0.1 pc. Our main conclusions are summarized below:
We transformed the 1.3 cm continuum flux densities from the VLA observations into equivalent 1.3 mm intensities. The offsets between the 1.3 cm and 1.3 mm continuum indicate that the 1.3 cm emission does not originate from dust thermal emission. Moreover, the low value of Nuv ~ 1044 s−1, compared with values reported in previous studies, suggests that the 1.3 cm continuum emission is not associated with H II regions. These results indicate that the four clumps are primarily in an early evolutionary stage;
Using the intensity of the NH3(1,1) inner satellite group, we identified 92 ammonia cores across the four clumps with the dendrogram algorithm. Based on the optical-depth analysis of AGAL022.376+00.447, we determined that the NH3(1,1) satellite structure is only weakly affected when τm < 4.5. Thirty-one small cores size of <2/3 beam were excluded from the analysis. Among the remaining 61 cores, 38 exhibit single velocity components and 23 show two components in the NH3(1,1) main line. Twelve ammonia cores are associated with 1.3 mm continuum emission, and five are associated with the outflows of CO J=2–1 line;
For the 38 single-component ammonia cores, the velocity dispersion, σv, ranges from 0.23 km s−1 in core 1 of AGAL031.024+00.262 to 1.20 km s−1 in core 13 of AGAL024.314+00.086. The kinetic temperature, Tk, spans 11.6 ~16.5 K. To investigate the internal kinematics of the ammonia cores, we averaged the spectra of 61 ammonia cores within concentric annuli and derived the nonthermal components from the NH3(1,1) main line in each annulus. We found a clear trend demonstrating the nonthermal motions of supersonic or sonic increase with radius in five ammonia cores of AGAL022.376+00.447 and AGAL024.314+00.086. In AGAL031.024+00.262, four cores show a similar outward increase, while seven cores display the opposite trend. The former ammonia cores likely experience turbulence dissipation and are approaching gravitational collapse. In contrast, seven cores with decreasing nonthermal components toward outer regions are likely to be influenced by feedback from ongoing star formation activity.
Acknowledgements
We thank the referee for the comments and suggestions that improved this work. We sincerely thank Prof. Zhiyu Zhang, Lingrui Lin, and Yichen Sun for their help with data reduction. We also acknowledge helpful with Chang Ruan, Rui Luo, Xing Lu, Fengyao Zhu, Siqi Zheng, and Fei Li. This work is supported by National Key R&D Program of China under grant 2023YFA1608204, the National Natural Science Foundation of China grant 12550003 and the Guangxi Talent Programme (Highland of Innovation Talents). S.L. acknowledges support from the National SKA Program of China with No. 2025SKA0140100, “Double First-Class” Funding with No. 14912217, and National Natural Science Foundation of China (NSFC) grant with No. 13004007.
References
- Avison, A., Fuller, G. A., Frimpong, N. A., et al. 2023, MNRAS, 526, 2278 [Google Scholar]
- Battersby, C., Ginsburg, A., Bally, J., et al. 2014, ApJ, 787, 113 [NASA ADS] [CrossRef] [Google Scholar]
- Bergin, E. A., & Tafalla, M. 2007, ARA&A, 45, 339 [Google Scholar]
- Beuther, H., Kuiper, R., & Tafalla, M. 2025, ARA&A, 63, 1 [Google Scholar]
- Bőgner, R., Csengeri, T., Montillaud, J., et al. 2022, A&A, 667, A137 [NASA ADS] [CrossRef] [EDP Sciences] [Google Scholar]
- Carey, S. J., Clark, F. O., Egan, M. P., et al. 1998, ApJ, 508, 721 [Google Scholar]
- CASA Team (Bean, B., et al.) 2022, PASP, 134, 114501 [NASA ADS] [CrossRef] [Google Scholar]
- Caselli, P., & Ceccarelli, C. 2012, A&A Rev., 20, 56 [NASA ADS] [Google Scholar]
- Caselli, P., Pineda, J. E., Sipilä, O., et al. 2022, ApJ, 929, 13 [NASA ADS] [CrossRef] [Google Scholar]
- Casey, C. M. 2012, MNRAS, 425, 3094 [Google Scholar]
- Choudhury, S., Pineda, J. E., Caselli, P., et al. 2020, A&A, 640, L6 [EDP Sciences] [Google Scholar]
- Choudhury, S., Pineda, J. E., Caselli, P., et al. 2021, A&A, 648, A114 [NASA ADS] [CrossRef] [EDP Sciences] [Google Scholar]
- Condon, J. J. 1992, ARA&A, 30, 575 [Google Scholar]
- Devine, K. E., Chandler, C. J., Brogan, C., et al. 2011, ApJ, 733, 44 [NASA ADS] [CrossRef] [Google Scholar]
- Díaz-Márquez, E., Grau, R., Busquet, G., et al. 2024, A&A, 682, A180 [NASA ADS] [CrossRef] [EDP Sciences] [Google Scholar]
- Diaz-Miller, R. I., Franco, J., & Shore, S. N. 1998, ApJ, 501, 192 [CrossRef] [Google Scholar]
- Dirienzo, W. J., Brogan, C., Indebetouw, R., et al. 2015, AJ, 150, 159 [Google Scholar]
- Eden, D. J., Liu, T., Kim, K.-T., et al. 2019, MNRAS, 485, 2895 [NASA ADS] [CrossRef] [Google Scholar]
- Egan, M. P., Shipman, R. F., Price, S. D., et al. 1998, ApJ, 494, L199 [Google Scholar]
- Fehér, O., Ragan, S. E., Priestley, F. D., Clark, P. C., & Moore, T. J. T. 2024, MNRAS, 530, 1311 [Google Scholar]
- Friesen, R. K., Di Francesco, J., Shirley, Y. L., & Myers, P. C. 2009, ApJ, 697, 1457 [Google Scholar]
- Friesen, R. K., Di Francesco, J., Shimajiri, Y., & Takakuwa, S. 2010, ApJ, 708, 1002 [Google Scholar]
- Ginsburg, A., & Mirocha, J. 2011, PySpecKit: Python Spectroscopic Toolkit, Astrophysics Source Code Library [record ascl:1109.001] [Google Scholar]
- Ginsburg, A., Sokolov, V., de Val-Borro, M., et al. 2022, AJ, 163, 291 [NASA ADS] [CrossRef] [Google Scholar]
- Goldsmith, P. F. 2001, ApJ, 557, 736 [Google Scholar]
- Goodman, A. A., Benson, P. J., Fuller, G. A., & Myers, P. C. 1993, ApJ, 406, 528 [Google Scholar]
- Hacar, A., Tafalla, M., & Alves, J. 2017, A&A, 606, A123 [NASA ADS] [CrossRef] [EDP Sciences] [Google Scholar]
- Hanson, M. M., Howarth, I. D., & Conti, P. S. 1997, ApJ, 489, 698 [NASA ADS] [CrossRef] [Google Scholar]
- Hily-Blant, P., Walmsley, M., Pineau Des Forêts, G., & Flower, D. 2010, A&A, 513, A41 [NASA ADS] [CrossRef] [EDP Sciences] [Google Scholar]
- Ho, P. T. P., & Townes, C. H. 1983, ARA&A, 21, 239 [Google Scholar]
- Hogge, T., Jackson, J., Stephens, I., et al. 2018, ApJS, 237, 27 [Google Scholar]
- Kim, K.-T., & Koo, B.-C. 2001, ApJ, 549, 979 [Google Scholar]
- Li, S., Zhang, Q., Pillai, T., et al. 2019, ApJ, 886, 130 [Google Scholar]
- Li, S., Sanhueza, P., Zhang, Q., et al. 2020a, ApJ, 903, 119 [Google Scholar]
- Li, S., Zhang, Q., Liu, H. B., et al. 2020b, ApJ, 896, 110 [Google Scholar]
- Li, S., Sanhueza, P., Zhang, Q., et al. 2023, ApJ, 949, 109 [NASA ADS] [CrossRef] [Google Scholar]
- Lu, X., Zhang, Q., Liu, H. B., Wang, J., & Gu, Q. 2014, ApJ, 790, 84 [NASA ADS] [CrossRef] [Google Scholar]
- Mangum, J. G., & Shirley, Y. L. 2015, PASP, 127, 266 [Google Scholar]
- Markwardt, C. B. 2009, in Astronomical Society of the Pacific Conference Series, 411, Astronomical Data Analysis Software and Systems XVIII, eds. D. A. Bohlender, D. Durand, & P. Dowler, 251 [Google Scholar]
- Martins, F., Schaerer, D., & Hillier, D. J. 2005, A&A, 436, 1049 [NASA ADS] [CrossRef] [EDP Sciences] [Google Scholar]
- McKee, C. F., & Ostriker, E. C. 2007, ARA&A, 45, 565 [Google Scholar]
- Molinari, S., Swinyard, B., Bally, J., et al. 2010, A&A, 518, L100 [NASA ADS] [CrossRef] [EDP Sciences] [Google Scholar]
- Monsch, K., Pineda, J. E., Liu, H. B., et al. 2018, ApJ, 861, 77 [NASA ADS] [CrossRef] [Google Scholar]
- Moon, S., & Ostriker, E. C. 2025, ApJ, 988, 82 [Google Scholar]
- Motte, F., Bontemps, S., & Louvet, F. 2018, ARA&A, 56, 41 [Google Scholar]
- Myers, P. C., & Lazarian, A. 1998, ApJ, 507, L157 [Google Scholar]
- Offner, S. S. R., Taylor, J., Markey, C., et al. 2022, MNRAS, 517, 885 [NASA ADS] [CrossRef] [Google Scholar]
- Ohashi, S., Tatematsu, K., Sanhueza, P., et al. 2016, MNRAS, 459, 4130 [Google Scholar]
- Panagia, N. 1973, AJ, 78, 929 [NASA ADS] [CrossRef] [Google Scholar]
- Pandian, J. D., Chatterjee, R., Csengeri, T., et al. 2024, ApJ, 966, 54 [Google Scholar]
- Peretto, N., & Fuller, G. A. 2009, A&A, 505, 405 [NASA ADS] [CrossRef] [EDP Sciences] [Google Scholar]
- Pillai, T. G. S., Urquhart, J. S., Leurini, S., et al. 2023, MNRAS, 522, 3357 [NASA ADS] [CrossRef] [Google Scholar]
- Priestley, F. D., Clark, P. C., Glover, S. C. O., et al. 2023, MNRAS, 526, 4952 [NASA ADS] [CrossRef] [Google Scholar]
- Rathborne, J. M., Jackson, J. M., & Simon, R. 2006, ApJ, 641, 389 [Google Scholar]
- Reid, M. J., Menten, K. M., Brunthaler, A., et al. 2019, ApJ, 885, 131 [Google Scholar]
- Rosolowsky, E. W., Pineda, J. E., Foster, J. B., et al. 2008a, ApJS, 175, 509 [Google Scholar]
- Rosolowsky, E. W., Pineda, J. E., Kauffmann, J., & Goodman, A. A. 2008b, ApJ, 679, 1338 [Google Scholar]
- Sánchez-Monge, Á., Palau, A., Fontani, F., et al. 2013, MNRAS, 432, 3288 [CrossRef] [Google Scholar]
- Sanhueza, P., Contreras, Y., Wu, B., et al. 2019, ApJ, 886, 102 [Google Scholar]
- Sault, R. J., Teuben, P. J., & Wright, M. C. H. 1995, in Astronomical Society of the Pacific Conference Series, 77, Astronomical Data Analysis Software and Systems IV, eds. R. A. Shaw, H. E. Payne, & J. J. E. Hayes, 433 [Google Scholar]
- Schuller, F., Menten, K. M., Contreras, Y., et al. 2009, A&A, 504, 415 [NASA ADS] [CrossRef] [EDP Sciences] [Google Scholar]
- Sepúlveda, I., Estalella, R., Anglada, G., et al. 2020, A&A, 644, A128 [NASA ADS] [CrossRef] [EDP Sciences] [Google Scholar]
- Skilling, J. 2004, in American Institute of Physics Conference Series, 735, Bayesian Inference and Maximum Entropy Methods in Science and Engineering: 24th International Workshop on Bayesian Inference and Maximum Entropy Methods in Science and Engineering, edw. R. Fischer, R. Preuss, & U. V. Toussaint (AIP), 395 [Google Scholar]
- Sokolov, V., Pineda, J. E., Buchner, J., & Caselli, P. 2020, ApJ, 892, L32 [NASA ADS] [CrossRef] [Google Scholar]
- Svoboda, B. E., Shirley, Y. L., Traficante, A., et al. 2019, ApJ, 886, 36 [Google Scholar]
- Tafalla, M., Myers, P. C., Caselli, P., & Walmsley, C. M. 2004, A&A, 416, 191 [NASA ADS] [CrossRef] [EDP Sciences] [Google Scholar]
- Tatematsu, K., Hirota, T., Ohashi, S., et al. 2014, ApJ, 789, 83 [NASA ADS] [CrossRef] [Google Scholar]
- Towner, A. P. M., Brogan, C. L., Hunter, T. R., & Cyganowski, C. J. 2021, ApJ, 923, 263 [NASA ADS] [CrossRef] [Google Scholar]
- Vacca, W. D., Garmany, C. D., & Shull, J. M. 1996, ApJ, 460, 914 [NASA ADS] [CrossRef] [Google Scholar]
- Wang, Y., Zhang, Q., Pillai, T., Wyrowski, F., & Wu, Y. 2008, ApJ, 672, L33 [NASA ADS] [CrossRef] [Google Scholar]
- Wang, K., Zhang, Q., Testi, L., et al. 2014, MNRAS, 439, 3275 [Google Scholar]
- Wienen, M., Wyrowski, F., Schuller, F., et al. 2012, A&A, 544, A146 [NASA ADS] [CrossRef] [EDP Sciences] [Google Scholar]
- Wienen, M., Wyrowski, F., Menten, K. M., et al. 2015, A&A, 579, A91 [NASA ADS] [CrossRef] [EDP Sciences] [Google Scholar]
- Williams, J. P., & Myers, P. C. 2000, ApJ, 537, 891 [Google Scholar]
- Zhang, Q., & Wang, K. 2011, ApJ, 733, 26 [Google Scholar]
- Zinnecker, H., & Yorke, H. W. 2007, ARA&A, 45, 481 [Google Scholar]
Appendix A Physical parameters of ammonia cores derived from the NH3 line fitting
The averaged parameters for total ammonia cores.
Appendix B Radial variations in the properties of ammonia cores
Radial variations of kinetic temperature and nonthermal velocity dispersion in ammonia cores, with 1.3 mm continuum and CO 2–1 outflow associations.
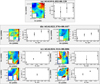 |
Fig. B.1 σnon map of the NH3(1,1) main line shown as the colored background in the left panel. The dashed circular ring outlines the averaged regions used for the NH3(1,1) and NH3(2,2) spectra. The black contours show the 1.3 mm continuum with the same contour levels as those in Fig. 1. The black circle indicates the beam size of the 1.3 mm continuum observation, while the red circle denotes the beam size of the NH3(1,1) line. Radial variation of σnon from the center to the outer regions is marked in black in the right panel. |
All Tables
Radial variations of kinetic temperature and nonthermal velocity dispersion in ammonia cores, with 1.3 mm continuum and CO 2–1 outflow associations.
All Figures
|
Fig. 1 Velocity-integrated intensity of the NH3(1,1) inner left satellite line shown in the background, overlaid with black contours of the 1.3 mm continuum and red contours of the 1.3 cm continuum. The exception is panel (d), which shows the inner left satellite line of the blue component and the inner right satellite line of red components for AGAL031.024+00.262. The noise level (σ) of the velocity-integrated intensities are 0.6, 1.1, 0.3, and 0.3 K km s−1, respectively. The blue contours show the leaf structures identified by the astrodendro framework. The dotted circle marks the field of view in the SMA observation. The beam size in the left bottom consists of the ammonia lines for the red ellipse and 1.3 mm continuum for the black ellipse. The adopted contours are different for each of the four sources. The rms noise levels are listed in Table 2. (a) Contours start at 3 · rms, stepping with 4 · rms for the black contours and 2 · rms for the red contours. (b) Contours start at 3.5 · rms, stepping with 1 · rms for both black and red contours. (c) Contours start at 3 · rms, stepping with 4 · rms for the black contours and 2 · rms for the red contours. (d) Contours start at 3 · rms, stepping with 3 · rms for the black contours and 1 · rms for the red contours. |
| In the text | |
|
Fig. 2 Left: example of identified dense core, outlined by a blue ellipse with its center marked by a red star. The colored background is the NH3(1,1) satellite-line intensity, also shown with gray contours. The red circle indicates the beam sizes of the NH3(1,1) line. Right: averaged NH3(1,1) line profile for each annular region as a black solid line, and the averaged spectral profile with the pixel-by-pixel velocity axis referenced to VLSR as a red dashed line. The fitting parameters are denoted by black and red text, respectively. The VLSR values of the spectra are 114.26, 114.27, 114.18, and 114.07 km s−1 for the black lines before they are aligned to zero. Top to bottom: spectra corresponding to regions from the core center to the outer areas. |
| In the text | |
|
Fig. 3 Left: σnon map of the NH3(1,1) main line shown as the colored background. The dashed circular ring outlines the averaged regions used for the NH3(1,1) and NH3(2,2) spectra. The black contours show the 1.3 mm continuum with the same contour levels as those in Fig. 1. The black circle indicates the beam size of the 1.3 mm continuum observation, while the red circle denotes the beam size of the NH3(1,1) line. Right: radial variation of σnon from the center to the outer regions, marked in black. For the source AGAL031.024+00.262, the two colored labels represent the blue- and redshifted components of the NH3(1,1) main line. |
| In the text | |
|
Fig. 4 Correlations between σnon and both Tk and Ntot for the ammonia cores with single velocity components, as well as for the blue- and redshifted components of AGAL031.024+00.262. Different colored markers represent the averaged parameters of each core, and the black outlines indicate the ammonia cores that are associated with the 1.3 cm continuum emission. |
| In the text | |
|
Fig. 5 Distribution of the NH3(1,1) main line to inner left satellite line ratios in pixel space for AGAL022.376+00.447 shown in the first panel. The second panel presents the variation of this ratio as a function of optical depth for the NH3(1,1) main line, where the yellow curve denotes the modeled trend, the blue horizontal line marks the reference ratio of 1.6, and the dashed lines indicate the corresponding 20% uncertainty. The third panel displays the averaged NH3(1,1) spectra of core 1 in AGAL022.376+00.447, with the fitted components shown as blue and red profile. |
| In the text | |
|
Fig. B.1 σnon map of the NH3(1,1) main line shown as the colored background in the left panel. The dashed circular ring outlines the averaged regions used for the NH3(1,1) and NH3(2,2) spectra. The black contours show the 1.3 mm continuum with the same contour levels as those in Fig. 1. The black circle indicates the beam size of the 1.3 mm continuum observation, while the red circle denotes the beam size of the NH3(1,1) line. Radial variation of σnon from the center to the outer regions is marked in black in the right panel. |
| In the text | |
Current usage metrics show cumulative count of Article Views (full-text article views including HTML views, PDF and ePub downloads, according to the available data) and Abstracts Views on Vision4Press platform.
Data correspond to usage on the plateform after 2015. The current usage metrics is available 48-96 hours after online publication and is updated daily on week days.
Initial download of the metrics may take a while.