


Fig. 1
Download original image
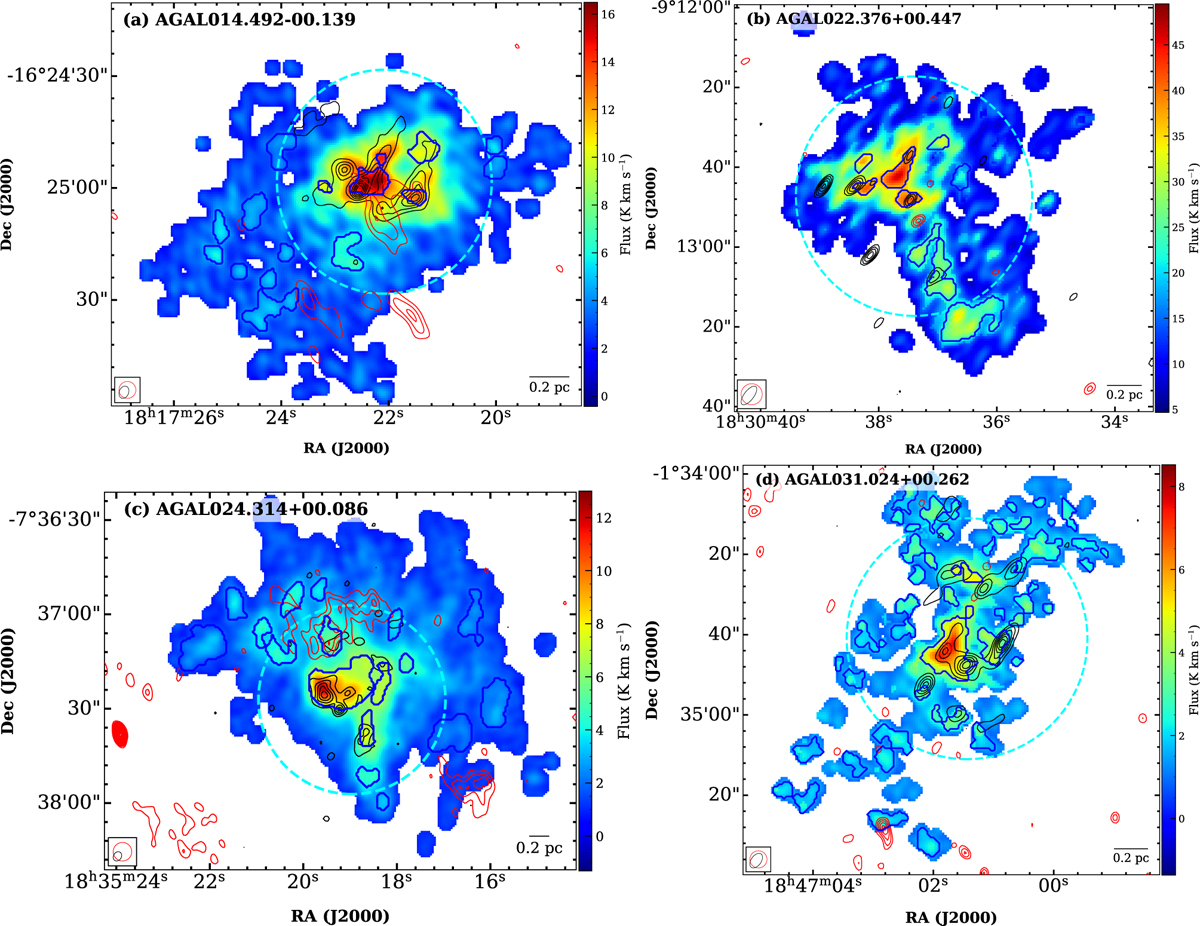
Velocity-integrated intensity of the NH3(1,1) inner left satellite line shown in the background, overlaid with black contours of the 1.3 mm continuum and red contours of the 1.3 cm continuum. The exception is panel (d), which shows the inner left satellite line of the blue component and the inner right satellite line of red components for AGAL031.024+00.262. The noise level (σ) of the velocity-integrated intensities are 0.6, 1.1, 0.3, and 0.3 K km s−1, respectively. The blue contours show the leaf structures identified by the astrodendro framework. The dotted circle marks the field of view in the SMA observation. The beam size in the left bottom consists of the ammonia lines for the red ellipse and 1.3 mm continuum for the black ellipse. The adopted contours are different for each of the four sources. The rms noise levels are listed in Table 2. (a) Contours start at 3 · rms, stepping with 4 · rms for the black contours and 2 · rms for the red contours. (b) Contours start at 3.5 · rms, stepping with 1 · rms for both black and red contours. (c) Contours start at 3 · rms, stepping with 4 · rms for the black contours and 2 · rms for the red contours. (d) Contours start at 3 · rms, stepping with 3 · rms for the black contours and 1 · rms for the red contours.
Current usage metrics show cumulative count of Article Views (full-text article views including HTML views, PDF and ePub downloads, according to the available data) and Abstracts Views on Vision4Press platform.
Data correspond to usage on the plateform after 2015. The current usage metrics is available 48-96 hours after online publication and is updated daily on week days.
Initial download of the metrics may take a while.