


Fig. 5
Download original image
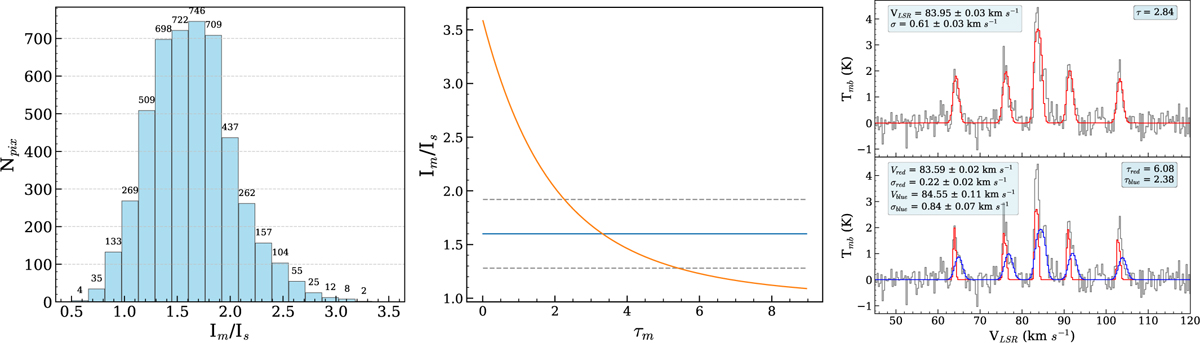
Distribution of the NH3(1,1) main line to inner left satellite line ratios in pixel space for AGAL022.376+00.447 shown in the first panel. The second panel presents the variation of this ratio as a function of optical depth for the NH3(1,1) main line, where the yellow curve denotes the modeled trend, the blue horizontal line marks the reference ratio of 1.6, and the dashed lines indicate the corresponding 20% uncertainty. The third panel displays the averaged NH3(1,1) spectra of core 1 in AGAL022.376+00.447, with the fitted components shown as blue and red profile.
Current usage metrics show cumulative count of Article Views (full-text article views including HTML views, PDF and ePub downloads, according to the available data) and Abstracts Views on Vision4Press platform.
Data correspond to usage on the plateform after 2015. The current usage metrics is available 48-96 hours after online publication and is updated daily on week days.
Initial download of the metrics may take a while.