


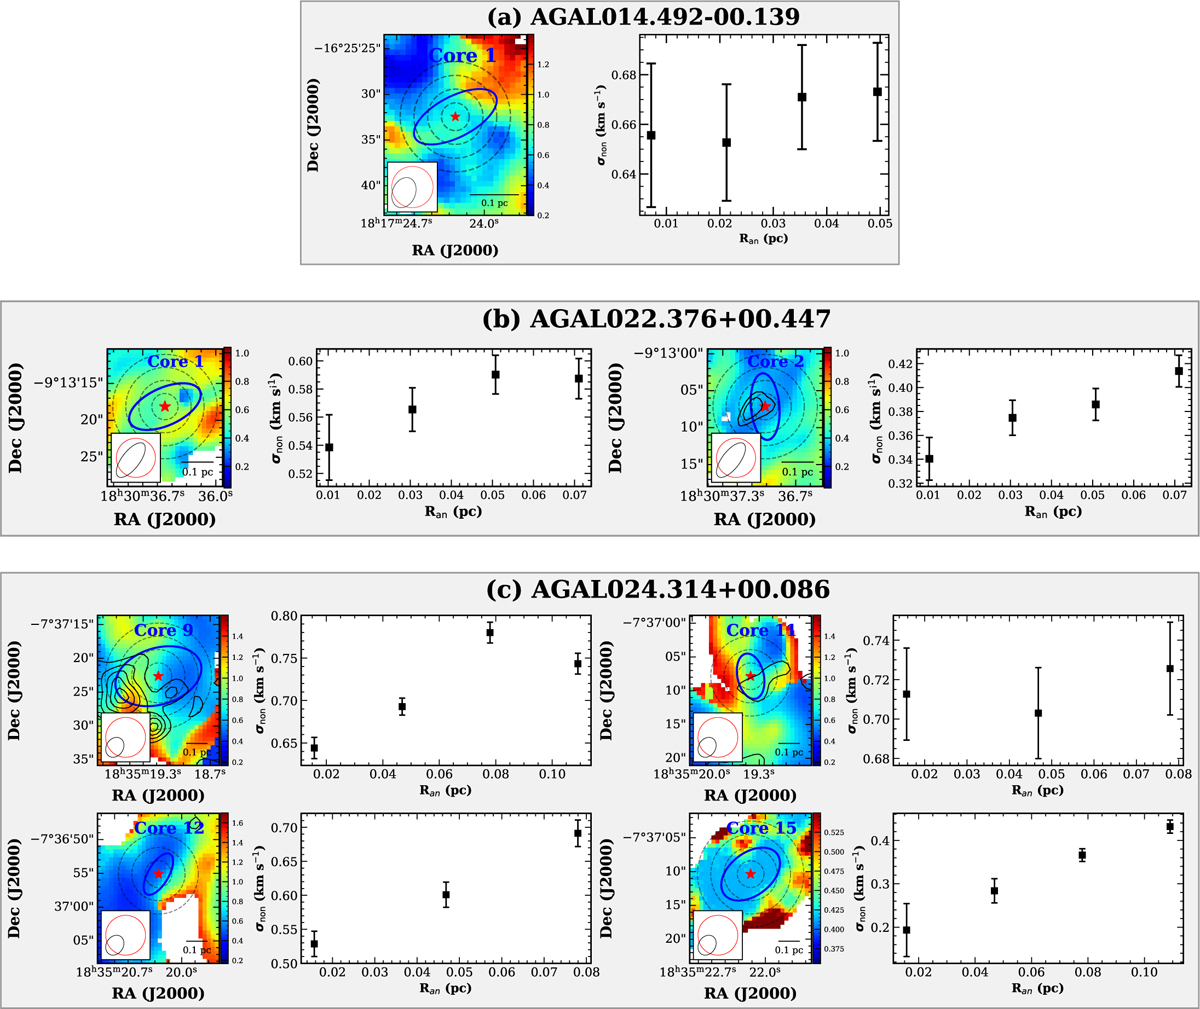
Fig. B.1
Download original image
σnon map of the NH3(1,1) main line shown as the colored background in the left panel. The dashed circular ring outlines the averaged regions used for the NH3(1,1) and NH3(2,2) spectra. The black contours show the 1.3 mm continuum with the same contour levels as those in Fig. 1. The black circle indicates the beam size of the 1.3 mm continuum observation, while the red circle denotes the beam size of the NH3(1,1) line. Radial variation of σnon from the center to the outer regions is marked in black in the right panel.
Current usage metrics show cumulative count of Article Views (full-text article views including HTML views, PDF and ePub downloads, according to the available data) and Abstracts Views on Vision4Press platform.
Data correspond to usage on the plateform after 2015. The current usage metrics is available 48-96 hours after online publication and is updated daily on week days.
Initial download of the metrics may take a while.