| Issue |
A&A
Volume 709, May 2026
|
|
|---|---|---|
| Article Number | A83 | |
| Number of page(s) | 26 | |
| Section | Stellar structure and evolution | |
| DOI | https://doi.org/10.1051/0004-6361/202659501 | |
| Published online | 06 May 2026 | |
Spatial and spectral constraints on resolved mass loss of the massive post-red supergiant star IRAS 17163–3907 and its Fried Egg Nebula
1
Joint ALMA Observatory, Alonso de Córdova 3107 Vitacura, Santiago, Chile
2
ESO, Alonso de Córdova 3107, Vitacura, Casilla, 19001 Santiago, Chile
3
Gemini Observatory/NSF’s NOIRLab, Casilla 603, La Serena, Chile
4
Royal Observatory of Belgium, Ringlaan 3, 1180 Brussels, Belgium
5
Department of Astrophysical Sciences, Princeton University, Princeton, NJ 08544, USA
6
Armagh Observatory and Planetarium, College Hill, Armagh BT61 9DG, UK
7
Observatoire de la Côte d’Azur Nice, 96 Boulevard de l’Observatoire, 06300 Nice, France
8
Department of Space, Earth, and Environment, Chalmers University of Technology, Onsala Space Observatory, 43992 Onsala, Sweden
9
Jodrell Bank Centre for Astrophysics, Alan Turing Building, The University of Manchester, Oxford Road, Manchester M139PL, UK
10
IAASARS, National Observatory of Athens, I. Metaxa & Vas. Pavlou St., 15236 Penteli, Athens, Greece
11
School of Physics & Astronomy, University of Leeds, Woodhouse Lane, LS2 9JT, Leeds, UK
12
National Astronomical Observatory of Japan, Los Abedules 3085 Oficina 701 Vitacura, Santiago 763 0000, Chile
13
The Graduate University for Advanced Studies, SOKENDAI, Osawa 2-21-1 Mitaka, Tokyo postcode181-8588 Japan
14
National Radio Astronomy Observatory, 520 Edgemont Road, Charlottesville, VA 22903, USA
15
Xinjiang Astronomical Observatory, Chinese Academy of Sciences, 150 Science 1-Street, Urumqi, Xinjiang 830011, China
16
Xinjiang Key Laboratory of Radio Astrophysics, 150 Science 1-Street, Urumqi, Xinjiang 830011, China
17
Nicolaus Copernicus Astronomical Centre, PAS, ul. Rabiańska 8, 87-100 cityToruń Poland
★ Corresponding author: This email address is being protected from spambots. You need JavaScript enabled to view it.
Received:
18
February
2026
Accepted:
12
March
2026
Abstract
Context. The fate of massive stars during the latest stages of their evolution is highly dependent on their mass-loss rate and geometry. The geometry of the mass-loss process can be inferred from the shape of the circumstellar material, which has a significant influence on the evolution of massive stars (between 25 and 40 M⊙), i.e. type II SN progenitors. In this context, post-red supergiants (post-RSGs) offer an excellent opportunity to study mass-loss events.
Aims. We aim to investigate the mass-loss history, geometry, and physical conditions of the yellow hypergiant in a post-RSG stage, IRAS 17163−3907 (IRAS 17163, also known as the ‘Fried Egg’ nebula). We place it in context with another famous evolved massive star, the yellow hypergiant IRC+10420.
Methods. We combine M-band spectra of the source using high-resolution CRIRES+ spectroscopy, with VLTI/MATISSE mid-infrared interferometry in the L-band, and FORS2 optical spectropolarimetry to probe both the small-scale circumstellar structure and the large-scale dusty environment of IRAS 17163. The interferometric observables were analysed with simple geometric fitting and a more advanced parametric modelling using PMOIRED to extract the morphology of the hot inner shell that was previously reported via radiative transfer modelling.
Results. The CRIRES+ spectrum provides the first M-band coverage of IRAS 17163, revealing prominent low-excitation metal lines and hydrogen recombination features, but lacking the pronounced CO absorption seen in IRC+10420. The MATISSE observations reveal the first high angular scales of the source in the L-band and spatially resolve the Brα line-emitting region, which is a factor of two more extended than the continuum emission and hints at a marginally asymmetric and variable ionised wind. FORS2 spectropolarimetry shows intrinsic continuum polarisation and line effects in the Stokes Q parameter across Hα, pointing to deviations from perfect spherical symmetry also on larger scales. The interferometry reveals no evidence for a binary companion within the explored parameter space, indicating that the observed clumpy and time-variable mass loss is likely intrinsic to the star rather than companion-driven.
Conclusions. Our results demonstrate that IRAS 17163 hosts a dense, structured, and time-variable wind, coexisting with extended dusty shells. Comparison with IRC+10420 highlights the diversity among post-RSG yellow hypergiants, with IRAS 17163 showing an ionised environment without apparent molecular signatures. These findings emphasise the role of clumpy and near-symmetric mass loss in shaping the circumstellar medium of evolved massive stars, with implications for their subsequent evolution and core-collapse supernova progenitor properties.
Key words: techniques: interferometric / stars: AGB and post-AGB / stars: evolution / stars: massive / stars: mass-loss / stars: individual: IRAS 17163−3907
© The Authors 2026
 Open Access article, published by EDP Sciences, under the terms of the Creative Commons Attribution License (https://creativecommons.org/licenses/by/4.0), which permits unrestricted use, distribution, and reproduction in any medium, provided the original work is properly cited.
This article is published in open access under the Subscribe to Open model. This email address is being protected from spambots. You need JavaScript enabled to view it. to support open access publication.
1. Introduction
Massive stars (> 8 M⊙) are among the most influential objects in the universe: they provide the primary energy budget in galaxies, enrich the chemical composition of the interstellar medium by producing heavy elements, and even trigger star formation in their immediate surroundings. Many important open issues related to the final stages of stellar evolution can only be addressed once we comprehend the geometry of circumstellar material close to the star. For massive stars, which eventually explode as core-collapse supernovae (SNe), the problem of understanding the mass-loss rate and the mass-loss geometry is particularly acute (e.g. Heger & Langer 1998; Heger et al. 2003; Langer 2012; Smith 2014). Mass-loss events impact angular momentum evolution and the final mass, and thus the fate of the individual massive star. In addition, these mass-loss events create the circumstellar environment with which supernova (SN) ejecta will interact. Following an SN explosion, the mass-loss history of the progenitor is reflected in the light-curve morphology and it is likely also observed aspherical SN remnants (Moriya et al. 2014).
However, the physical mechanisms that govern mass loss and shape the ejecta of evolved massive stars are still poorly constrained. Proposed drivers include pulsational instabilities (e.g. Lobel et al. 1994; de Jager 1998) and radiation pressure acting on the spectral lines. Line-driven winds are subject to changes in radiative acceleration associated with the bi-stability jumps, which can strongly affect wind velocity and mass-loss rates. In particular, the second bi-stability jump that occurs at T ∼ 8800 K due to the recombination of Fe III to Fe II is the most relevant in the context of yellow hypergiants (YHGs) and post-RSG objects (Vink et al. 1999, 2000, 2001; Petrov et al. 2016). Yet distinguishing between these mechanisms observationally remains challenging, as accurate constraints on the dynamics, geometry, and timescales of mass loss are scarce.
In recent years, binarity has emerged as an increasingly important ingredient in shaping the circumstellar environments of evolved massive stars. Binary interaction can influence mass-loss rates, angular momentum evolution, and outflow geometry, leading to asymmetric nebulae, cavities, and complex shell morphologies that may not be easily explained by single-star wind models alone. High angular resolution observations have recently begun to resolve such systems directly, revealing the impact of binarity on mass loss and nebular structure in post-RSG objects (e.g. AFGL 4106, Tomassini et al. 2026). Motivated by these results, the assessment of the presence and potential role of companions has become an integral part of interpreting the circumstellar geometry of evolved massive stars.
Post-red supergiants (post-RSGs) are rare but crucial laboratories for investigating these processes. Among them, the A–K type YHGs are particularly important, as they exhibit high mass-loss rates and dusty circumstellar envelopes, making them excellent candidates to study episodic ejections and the transition toward the blue supergiant phase. Examples include IRC+10420, HD 179821, and IRAS 17163−3907. For reviews of the matter, see Jones (2025), Gordon & Humphreys (2019), Oudmaijer et al. (2009), and de Jager (1998).
In this work, we focus on IRAS 17163−3907 (WRAY 15-1676, IRAS 17163 hereafter), also known as the ‘Fried Egg Nebula’ due to its multiple detached shell morphology (Lagadec et al. 2011). At an estimated initial mass of 25–40 M⊙ and a distance of about 1.2 kpc (see Sect. 5.1, and Koumpia et al. 2020), IRAS 17163 is one of the brightest infrared sources in the sky and one of the best-studied post-RSG candidates. Its A6 Ia optical spectrum closely resembles that of IRC+10420, suggesting that it is evolving towards the blue part of the Hertzsprung–Russell diagram (e.g. Meynet et al. 2015). We note that the designation of IRAS 17163 as a post-RSG reflects an evolutionary interpretation rather than a direct observational classification; however, its high luminosity, extended detached dusty shells, chemical properties, and similarity to archetypal objects such as IRC+10420 strongly support an evolutionary scenario in which the star has already passed through a red supergiant phase (e.g. Lagadec et al. 2011; Koumpia et al. 2020).
The detached shells appear circularly symmetric to first order in far-infrared Herschel and VLT/VISIR images, but the substructure is also clearly present, with far-IR dust clumps co-spatial with enhanced CO emission (Lagadec et al. 2011; Hutsemékers et al. 2013; Wallström et al. 2015). ALMA Compact Array (ACA) observations of the Fried Egg Nebula have revealed a red-shifted spur extending to ∼20″, suggestive of a past, possibly unidirectional mass-ejection event (Wallström et al. 2017). These properties provide evidence for episodic and possibly asymmetric mass loss. While the detached shells of IRAS 17163 trace the circumstellar environment at large distances from the star (> 1″, ≳1200 au at 1.2 kpc), the innermost regions remain comparatively unconstrained (Koumpia et al. 2020).
In this work, we combine high angular-resolution mid-infrared interferometry, high-resolution mid-infrared spectroscopy, and optical spectropolarimetry to probe both the small-scale ionised and dusty environment and the larger-scale circumstellar morphology of this key post-RSG object. We therefore aim to obtain a coherent view of mass loss across several orders of magnitude in radius. To place IRAS 17163 in the broader context of yellow hypergiant evolution, we additionally present CRIRES+ M-band data of the archetypal post-RSG IRC+10420. Its rapid spectral changes and resolved ionised and dusty structures have made it a key reference object (e.g. Oudmaijer et al. 1994, 1996; Humphreys et al. 1997, 2002; Koumpia et al. 2022). We directly contrast its spectral properties with those of IRAS 17163, thereby probing the diversity of mass-loss behaviour across this rare evolutionary phase.
This paper is structured as follows. Section 2 describes the observations and data reduction procedures for the CRIRES+, VLTI/MATISSE, and FORS2 datasets. Section 3 presents the observational results, while Sect. 4 focuses on geometric and parametric modelling of the interferometric data. In Sect. 5 we discuss the implications for the mass-loss geometry and evolutionary status of IRAS 17163, and in Sect. 6 we summarise our conclusions.
2. Observations and data reduction
2.1. Spectroscopy – CRIRES+
Mid-infrared spectroscopic observations of both IRAS 17163 and IRC+10420 were carried out on 15 September 2021 using the CRyogenic InfraRed Echelle Spectrograph (CRIRES) Upgrade, CRIRES+ (Dorn et al. 2014, 2023) mounted on Unit Telescope 3 (UT3) of the Very Large Telescope (VLT) at ESO’s Paranal Observatory, Chile (Program ID: 107.22TZ.001). CRIRES+ provides high-resolution spectroscopy in the infrared domain, and the observations were conducted in nodding mode, which enables effective background subtraction.
The targets were observed at global central wavelengths of 4265.706 nm, 4318.114 nm, 4368.182 nm, and 4415.885 nm, covering distinct spectral windows within the range of 3412 nm – 5359 nm, using the four spectral settings, M4266, M4318, M4368, and M44161, respectively. CRIRES+ is equipped with a detector mosaic comprising an array of three Hawaii 2RG detectors, or ‘chips’, with a read-out window size of 6144 × 2048 pixels and an 18 micron pixel size. The CRIRES+ detector records multiple orders simultaneously. In this case, six orders are covered per spectral set-up, with a wavelength bandwidth between 175 nm and 340 nm (increasing with wavelength). The spectrograph was configured in high-resolution spectroscopy mode. The slit width was set to 0.2″, which corresponds to a resolving power of R ∼ 80 000, with a slit length of 10″. The total exposure time per frame was 1.427 s.
The observations were conducted under adaptive optics (AO) correction with the system operating in closed-loop mode. The guide star used for the AO corrections was located at RA = 17:19:17.2, Dec = −39:14:10.5 with an R-band magnitude of 9.185. The atmospheric conditions measured at the time of observation indicated a mean Strehl ratio of 0.569, a seeing corrected by airmass of 1 arcsec, a Fried parameter (r0) of 1.910 m, and a correlation time (τ0) of 33.575 s. These conditions allowed optimal correction of wavefront distortions, ensuring high spectral resolution.
Standard calibration frames, including darks and flats, were obtained as part of the standard ESO calibration plan. Data were reduced using the CR2RES pipeline recipes (version 1.1.72), within the ESO Reflex environment, which includes corrections for bad pixels, background subtraction, and spectral extraction. Post-processing of the spectra included telluric correction and a refinement of the wavelength calibration using atmospheric absorption features. The default pipeline wavelength solution (obtained without the use of a gas cell) has an absolute accuracy of approximately three detector pixels. At the spectral resolving power of CRIRES+ (R ∼ 8 × 10⁴–105), this corresponds to roughly one resolution element, that is, an absolute velocity uncertainty of ∼4 km s−1. The subsequent alignment to telluric features improves the relative wavelength scale within each spectrum.
2.2. Interferometry – MATISSE
Interferometric observations of IRAS 17163 were carried out using the Multi AperTure mid-Infrared SpectroScopic Experiment (Lopez et al. 2022; Woillez et al. 2024, MATISSE) on the four Auxiliary Telescopes (ATs) of the Very Large Telescope Interferometer (VLTI) at Paranal Observatory. The observations were conducted over multiple nights between April 2022 and March 2023 in both standalone and imaging/GRA4MAT modes (fringe stabilisation was achieved using the GRAVITY fringe tracker), utilising the following AT configurations: A0-B2-D0-C1, A0–G1–J2–J3, A0–G2–J2–J3, A0–B2–D0–J3, K0–G2–D0–J3, and A0–G1–D0–J3, under ESO program IDs 109.22VF.001 (small), 109.22VF.002 (medium), 109.22VF.003 (imaging in all three configurations), and 109.22VF.005 (large). A summary of the interferometric data finally used in this work is provided in Table B.1. Given that the observations span several months, we note that potential time variability on sub-au to few-au scales cannot be excluded a priori; any evidence for or implications of such variability are addressed in the analysis and discussion sections.
MATISSE operates in the L, M, and N bands. The focus of this study is the L band (λ ≈ 3–4.2 μm), with a spectral resolving power of R ≈ 35 (LOW) for standalone observations and R ≈ 3300 (HIGH+) for imaging. The L-band detector integration time (DIT) was set to 0.111 s for standalone L-band observations and 10 s for the GRA4MAT imaging mode. The projected baselines ranged from 11 m to 130 m, corresponding to angular resolutions of approximately 65 mas to 5.5 mas for a representative wavelength of 3.5 μm in the L band, and position angles from 0° to 170° (Table B.1). At an estimated distance of 1.2 kpc to IRAS 17163, these baselines allow us to probe spatial scales of down to ∼7 au.
The observing sequence followed the standard MATISSE calibration plan, alternating between the science target and a calibrator to account for instrumental and atmospheric effects. In particular, the standalone observations followed the standard CAL-SCI sequence, while during the imaging observations, each science observation was bracketed by calibrator measurements (CAL-SCI-CAL). Two calibrators were used during the observations: HD 156216, a standard calibrator listed in the JMMC catalog with flux densities of about 20 Jy in the L band, 17 Jy in the M band, and 3.3 Jy in the N band; and HD 127755, with L and N-band fluxes of 34 Jy and 2.2 Jy, respectively, retrieved from a SIMBAD-based catalogue (II/361/mdfc-v10; Cruzalèbes et al. 2019). Since HD 127755 was not listed in the JMMC catalogue, it was manually added as a calibrator FITS file during reduction. The K-band magnitudes of the calibrators are 2.5 mag for HD 156216 and 3.2 mag for HD 127755. The science target, IRAS 17163, has L and N-band fluxes of approximately 213 Jy and 400 Jy, respectively.
The observations were carried out under generally good atmospheric conditions. The optical seeing during science exposures ranged from 0.4″ to 0.88″, with a median value of approximately 0.6″. The atmospheric coherence time (τ0) varied between 4.1 and 8.4 ms on observing nights, typically remaining above 5 ms. These conditions ensured stable fringe tracking and meaningful interferometric data, although some observations were affected by transient instabilities or partial data loss, which were excluded from the final dataset.
Data were reduced using standard MATISSE data reduction pipeline recipes (version 2.0.23), provided by ESO. The reduction process involved the transformation of raw interferometric frames into calibrated observables (squared visibilities, closure phases, and differential phases) using the mat_raw_estimates and mat_cal_oifits recipes. These steps included background subtraction, flat-fielding, bad pixel correction, optical distortion correction, and the estimation of interferometric observables through Fourier analysis. The final calibrated observables were exported in the OIFITS format for further analysis.
2.3. Spectropolarimetry – FORS2
Observations of IRAS 17163 were conducted using the FOcal Reducer and low dispersion Spectrograph (FORS) in spectropolarimetric (PMOS) mode, mounted at the UT1 Cassegrain focus of the VLT (Appenzeller et al. 1998). Data were collected over two epochs, on 4 and 8 July 2023, as part of the ESO program ID 111.24P0.004. Seeing conditions ranged between 0.9″ and 1.2″. The sky was clear on 4 July, while thick cirrus clouds were present during the observations on 8 July.
FORS2 contains a Wollaston prism that splits the incoming light into two orthogonally polarised components: the ordinary (o) and extraordinary (e) beams. IRAS 17163 was observed at each epoch through the 300V grism (λc = 590 nm, λ/Δλ = 440) with and without the GG435 order-separating filter. The GG435 filter, which has a cut-off wavelength around 435 nm, suppresses second-order spectral contamination. While second-order effects are usually minimal in spectropolarimetric data, they can become non-negligible for particularly blue sources (see Patat et al. 2010, Appendix).
Each polarisation sequence involved positioning the half-wave retarder plate at four distinct angles: 0, 22.5, 45, and 67.5 degrees. The raw data were bias-subtracted but not flat-fielded; however, the impact of detector inhomogeneities is mitigated by using multiple retarder plate positions (Patat & Romaniello 2006). Cosmic rays were removed using L.A.Cosmic (van Dokkum 2001).
The o and e beams were extracted using standard procedures implemented in IRAF, as described in Cikota et al. (2017). Wavelength calibration was performed using exposures of He–Ne–Ar arc lamps, achieving a typical rms accuracy of about 0.3 Å. The Stokes Q and U parameters, the polarisation degree P, and the polarisation angle θ were calculated following the FORS2 user manual and as described in, for example, Cikota et al. (2017). The flux spectrum was calculated by combining all the ordinary and extraordinary beams. The flux calibration is based on a sensitivity curve template and is therefore suitable only for qualitative comparison with the polarisation data.
3. Observational results
3.1. M-band spectrum
We present the M-band spectrum of the yellow hypergiant IRAS 17163, obtained with CRIRES+, covering hydrogen recombination lines (Brackett, Pfund, and Humphreys series), CO rovibrational transitions (v = 1 → 0), and selected atomic and molecular features that trace the innermost circumstellar environment. To aid interpretation, we also obtained and analysed similar CRIRES+ observations of the well-studied post-RSG yellow hypergiant IRC+10420, allowing for a direct comparison between two sources at a similar evolutionary stage. Spectral features of IRC+10420 are overplotted in all relevant figures for reference (see Figs. 1–3, A.1, and A.2 and Table A.1). The full spectral coverage was systematically examined to identify secure line detections, tentative features, and non-detections. An overview of all CRIRES+ spectral windows with the line identifications of the most prominent transitions is presented in Fig. A.1.
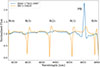 |
Fig. 1. CRIRES+ spectra comparison of IRAS 17163 (blue) and IRC+10420 (yellow), showing the Pfundβ line and CO R-branch transitions. The fluxes are normalised, and a telluric correction has been applied. |
The first overtone transitions of CO (ν = 1 → 0), particularly in the R and P-branches, exhibit stark contrasts between the sources (e.g. Fig. 1). IRC+10420 displays well-defined absorption features across multiple transitions (e.g. R(0)–R(6), P(1)–P(3)), consistent with classical P Cygni morphologies and the presence of a molecular envelope (Fig. A.1). Conversely, IRAS 17163 shows little to no absorption in CO lines (Fig. A.1). Tentative weak absorption features are more difficult to characterise, given the strong atmospheric contributions that limit the confidence of their detection. For a more direct comparison, the fitted parameters for the line profiles of both sources, including peak velocities, full width at half maximum (FWHM), and equivalent widths, are listed in Table A.1. Tentative features were also observed among the higher-order P-branch transitions (e.g. upwards of P(3)), although several are potentially affected by telluric residuals or insufficient S/N (Fig. A.1).
Hydrogen recombination lines including Br α, Pf β, Pf γ, Hu δ, and Hu ϵ are clearly detected in IRAS 17163, typically displaying asymmetric emission profiles (e.g. Figs. 2 and 3). Notably, Pf β and Pf γ exhibit broad wings and P Cygni profiles. These lines are also present in IRC+10420. The Br α line shows strong emission in both stars, with a redshifted peak in IRC+10420 consistent with its higher systemic velocity relative to IRAS 17163. Several Humphreys transitions (Hu δ, Hu ϵ, Hu θ) and higher excitation lines (e.g. H 20–7) are present in IRAS 17163. These lines are absent or significantly weaker in IRC+10420. The H2 S(n) transitions were searched for in both targets but remained undetected at the 3σ level, consistent with its expected weakness and susceptibility to atmospheric interference.
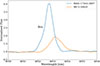 |
Fig. 2. Normalised and telluric corrected CRIRES+ spectra of IRAS 17163 (blue) and IRC+10420 (yellow) around the Brackett α line at ∼4.052 μm. The emission is significantly stronger in IRAS 17163 compared to IRC+10420, indicating a higher density of ionised gas in the inner wind region. |
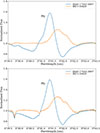 |
Fig. 3. Comparison of the Pfund γ line profiles in IRAS 17163 and IRC+10420 before (top) and after (bottom) telluric correction. The uncorrected profile shows residual atmospheric features affecting both the continuum and line wings, while the corrected version provides a cleaner view of the intrinsic emission and absorption structure. |
Several metal lines were examined, including Fe II, Mg I, and Ti I. The C I/Fe IIλ4061.77 nm line is reliably detected in IRAS 17163 based on peak strength and redshift, but remains uncertain in IRC+10420. Although other potential features have been detected (see Fig. A.2), these require further verification through line-fitting and comparison with spectral atlases.
This comparison reveals distinct kinematic and excitation properties between the two YHGs. The observed differences may reflect different mass-loss histories or viewing geometries between the two sources, and we return to their interpretation in Sect. 5.
3.2. Interferometric observables
3.2.1. Visibilities and phases
The VLTI/MATISSE observations of IRAS 17163 were obtained in the L band, covering the Brα transition at 4.05 μm. The wide range of baselines (Fig. 4) allowed us to probe both compact and extended spatial scales, from the warm dust close to the sublimation rim to the more diffuse ionised gas.
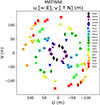 |
Fig. 4. uv-plane of the MATISSE observations. Each point corresponds to a projected baseline at a given wavelength. The plot includes all configurations used, illustrating the sampling of the (u, v) plane across different hour angles and baseline lengths. This coverage enables detailed image reconstruction and model fitting. |
In the continuum, the source is only moderately resolved: the calibrated visibilities remain high (0.8–0.95) at short and intermediate baselines, and decrease to ∼0.75 at the longest baselines (Table B.1). This behaviour is consistent with a compact continuum-emitting region of a few milliarcseconds in size.
In contrast, Brα visibilities display a stronger dependence on baseline length. They range from near unity on short baselines, to 0.6–0.8 at intermediate baselines, and fall to as low as 0.2–0.4 on the longest baselines. This pronounced drop demonstrates that the Brα-emitting region is substantially more extended than the continuum-emitting region.
The differential phases exhibit marginal excursions across Brα, with perhaps subtle S-shaped profiles (Sect. 4.2 and figures therein), which could hint at photocentre shifts of a few tenths of a milliarcsecond along the projected baselines. The S/N is not sufficient for robust detections on those signals. The closure phases show no significant variation along the line emission or the continuum. We conclude that the Brα emission originates from an extended and close to symmetric structure, yet distinct from the more compact L-band continuum emission.
3.2.2. Spectra
Figure 5 shows the normalised Brα emission profiles extracted from the MATISSE L-band spectra over multiple epochs. The line exhibits a consistently strong emission peak centred at λ = 4.052 μm, corresponding to the systemic velocity within the instrumental resolution. The profiles are broad, with total velocity extents of ∼200–250 km s−1, corresponding to Gaussian FWHM values of ∼110–130 km s−1, and show relatively symmetric wings without evidence of significant absorption or P Cygni-type features.
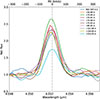 |
Fig. 5. Brα line profiles observed with MATISSE, corrected for heliocentric velocity shifts, and overplotted for all available epochs. This comparison highlights the temporal variability in the line emission, revealing changes in both the line shape and intensity. The profiles have been normalised to the continuum and aligned in velocity space to facilitate direct comparison. |
Although the overall line shape remains stable, the peak intensity varies between epochs, with flux changes of up to ∼30%. Such variability on timescales of weeks to months indicates temporal changes in the ionised gas emission, plausibly linked to variations in the mass-loss rate or the excitation conditions of the wind. In later epochs (+316 d), the line appears systematically weaker, suggesting a long-term decline in the emission strength. The consistency of the line centroid across epochs confirms that the variability is intrinsic to the emitting region rather than caused by large-scale radial velocity shifts.
Each Brα spectrum was fitted with a Gaussian profile around the line centre. From these fits, we extracted the centroid velocity, FWHM, and equivalent width, with uncertainties derived from the covariance matrix. The resulting parameters are listed in Table B.2. Figure B.1 shows the temporal evolution of the Brα equivalent width, FWHM, and centroid velocity. The relative stability of the line centroid, combined with variability in line strength and width, points to intrinsic changes in the ionised wind rather than large-scale dynamical shifts.
Overall, the Brα line parameters remain broadly stable throughout the monitoring period, with modest but significant variations. The centroid velocity ranges between −14.5 and +4.9 km s−1, while the FWHM spans 110–129 km s−1. We note, however, that at the spectral resolving power of these observations (R ∼ 3300), one resolution element corresponds to ∼90 km s−1. The observed ∼20 km s−1 centroid excursions are therefore well below the instrumental velocity resolution and cannot be interpreted as genuine radial-velocity variations but instead reflect small profile or sampling differences within the unresolved line. The equivalent width varies from −1.12 to −2.67 nm, indicating changes in line strength, while no systematic drift in the centroid velocity is observed. Each Brα spectrum was measured independently for the four telescopes used and subsequently averaged. Because photometric calibration uncertainties are largely uncorrelated between individual telescopes, this averaging significantly suppresses instrumental systematics while preserving intrinsic spectral variability. The observed changes in equivalent width and line width are consistently present across all telescopes and exceed the expected residual calibration uncertainties, supporting their interpretation as genuine source variability rather than interferometric calibration effects.
A comparable pattern of line variability was previously observed in IRAS 17163 by Koumpia et al. (2020), who presented multi-epoch GRAVITY spectra over five months showing a gradual decrease of up to ∼67% in the Brγ peak intensity, while the Na I doublet remained constant within uncertainties of ∼13%. That study demonstrated that the continuum and Na I emission are stable on monthly timescales, with the variability originating exclusively in the hydrogen recombination lines. The Brα behaviour reported here follows this same trend: the centroid velocity remains stable across epochs, whereas the line flux varies.
The measured Brα line widths can be placed in a broader kinematic context by comparison with previous optical and millimetre observations of IRAS 17163. At larger scales, ACA observations reveal CO (2–1) and CO (3–2) emission associated with a fast molecular outflow, with expansion velocities up to ∼100 km s−1 and a FWHM of ∼60 km s−1 (Wallström et al. 2017). The Brα widths measured here (FWHM ∼110–130 km s−1) are comparable to or slightly exceed these molecular expansion velocities, consistent with Brα tracing dense ionised gas in an accelerating inner wind that connects the compact recombination-line region to the larger-scale molecular outflow. Optical Hα profiles (Wallström et al. 2015) show a pronounced P-Cygni morphology with extended wings; however, their apparent emission-core width is strongly affected by self-absorption and optical-depth effects (and potentially electron scattering), and therefore it is not directly comparable to Brα FWHM.
The centroid velocities measured in the CRIRES+ spectra further support this picture: they remain remarkably stable across all hydrogen recombination lines, with variations of only a few km s−1 (Table A.1). This argues against variability driven by orbital motion of a companion or by continuum fluctuations, and instead supports an origin intrinsic to the ionised wind (see Sect. 5).
3.3. Spectropolarimetry
3.3.1. Continuum polarisation
We examined the individual spectropolarimetric sequences of IRAS 17163 obtained on 4 and 8 July 2023, and compared them with each other. Data taken on 8 July through the GG435 order-separating filter were saturated and had to be excluded. However, the two epochs without the GG435 filter and the one epoch with the filter are all consistent with each other within the noise. Figure 6 shows the combined spectropolarimetric observations of IRAS 17163 without the GG435 filter, obtained on 4 and 8 July 2023.
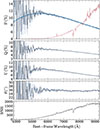 |
Fig. 6. Combined FORS2 spectropolarimetric observations of IRAS 17163 obtained on 4 and 8 July 2023. The blue line in the top panel shows the Serkowski fit to the polarisation spectrum, while the red line represents the flux spectrum for comparison. |
The polarisation curve can be described with the Serkowski law
![Mathematical equation: $$ \begin{aligned} \mathrm P(\lambda ) = P_{\max } \, \exp \left[ -K \, \ln ^{2} \left( \frac{\lambda _{\max }}{\lambda } \right) \right], \end{aligned} $$](/articles/aa/full_html/2026/05/aa59501-26/aa59501-26-eq1.gif) (1)
(1)
which empirically characterises the wavelength dependence of interstellar linear polarisation (Serkowski et al. 1975), where λmax is the wavelength at which the polarisation reaches its maximum, Pmax is the maximum polarisation, and K describes the width of the polarisation curve. The best-fit parameters are λmax = 5491.8 ± 76.7 Å, xPmax = 11.33 ± 0.08%, and K = 1.81 ± 0.14.
The interstellar reddening at the position of IRAS 17163 is E(B − V) = 9.80 ± 3.04 mag (Schlafly & Finkbeiner 2011), and the relatively high maximum polarisation Pmax ≃ 11.3 % is below the empirical upper limit between interstellar polarisation and reddening
![Mathematical equation: $$ \begin{aligned} P_{\max } \lesssim 9 \times E(B-V) \quad [\%] , \end{aligned} $$](/articles/aa/full_html/2026/05/aa59501-26/aa59501-26-eq2.gif) (2)
(2)
found by Serkowski et al. (1975).
Whittet & van Breda (1978) found an empirical relation between the wavelength of maximum polarisation and the ratio of total-to-selective extinction
![Mathematical equation: $$ \begin{aligned} R_V \simeq (5.6 \pm 0.3)\,\lambda _{\max } \,[\upmu \mathrm{m}], \end{aligned} $$](/articles/aa/full_html/2026/05/aa59501-26/aa59501-26-eq3.gif) (3)
(3)
where λmax is expressed in microns. A typical Galactic value is λmax ∼ 0.55 μm, which corresponds to RV ∼ 3.1, the standard Milky Way extinction curve. For IRAS 17163 we measure λmax = 5491.8 ± 76.7 Å, which yields RV = 3.07 ± 0.05, fully consistent with the standard Galactic extinction law.
For the width of the polarisation curve, we find K = 1.81 ± 0.14, which is slightly higher compared to the empirical relation λmax − K and found by Whittet et al. (1992)
![Mathematical equation: $$ \begin{aligned} K = (1.66 \pm 0.09)\,\lambda _{\max }[\upmu \mathrm{m}] + (0.01 \pm 0.05). \end{aligned} $$](/articles/aa/full_html/2026/05/aa59501-26/aa59501-26-eq4.gif) (4)
(4)
For a typical Galactic value of λmax ∼ 0.55 μm, this gives K ∼ 0.9. However, we note that, because it is a red object, the S/N of the spectropolarimetric data drops below ≲100 at wavelengths below 5000 Å (see Fig. 6), and the high K value may be an artefact due to the short wavelength coverage of the data.
Bagnulo et al. (2017) has shown using Monte Carlo simulations that the scatter in K and the λmax − K correlation depend on the wavelength range in which the observations are carried out. Furthermore, Cikota et al. (2017) found a systematic and statistically significant deviation of the K values in Whittet et al. (1992) compared to FORS data.
Thus, the parameters of the Serkowski curve are consistent with normal Milky Way dust, which implies that the polarisation of IRAS 17163 is produced by the Galactic interstellar medium along the line of sight. Moreover, IRAS 17163 displays a constant wavelength-independent polarisation angle of 25.8 ± 0.3 degrees (measured between 6000 and 9000 Å), which corresponds to 80.9 ± 0.3 degrees in Galactic coordinates at a position of l = 348.5108102 deg and b = −1.1201040 deg. The wavelength-independent polarisation angle is generally consistent with the polarisation being produced by dust within a single dominant cloud structure along the line of sight with a relatively uniform projected magnetic field orientation (see, e.g. Messinger et al. 1997).
We calculated bandpass-integrated polarisation by integrating the ordinary and extraordinary flux beams over the Bessell V, R, and I transmission functions and subsequently deriving the polarisation. The resulting polarisation values are PV = 11.22 ± 0.20%, PR = 9.83 ± 0.02%, and PI = 8.44 ± 0.01%. The polarisation angle remains nearly constant across the three bands, with θV = 24.92 ± 0.53°, θR = 25.33 ± 0.04°, and θI = 24.47 ± 0.02°.
Interestingly, our recent FORS2 spectropolarimetry of 2023 is fully consistent with the 2015 dataset presented in Koumpia et al. (2020), both in polarisation degree and position angle, suggesting a stable interstellar origin. In contrast, earlier measurements by Lebertre et al. (1989) report a higher polarisation level and a wavelength-dependent polarisation angle. They reported polarisation degrees from 12.7% in V to 12.1% in R and 11.5% in I (see their Table 5), while the polarisation angle changes from 27° (V) to 26° (R) and 24° (I). The broader wavelength coverage of the 2023 dataset confirms this difference and highlights that part of the 1988 signal may have been intrinsic, as already speculated by Koumpia et al. (2020).
3.3.2. Hα and Ca II line polarisation
We investigated the polarisation behaviour across the Hα line to probe the geometry of the circumstellar environment. Variations in polarisation across emission lines, which are intrinsically unpolarised, can provide information on scattering and spatial distribution of ionised material close to the star (e.g. Oudmaijer & Drew 1999). Detecting changes of polarisation between the continuum and the line emission offers direct evidence for the presence of an asymmetric structure in the innermost regions of the star (see also Sect. 3.3 in Koumpia et al. 2020).
We subtracted the continuum polarisation using wavelet decomposition, following the method described by Cikota et al. (2019, see Sect. 4.2), and present the unbinned and interstellar polarisation subtracted spectrum in Fig. 7. We confirm a ∼0.5% (∼2–3σ) increase in polarisation across Hα in Stokes Q, previously detected at higher significance in higher spectral resolution data in Koumpia et al. (2020), while Stokes U does not show significant variation. Both the detection of the polarisation in Q and the non-detection in U are consistent with the results reported by Koumpia et al. (2020). Furthermore, the data does not show obvious lines or loops in the Stokes Q − U plane.
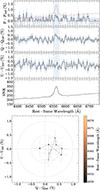 |
Fig. 7. Combined FORS2 spectropolarimetric observations of the Hα line in IRAS 17163 obtained on 4 and 8 July 4 2023. The data are unbinned and continuum-subtracted. The polarisation spectrum (top panel) has been corrected for polarisation bias. The red line in the top panel represents the flux spectrum. The light blue shading indicates the wavelength range 6550–6576 Å used for plotting the Hα line in the Q–U plane (bottom panel). |
The present spectropolarimetric data have a wider wavelength coverage than those in Koumpia et al. (2020) allowing the study of the full spectrum, and in particular the strong Ca II infrared triplet lines at 8498.018, 8542.089, and 8662.140 Å (Fig. 8). It would appear that all three lines show intrinsic line polarisation, which is more pronounced in Stokes Q than in Stokes U. It could be argued that the excursions are below the 3σ level; however, the line effects are observed in all three lines with Stokes properties Q and U similar to Hα, and thus may be real. In fact, line depolarisation has rarely been seen in lines other than Hα. Ababakr et al. (2016) were among the first to detect a line-effect in the Calcium triplet, which they explain as the Calcium lines arising from outside the (electron-scattering) ionised region. Generally, the detection of a change in polarisation across emission lines may indicate that the electron-scattering region is not spherical (i.e. there is axisymmetry; see, e.g. Patel et al. 2008).
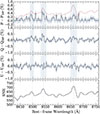 |
Fig. 8. Combined FORS2 spectropolarimetric observations of the Ca II triplet lines in IRAS 17163 obtained on 4 and 8 July 2023. The data is unbinned and continuum-subtracted. The polarisation spectrum (top panel) has been corrected due to polarisation bias. The red line in the top panel represents the flux spectrum. The light blue shading indicates the wavelength ranges used for plotting the Ca II line in the Q–U plane (Fig 9). |
The diagrams Q − U for the Ca II lines (Fig. 9) exhibit no clear loops or lines in the Stokes Q − U plane. The only possible exception is the 8498.018 Å line, which shows tentative indications of a loop-like feature. Loops in the Stokes Q − U plane may imply the presence of a clumpy or inhomogeneous medium whose scattering geometry changes with velocity (i.e. line-of-sight velocity shifts probe different scattering angles and/or regions).
 |
Fig. 9. Q–U diagrams for the Ca II infrared triplet lines in IRAS 17163, obtained on 4 and 8 July 2023. The data are unbinned and continuum-subtracted. The left, centre, and right panels correspond to the Ca II 8498.018 Å, 8542.089 Å, and 8662.140 Å lines, respectively. |
Polarisation bias arises because the polarisation degree  is always positive, even when the true signal is zero. Noise in the Stokes parameters Q and U therefore leads to a systematic overestimation of P. We apply the polarisation bias correction following Wang et al. (1997):
  , where h is the Heaviside function, Pobs is the observed polarisation, and σp is the 1σ error on the polarisation.
4. Interferometric modelling
To interpret the VLTI/MATISSE observables of IRAS 17163, we adopted a stepwise modelling strategy. As a first step, we applied simple geometric brightness distributions to the continuum and Brα line emission to derive basic size estimates and assess the relative extent of the two components. These models provide a useful benchmark and highlight the systematic differences between the compact L-band continuum and the more extended hydrogen line emission. Building on these results, we then employed the parametric spectro-interferometric tool PMOIRED, which allows simultaneous fitting of visibilities, closure phases, differential phases, and flux spectra. This approach enabled us to test progressively more sophisticated descriptions of the source geometry and to explore how additional free parameters improve the fit quality and capture the observed asymmetries.
4.1. Simple geometric models
Before applying detailed spectro-interferometric modelling with PMOIRED, we performed simple fits of the visibility amplitudes using standard geometric brightness distributions (Gaussian, uniform disc, and ring; Fig. 10) in Python. This approach provides a first-order estimate of the characteristic size of the continuum and Brα–emitting regions. In all cases, the Brα emission is found to be about a factor of two larger than that of the compact continuum source.
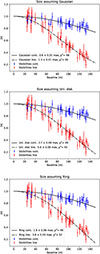 |
Fig. 10. Visibility amplitudes as a function of baseline length, shown for the continuum (averaged for 4.04-4.05 μm and 4.054-4.06 μm; blue), and at the peak of the Brα line emission at 4.052 μm (red). The observed visibilities are fit to three different brightness distributions: a Gaussian (top), a uniform disc (middle), and a ring (bottom). By fitting these models to the observed visibilities, we infer the characteristic size of the emitting region for both the continuum and the Brα emission. The fitted size and reduced χ2 values for each model are indicated in the corresponding panels, allowing comparison of model performance. |
The Gaussian model yields characteristic sizes of ∼0.6 mas for the continuum and ∼1.3 mas for the Brα emission, the uniform-disc model ∼2.7 mas and ∼5.6 mas, and the ring model ∼1.9 mas and ∼3.8 mas, respectively. These simple fits robustly demonstrate that the hydrogen line emission is substantially more extended than the L-band continuum and motivate the use of a more elaborate parametric description. We therefore, in the following section, apply PMOIRED to simultaneously model the continuum and Brα emission to better constrain their geometry and flux contributions, also taking into account the observed differential and closure phases.
4.2. PMOIRED
To characterise the spatial morphology of the L-band emission observed with VLTI/MATISSE, we performed parametric modelling using the dedicated tool PMOIRED4 (Mérand 2022). This software is optimised for spectro-interferometric data and enables polychromatic modelling of various astrophysical components through combinations of standard brightness distributions, such as Gaussians, uniform discs, and rings.
In PMOIRED, the total flux distribution is described by
 (5)
(5)
where (x, y) are angular sky coordinates and λ is the wavelength. The term I(x, y) denotes the wavelength-independent spatial structure (e.g. geometry and orientation), while S(λ) represents the component’s spectral dependence (e.g. flat continuum, emission line profile). This approach allows the user to independently constrain the source geometry and its spectral features, offering flexibility and physical interpretability (Monnier 2003).
PMOIRED computes interferometric observables (visibilities, closure phases, differential phases) for a given model brightness distribution and compares them to the observations using a least-squares minimisation fit. Uncertainties on the best model parameters are estimated by bootstrapping, and the covariance and correlation matrices were checked to assess potential degeneracies. This diagnostic is essential in evaluating the reliability of the model parameters, especially in cases where the data are not sufficient to independently constrain all dimensions of the model.
For this study, we focus on the L-band continuum and the Brα emission. The geometric progression fits and the resulting brightness distribution for the continuum and line emission are described below.
4.2.1. L-band continuum modelling with PMOIRED
The continuum was modelled in the L-band spectral range near the Brα line (4.067–4.080 μm) using a progressive sequence of parametric models. As a first step, the visibilities and phase observables were fitted with a simple uniform disc representing the stellar photosphere. This model already reproduced the data with a reduced χ2 of ∼0.9, consistent with the star being only marginally resolved at the available baselines. Allowing for a radial intensity profile (μ0.5 limb darkening) yielded nearly identical results, confirming the robustness of the inferred stellar diameter.
Overall, the continuum can be well described by a partially resolved continuum emission with an angular size of ∼2.42±0.03 mas (consistent with the size of 2.7 mas obtained in Sect. 4.1 when accounting for the uniform disc distribution) and a small contribution from fully resolved extended flux (∼5%). To place the L-band continuum size in context, we compare it to previous constraints on the stellar angular diameter. Adopting d = 1.2 kpc, the best-fitting uniform disc continuum diameter, θUD = 2.42 mas, corresponds to a linear diameter of D = θd ≃ 2.90 au, i.e. a radius of R ≃ 1.45 au (R ≃ 312 R⊙). This is consistent with the expected stellar diameter of ∼2.5 mas inferred from the stellar parameters presented in (corresponding to D ∼ 3 au, or ∼650 R⊙ in diameter, Koumpia et al. 2020), within the systematic uncertainties associated with simple geometric brightness distributions. A comparison with previous near-infrared interferometric measurements indicates that the continuum size of IRAS 17163 is wavelength dependent. In particular, the K-band continuum size derived from VLTI/GRAVITY in Koumpia et al. (2020) was smaller (e.g. θUD ≃ 1.73 ± 0.02 mas).
A natural question is whether the larger apparent size in the L-band could arise from a wavelength-dependent photospheric radius, i.e. because the continuum τλ ≃ 1 surface forms at slightly different depths at 2–4 μm. For a star with T ∼ 8000 K, the near-infrared opacity varies only weakly with wavelength, so the corresponding shift of the photospheric radius is expected to be at most a few atmospheric scale heights, i.e. ≲104 km even under very conservative assumptions. At a distance of 1.2 kpc this translates to ≪1 μas, which is entirely negligible compared to the milliarcsecond-scale difference observed between the K- and L-band continuum sizes. The leading cause of the chromatic size increase seems to be the growing contribution of spatially extended circumstellar emission at longer wavelengths rather than a change in the stellar radius itself. The present continuum model provides a stable baseline for the more complex line-emission modelling discussed below.
4.2.2. Brα line emission modelling with PMOIRED
To fit the line emission with PMOIRED, we adopted a parametric description of a compact stellar source surrounded by an extended Brα–emitting environment. The model included seven free parameters: the environment-to-star continuum flux ratio (fenv), the angular size assuming a Gaussian spatial distribution (FWHM) of the environment, the flux and Gaussian width of the Brα line emission, the photocentre offsets of the line-emitting region compared to the continuum along right ascension and declination, and a flux contribution from an extended, over-resolved component.
The fitting procedure was carried out progressively, starting with simple brightness distributions and gradually including additional observables and free parameters until a satisfactory solution was reached. We initially restricted the fit to visibility amplitudes only, in order to constrain the overall size of the emission region, and subsequently added the differential and closure phases, as well as the spectrally dispersed flux, to account for asymmetries and spectral-line behaviour. We explored simple geometries, such as uniform disc and Gaussian brightness distributions. These models reproduced the continuum visibilities reasonably well and provided reduced χ2 in the range 1.8–3.4, once all epochs and observables were considered.
To explore more flexibility, we tested radial profiles and Gaussian intensity distributions, which marginally improved the fits but still failed to fully capture the observed phase signals. A more refined model was then introduced that allowed the Brα line-emitting region to be offset from the continuum (free (x, y) parameters). This configuration significantly reduced the residuals ( ), and reproduced both the amplitude drops in the line and some signatures, but not fully, in the differential-phases. Finally, we examined more complex geometries, such as azimuthally varied profiles, but these resulted in a degrading of the fit solutions (
 ), confirming that such a degree of complexity is not required for these observations. This stepwise approach shows that while simple symmetric profiles can describe the continuum, the inclusion of spatial offsets in the line emission is essential to reproduce the full set of interferometric observables, paving the way for the disc-like model solution discussed below.
The best-fit solution reached a reduced χ2 = 1.03. In particular, the environment-to-star flux ratio was found to be fenv = 0.023 ± 0.009, with a size of uniform disc of 5.55 ± 0.12 mas. The Brα line was reproduced with a flux of 1.101 ± 0.021 (in continuum units) and a Gaussian width of 2.09 ± 0.03 nm, while the line-emitting region showed photocentre marginal offsets of Δx = 0.194 ± 0.071 mas and Δy = 0.089 ± 0.079 mas. Although these offsets correspond to sub-resolution spatial scales for MATISSE, they are measurable through differential phase information: spectro-astrometry enables photocentre shifts to be constrained well below the nominal angular resolution by exploiting the differential signal across the spectral line. Such shifts do not necessarily imply a bulk displacement of the line-emitting region with respect to the continuum, but can naturally arise from structural inhomogeneities or asymmetric brightness distributions within the Brα-emitting gas. The present modelling, therefore, captures the minimum level of asymmetry required by the interferometric observables, without uniquely prescribing the underlying physical origin.
An additional extended over-resolved flux contribution of fext = 0.041 ± 0.005 was also required. The Brα line centroid was measured at λ0 = 4.0523 μm, consistent with the expected rest wavelength within the instrumental resolution. The resulting parameters are summarised in Table 1, the model image in Fig. 11, and the modelled versus observed interferometric observables in Fig. 12.
 |
Fig. 11. Model image corresponding to the best-fit brightness distribution that reproduces the observed MATISSE interferometric observables around the entire line profile of the Brα emission. The image was generated using PMOIRED, adopting the same geometry and parameters that yield the visibility, closure phase, and differential phase fits shown in Fig. 12. The intensity is normalised and displayed in logarithmic scale to highlight both the compact continuum and more extended Brα-emitting structures. |
 |
Fig. 12. Comparison between observed MATISSE interferometric observables (black) and best-fit model (red) predictions across all baseline configurations. From left to right, the panels show flux spectra, closure phases, differential phases, and visibilities. Each baseline is colour-coded to fit the uv-plane shown in Fig. 4. |
Best-fit parameters of MATISSE derived with PMOIRED.
The PMOIRED modelling confirms and refines the results obtained from the uniform disc fit, with a Brα–emitting region of ∼5.6 mas, in excellent agreement with the ∼5.6 mas size derived from the simple model while accounting for a uniform disc brightness distribution. This consistency shows that the hydrogen line emission is systematically more extended than the continuum, while the parametric approach additionally constrains the flux ratio and reveals the presence of an over-resolved component not captured by the uniform disc approximation.
The channel maps sampled at N equally spaced velocities that span the maximum symmetric velocity interval permitted by the Brα wavelength window (4.050–4.055 μm) are shown in Fig. B.2. The Brα channel maps reveal a pronounced asymmetry in the velocity space, with significantly stronger emission on the blueshifted side of the line. The emission remains detectable up to vLSR ∼ −120 km s−1, whereas the redshifted counterpart is strongly suppressed at comparable offsets from the systemic velocity. At all velocities where Brα emission is detected, the morphology remains compact and centrally peaked, arguing against ordered rotation or collimated ejection and instead favouring a radially expanding flow. The observed blue–red asymmetry is naturally explained if emission from the receding hemisphere is partially attenuated by line optical depth and/or continuum opacity within the dense inner wind. Taking the maximum detected blueshift as a lower limit implies projected outflow velocities of at least ∼140 km s−1 for the ionised gas, adopting a systemic velocity of vsys = +18 km s−1, as previously reported from optical Fe II in Wallström et al. (2017).
5. Discussion
5.1. Distance considerations on the Fried Egg Nebula
The distance from the source has traditionally been a source of debate (e.g. Lagadec et al. 2011; Wallström et al. 2015). Here, we discuss our choice of adopting a distance of 1.2 kpc (DR2; Koumpia et al. 2020). This distance is also supported by a more recent independent distance constraint as provided by the systemic radial velocity of IRAS 17163 (vrad ≃ +18 km s−1), measured consistently in optical Fe II emission and CO lines (Wallström et al. 2017). Comparison with reconstructed 3D Galactic velocity fields based on the HI4PI survey (Söding et al. 2025) yields a kinematic distance consistent with ∼1.2 kpc (Kasikov et al. 2026).
Oudmaijer et al. (2022) used Gaia DR3 measurements and reported a distance of ∼5.2 kpc from the source. While the RUWE parameter does not flag IRAS 17163 as problematic, this does not guarantee reliable parallaxes for extended, dusty sources such as IRAS 17163 due to centroid errors and photocentre shifts. We argue that using the DR3-based distance would introduce substantial inconsistencies in the known physics related to massive stellar evolution.
A strong argument against 5.2 kpc is the luminosity of the source. At a distance of 1.2 kpc, Koumpia et al. (2020) derive a luminosity of L = 5 × 10⁵ L⊙, typical for a YHG. However, if the star were placed at 5.2 kpc, its luminosity would increase by a factor of (5.2/1.2)2 ≈ 18.8, resulting in L ≈ 9.4 × 10⁶ L⊙. This would make IRAS 17163 one of the most luminous stars in the Milky Way, comparable to the peak luminosity of η Carinae during its Great Eruption (1 − 5 × 10⁷ L⊙). Such a luminosity would, in fact, place the star above the empirical Davidson limit (L ∼ (5–6)×105 L⊙), while exceeding the luminosities of known luminous blue variables (LBVs), Wolf-Rayet (WR) stars, and even many supergiants near the Eddington limit.
For a star to remain stable against radiative acceleration at such extreme luminosity, it must not exceed its Eddington limit

Imposing L ≤ LEdd for 9.4 × 10⁶ L⊙ yields M ≳ 294 M⊙, far above the mass of any known Galactic star. Even if IRAS 17163 were temporarily in a super-Eddington state (as η Car has been proposed to be), such high luminosity would demand an extremely massive progenitor, likely exceeding 150 M⊙ (assuming a super-Eddington factor, Γ5, of about 2), formed in a dense, young stellar cluster, yet no such environment is evident in its vicinity.
Moving on with the argumentation, the 2D radiative transfer modelling in Koumpia et al. (2020) yields mass-loss rates of Ṁ ≈ 6 × 10⁻⁷ M⊙ yr−1 (inner shell), 9 × 10⁻⁴ M⊙ yr−1 (intermediate shell), and 5 × 10⁻⁵ M⊙ yr−1 (outer shell), assuming optically thin dust emission. These inferred mass-loss rates at 1.2 kpc are moderate and consistent with values observed in YHGs and evolved post-RSG stars6.
However, rescaling them to 5.2 kpc results in unrealistically high values, particularly for the intermediate shell, which would reach Ṁ ≈ 1.7 × 10⁻² M⊙ yr−1, comparable to the eruptive LBV phases. These values are listed in Table 2. Additionally, such an amount of mass would obscure the star even more. Since the extinction is mainly interstellar rather than originating from the star itself (Koumpia et al. 2020), this scenario seems even more unlikely.
Shell properties at 1.2 kpc and rescaled to 5.2 kpc.
The measured angular extent of the Brα emission provides an additional distance-dependent constraint on the ionised wind scale. For a characteristic size of θ ≃ 5.6 mas, the corresponding physical radius is r ≃ θd ≈ 6.7 au at d = 1.2 kpc, but r ≈ 29.1 au at d = 5.2 kpc. In a steady, approximately spherical wind with ρ ∝ r−2 and constant outflow speed v, the electron density scales as ne(r) ∝ Ṁ/(vr2) and the hydrogen recombination emissivity as jBrα ∝ Ṁ2/(v2r4). While a detailed inference of Ṁ from the Brα size would require dedicated radiative-transfer modelling, the tens of au scale implied at d ≳ 5 kpc would push the required ionised wind parameters towards a significantly more extreme regime, reinforcing the tension with the larger distance.
In conclusion, the 1.2 kpc distance places IRAS 17163 in the upper luminosity range of YHGs and evolved massive stars (see, e.g. IRC+10420, ρ Cas, HR 8752), consistent with its variability, moderate spectroscopic wind signatures, and circumstellar shell properties. It avoids invoking a physically implausible progenitor mass and prevents violating the Eddington limit, while remaining consistent with the observed optical and infrared spectral energy distribution (SED) and mass-loss properties.
5.2. Comparison of M-band spectral features in IRAS 17163 and IRC+10420
Acquisition of the M-band spectrum of IRAS 17163, utilising high-resolution CRIRES+ spectroscopy, allows a direct and detailed comparison with the well-studied post-RSG YHG, IRC+10420. This comparative analysis reveals fundamental differences in the kinematic, excitation, and density properties of their innermost circumstellar environments, tracing potential evolutionary divergence between the two objects.
5.2.1. Contrasting hydrogen recombination and metal lines
Hydrogen recombination lines, specifically Brα, Pfβ, Pfγ, and various Humphreys series transitions, are clearly detected in both stars but show significant variations in strength and profile. In IRAS 17163, these lines exhibit strong emission with broad wings and asymmetric profiles. Notably, Pf β and Pf γ exhibit broad wings and P Cygni profiles, indicative of an expanding and sufficiently dense inner wind. Such profiles require significant optical depth in the line-forming region and, therefore, trace energetic, high-density outflows rather than merely the presence of expansion. These lines are also present in IRC+10420. The Br α line shows strong emission in both stars, with a redshifted peak in IRC+10420 consistent with its higher systemic velocity relative to IRAS 17163. Several Humphreys transitions (Hu δ, Hu ϵ, Hu θ), and higher excitation lines (e.g. H 20–7), are present in IRAS 17163. These lines are absent or significantly weaker in IRC+10420.
A further distinction lies in the atomic features. IRAS 17163 displays prominent neutral and low-ionisation metal lines in emission or absorption, including Fe I, Fe II, Mg I, and C I. These transitions are permitted lines rather than forbidden ones, indicating formation in a relatively dense inner region where collisional de-excitation suppresses forbidden emission. This differs from the situation in B[e]-type objects, where strong forbidden metal lines trace lower-density extended outflows; the spectrum of IRAS 17163 instead points to a dense inner wind rather than a shock-excited or diffuse circumstellar gas. Conversely, these metal lines are largely absent or significantly weaker in IRC+10420, a signature that hints at a more evacuated inner envelope. This behaviour is fully consistent with the optical comparison presented by Wallström et al. (2015), who directly overplotted the optical spectra of the two objects and found IRAS 17163 to be considerably richer in Fe II, Cr II, and Ca II features than IRC+10420 (their Fig. B.1).
5.2.2. Molecular features and wind kinematics
The first overtone transitions CO (v = 1 → 0), particularly in the R- and P-branches, highlight a stark contrast in the molecular content and kinematics of the two objects (Figs. 1 and A.1). IRC+10420 exhibits clear P Cygni profiles across multiple CO transitions, characterised by well-defined blueshifted absorption. This profile is consistent with classical P Cygni line shapes and demonstrates the presence of an outflowing molecular envelope. The detection of CO in IRC+10420 is indicative of molecular gas at moderate temperatures and may trace a cooler, more extended layer produced during a previous episode of enhanced mass loss. In this interpretation, hydrogen recombination lines would arise predominantly in the denser inner wind, whereas the CO absorption probes material located further out along the line of sight, allowing the molecular transitions to display pronounced P Cygni profiles even if the inner ionised gas does not. The P Cygni morphology of CO lines in IRC+10420 also enables an estimate of the molecular outflow speed (e.g. from the maximum blueshift of the absorption trough relative to the systemic velocity). A dedicated analysis of the CO velocity structure and excitation of IRC+10420, including radiative-transfer modelling across multiple transitions, is deferred to future work.
In contrast, IRAS 17163 shows little to no absorption in the CO rovibrational lines. The absence of these hot CO features suggests that the molecules are either dissociated in the immediate inner environment or that the molecular gas has been displaced to larger radii. Indeed, millimetre observations detect CO in rotational transitions (e.g. J = 2–1 and J = 3–2) arising from circumstellar material on scales of ≲20″, with broad and asymmetric profiles indicative of a structured outflow (Wallström et al. 2015, 2017). This demonstrates that molecular gas is present, but predominantly in a cooler, more extended component that is not traced by the near-infrared rovibrational lines. As context, IRC+10420 is also known to host an extended molecular envelope traced by CO rotational emission at millimetre wavelengths (e.g. Castro-Carrizo et al. 2007; Quintana-Lacaci et al. 2016); the contrast discussed here, therefore, refers specifically to the hot inner regions probed by the M-band rovibrational lines.
The detection of several CO rovibrational transitions toward IRC+10420 naturally raises the question of whether an excitation analysis could be used to constrain the physical conditions of the molecular gas. In principle, rotational diagrams constructed from the relative strengths of individual CO lines can provide estimates of excitation temperatures and column densities. However, the CO lines detected toward IRC+10420 show complex profiles, including absorption and P Cygni-like signatures, indicating that the gas is part of a dynamic, expanding circumstellar environment rather than a static slab. Under these conditions, line strengths are affected by optical depth effects, velocity gradients, and radiative transfer through the wind, making a simple rotational-diagram analysis highly model-dependent. Similarly, the absence of statistically significant CO detections toward IRAS 17163 precludes a meaningful excitation analysis for that source. For these reasons, we do not attempt to derive excitation temperatures from the CO rovibrational ladder in this work. A dedicated excitation and radiative-transfer analysis, incorporating wind geometry and optical depth effects, is deferred to a future study focused specifically on the molecular component of post-RSG mass loss.
5.2.3. Implications for evolutionary status
The observed spectral differences act as a crucial diagnostic tool for probing evolutionary divergence among the two post-RSG YHGs. In summary, IRAS 17163 shows strong hydrogen and metal emission and the absence of clear molecular outflow signatures. The kinematics indicated by the strong metal lines suggest slower, more quiescent ejecta, consistent with the interpretation that IRAS 17163 likely underwent episodic, fragmented mass-loss events. Conversely, IRC+10420 shows prominent molecular absorption, weaker metal lines, and emission-dominated, yet weaker hydrogen profiles.
This comparison reveals clear differences in the kinematic and excitation properties of the two YHGs, but also highlights that their interpretation is not straightforward. In particular, the emission components of the hydrogen recombination lines are systematically narrower in IRAS 17163 than in IRC+10420. For Brα, IRAS 17163 exhibits a FWHM of ∼45 km s−1, compared to ∼70 km s−1 in IRC+10420 (Table A.1). Such differences in line width alone can have a strong impact on line opacity: broader velocity fields reduce the optical depth per velocity channel and can flatten line profiles even for comparable column densities. As a result, differences in the equivalent width or peak intensity cannot be interpreted uniquely in terms of the gas temperature or spatial extent.
In addition, the observed line strengths depend on the gas filling factor relative to the stellar and dust continuum. If the emitting material is distributed in a clumpy or fragmented medium rather than in a smooth wind, optically thick clumps that cover only a fraction of the projected area can still produce strong emission while significantly altering the effective opacity. These effects are expected in both pulsation and wind-driven outflows and introduce further degeneracies between kinematics, density, and geometry. Consequently, while the stronger metal emission and prominent hydrogen lines in IRAS 17163 are consistent with a denser and more ionised inner wind, and the molecular absorption in IRC+10420 points to a cooler, more extended molecular component, the contrasting spectral properties likely reflect a combination of velocity structure, optical-depth effects, and gas filling factors, in addition to intrinsic differences in temperature or size.
The contrasting presence of CO absorption in IRC+10420 and its absence in IRAS 17163 further suggests that molecular survival is governed not only by temperature but also by local shielding and geometry. The persistence of CO features in IRC+10420 over several decades indicates that the molecular gas may reside at relatively small radii in dense dust-shielded regions, potentially associated with a flattened or torus-like structure that is still participating in an outflow. In contrast, the strongly ionised inner wind of IRAS 17163 appears hostile to molecule formation or survival despite evidence for recent mass loss.
In the context of line-driven winds, relatively small differences in effective temperature are expected to play a first-order role, as they can induce significant opacity changes through ionisation balance shifts, particularly near the second bi-stability jump. Both sources are characterised by effective temperatures close to the temperature known to trigger this instability (8800 K). The overall contrast in line profiles and species, therefore, hints at differences in wind properties that are likely rooted in modest shifts in effective temperature and associated opacity changes, with variations in geometry and time-variable ejection behaviour emerging as secondary consequences. This diversity highlights the sensitivity of the mass-loss process in post-RSG YHGs to subtle differences in stellar parameters, when stars evolve close to the Eddington limit. Small changes in opacity can lead to markedly different wind properties.
The observed spectroscopic differences suggest that YHGs may follow diverse evolutionary pathways, influenced by initial mass, binarity, or instabilities, rather than evolving along a uniform sequence. Our results, therefore, emphasise the importance of comparative studies across multiple post-RSGs to capture the full range of mass-loss behaviours at this transitional stage.
5.3. From ionised winds to dusty shells: Mass loss across multiple spatial scales
The combination of high-resolution spectroscopy, long-baseline interferometry, recently published mid-infrared imaging, and optical spectropolarimetry provides a unique, multi-scale view of the circumstellar environment of IRAS 17163. Together, these results demonstrate that the mass-loss process in this post-RSG star is neither smooth nor steady, but instead episodic, structured, and time-variable.
5.3.1. The innermost wind region
The CRIRES+ spectra reveal strong and broad hydrogen recombination lines with asymmetric and P-Cygni–like profiles, consistent with the presence of a dense, accelerating outflow. The absence of significant CO absorption, in contrast to IRC+10420, indicates a hotter or more ionised inner environment where molecules are destroyed or absent. The emission in metallic lines such as Fe I, Fe II, and C I further supports the presence of dense, excited gas close to the star.
These spectroscopic diagnostics are directly complemented by MATISSE interferometry, which spatially resolves the Brα line-emitting region. The Brα emission is found to be approximately twice as extended as the L-band continuum, demonstrating that the ionised wind is a distinct component of the compact continuum environment, which is more likely a result of photospheric emission and warm dust emission. Line variability on monthly timescales implies a time-variable mass-loss rate. Together, CRIRES+ and MATISSE show that the current wind of IRAS 17163 is unstable, shaping the innermost circumstellar environment on au scales.
The Brα channel maps do not show strong velocity-dependent asymmetries that would point to a strongly flattened or rotating structure. This behaviour contrasts with IRC+10420, where interferometric observations at similar spatial scales reveal a clearly asymmetric structure interpreted as an hour-glass or bipolar wind seen close to pole-on (Koumpia et al. 2022). At the spatial scales probed here, the inner wind of IRAS 17163 does not clearly show, but neither does it exclude equatorial structures or bipolar outflows seen near pole-on.
Additional constraints on the geometry of the innermost wind are provided by the FORS2 spectropolarimetric observations. Line polarisation effects are detected across Hα and are tentatively present across the Ca II lines, indicating departures from spherical symmetry on spatial scales well below the direct imaging resolution. Spectropolarimetric signatures are commonly associated with asymmetric structures close to the star, including flattened winds, disc-like geometries, or localised density enhancements. They may also arise from preferentially directed ejections or compact clumps propagating within the inner wind, as proposed for LBVs (Davies et al. 2005). In this context, the spectropolarimetric results provide an independent line of evidence that the innermost wind of IRAS 17163 is not strictly spherically symmetric, complementing the picture inferred from interferometry and spectroscopy. Although these signatures suggest departures from strict spherical symmetry, the detected line polarisation effects are modest. This may indicate that the inner wind of IRAS 17163 was in a relatively quiescent phase during the epoch of our observations, despite the episodic mass-loss history inferred at larger spatial scales.
5.3.2. Large-scale asymmetry from spectropolarimetry
The discrepancy between the 1988 polarisation measurements and the stable values seen in 2015 and 2023 may hint at a transient intrinsic contribution. If dust scattering requires material sufficiently close to the star, the intrinsic polarisation detected in 1988 could plausibly be associated with enhanced circumstellar dust during a recent mass-loss episode. In this scenario, the fading of the intrinsic component would be consistent with the dust expanding to larger radii, leaving behind only the interstellar contribution.
Recent mid-infrared imaging of IRAS 17163 by de Wit et al. (in prep.) provides an independent and highly complementary view of the large-scale circumstellar geometry inferred from our spectropolarimetry. Their VISIR data reveal that the Fried Egg Nebula is expanding at a measurable angular rate, with shell-specific dynamical ages ranging from ∼70 to ∼400 yr (at 1.2 kpc) for the inner mid-IR rings and up to several thousand years for the outer structures. Importantly, although the shells appear circular in projection, the high-quality PAH1 images show localised brightness enhancements and Kelvin–Helmholtz-type ripples along the inner rims, indicating that the mass loss is not perfectly isotropic. This morphology is consistent with the possibility, supported by historical polarimetric variability, that IRAS 17163 has exhibited intrinsic asymmetry during past mass-loss episodes, even though the current continuum polarisation is dominated by the interstellar component.
This interpretation is also consistent with the large-scale asymmetries detected at millimetre wavelengths with ACA (Wallström et al. 2017), where the CO(2–1) emission revealed a redshifted ‘spur’ extending from the star toward the south-east (PA ≃ 112°), suggestive of a unidirectional ejection event. Together, the mid-IR shell inhomogeneities and the ACA spur indicate that departures from spherical symmetry occur on multiple spatial scales in the circumstellar environment of IRAS 17163.
The VISIR results strengthen the idea that IRAS 17163 undergoes episodic, directionally modulated mass loss, rather than smooth spherical outflows. The fact that the spectropolarimetric angle remains stable across recombination lines, while the mid-IR images show shell-specific asymmetries, suggests that the preferred axis of mass ejection is long lived, potentially linked to a persistent large-scale structure in the atmosphere or wind-launching region. The apparent geometric symmetry of the present-day wind therefore does not contradict the asymmetric large-scale shell structure, which reflects older episodic mass-loss events preserved at larger radii.
5.3.3. Connecting small and large scales
By combining these diagnostics, we obtain a coherent multi-scale view of the circumstellar environment of IRAS 17163. The dense, largely symmetric yet time-variable ionised wind revealed by CRIRES+ and MATISSE provides the immediate mass reservoir that ultimately forms the dusty shells now resolved in the mid-infrared. The most recent VISIR imaging demonstrates that these shells expand at a measurable rate and possess dynamical ages of only a few hundred years for the inner structures. This indicates that the present-day wind, although geometrically compact, is fully capable of feeding the larger-scale dusty nebula on short evolutionary timescales.
Despite their near-circular appearance in projection, the VISIR images show localised brightness enhancements and ripple-like substructures along the inner rims of the shells, pointing to inherently inhomogeneous mass ejection. Although our FORS2 observations show that the continuum polarisation is dominated by interstellar dust, they do reveal a line effect across Hα, indicating departures from spherical symmetry in the innermost wind. This small-scale asymmetry does not contradict the larger-scale structures inferred at mid-infrared wavelengths; rather, it suggests that the continuum-forming region is close to spherical on average, with localised or transient deviations that are insufficient to produce a strong intrinsic continuum polarisation.
The model-independent confirmation of a very compact inner emitting region (Sect. B.2) complements previous imaging results (Koumpia et al. 2020; Lagadec et al. 2011), which reveal multiple extended shells tracing episodic mass loss over timescales ranging from decades to several millennia. Together, these findings show that the present-day mass loss probed by MATISSE arises from a dense inner wind embedded within a much more extended and multi-episodic circumstellar environment.
At this point, it is important to distinguish between temporal variability and geometric asymmetry, which are, in principle, independent properties of mass loss. A wind may vary in strength over time while remaining largely symmetric, just as a geometrically asymmetric outflow does not necessarily imply strongly time-variable or episodic behaviour. In the case of IRAS 17163, the present data indicate a compact, relatively symmetric ionised wind that exhibits variability in strength, alongside a larger-scale dusty environment that records discrete mass-loss episodes and localised asymmetries. The observed shell structure therefore reflects the time-integrated imprint of mass-loss variability, rather than requiring the instantaneous wind to be strongly asymmetric.
Several physical mechanisms have been proposed to account for such episodic mass loss in YHGs. In particular, both pulsation-driven instabilities and opacity-driven variations associated with the second bi-stability jump have been discussed in detail for IRAS 17163 in Koumpia et al. (2020). Pulsation models predict cycles of atmospheric inflation, shocks, and partial envelope ejection as stars approach the cool edge of the yellow-void instability region (e.g. Glatzel & Kraus 2024), while bi-stability effects in line-driven winds can lead to abrupt changes in wind density and velocity as the star evolves through a narrow range of effective temperatures (e.g. Vink et al. 1999; Petrov et al. 2016).
Either mechanism is capable, in principle, of producing recurrent mass-loss episodes and concentric shell structures. In pulsation-driven scenarios, such episodes can lead to discrete ejection events associated with atmospheric inflation and shock propagation, while both pulsation- and wind-driven outflows may develop stochastic density enhancements or modest latitude-dependent variations. In the case of line-driven winds, intrinsic clumping and, if the star is rotating, latitudinal variations in effective temperature and radiative acceleration can likewise imprint asymmetries on the ejecta. These effects may become observationally apparent only once the material expands and cools, forming fragmented and locally enhanced structures seen at larger radii.
The new observational constraints presented here provide additional leverage on this picture. The combination of a compact, time-variable ionised wind traced by Brα, moderate present-day wind velocities, and largely optically thin dusty shells point towards relatively mild, recurrent enhancements in mass loss operating over months to more eruptive events over timescales of decades to centuries. In this context, perhaps a combined mechanism of pulsation-driven instabilities, potentially modulated by changes in wind opacity near the second bi-stability jump, offers a natural explanation for the observed shell sequence and its asymmetric substructure. Taken together, the interferometric, spectroscopic, polarimetric, and mid-infrared diagnostics indicate that IRAS 17163 undergoes mass loss that is neither steady nor strictly spherically symmetric, but governed by instabilities operating as the star evolves through the dynamically unstable region bordering the yellow void.
5.3.4. In search of a companion
The centroid of the Brα line remains stable over all available epochs, spanning more than 300 days (Fig. 5). Although the line profile and peak intensity vary significantly, no systematic shift of the line centroid is detected. From the scatter of the peak positions we derive a conservative upper limit of Δv ≲ 10 km s−1 (Table B.2), corresponding to a radial-velocity semi-amplitude K1 ≲ 5 km s−1.
Any orbital reflex motion of the primary would induce a radial-velocity semi-amplitude
 (6)
(6)
where M1 and M2 are the masses of the primary and companion, P is the orbital period, i the inclination, and e the eccentricity. The orbital period corresponding to a given separation is obtained from Kepler’s third law,
 (7)
(7)
For M2 ≪ M1 and M1 = 30 M⊙, this yields P ≃ 0.18 (a/au)3/2 yr, so that separations of 1, 3, and 10 au correspond to orbital periods of approximately 0.2, 1, and 5 yr, respectively.
Interpreting the observed limit K1 ≲ 5 km s−1 as an upper bound on orbital motion and adopting circular orbits and sin i = 1, we constrain the mass of a putative companion as a function of separation. Under these assumptions, companions more massive than ∼1 M⊙ are excluded from separations ≲1–2 au (orbital periods ≲ a few months), while companions more massive than ∼2–3 M⊙ are excluded from separations of ∼10 au (orbital periods of several years). For comparison, a 5 M⊙ companion would induce a radial-velocity semi-amplitude of K1 ≃ 20 km s−1 at ∼1 au (P ∼ 100 d) and K1 ≃ 14 km s−1 at ∼3 au (P ∼ 1 yr), well above our detection threshold. We note that Brα is formed in the ionised wind rather than in the stellar photosphere. As a result, any orbital motion of the star would be further diluted by wind dynamics, making the above limits conservative.
Complementary constraints on binarity are provided by the VLTI/MATISSE interferometric observations. We performed a systematic search for faint companions using the detection–limit formalism implemented in PMOIRED, which injects a secondary point source at random positions in the sky plane and determines the minimum detectable flux ratio at a given significance level based on the interferometric observables (visibility amplitudes and closure phases). The search was restricted to angular separations between ≃3.2 mas, corresponding to half the interferometric resolution (0.5 λ/B at 4 μm, suggested by the documentation, and a maximum baseline of 130 m), and 450 mas, set by the diffraction limit of the ATs (the effective field of view and sensitivity of the MATISSE observations are actually smaller by a factor of about 2).
No statistically significant companion was detected at the 3σ level within this separation range. The resulting detection limits exclude companions brighter than Δm ≃ 3.3 mag in the L band, corresponding to a flux ratio of f2/f1 = 10−0.4 Δm, where Δm = m2 − m1 is the magnitude difference between the companion and the primary in the relevant band. For our 3σ detection limit of Δm ≃ 3.3 mag, this corresponds to f2/f1 ≃ 5%. We note that converting an L-band flux ratio constraint into a limit on companion mass or spectral type is non-trivial for evolved massive stars: the primary may exhibit strong infrared excess from hot dust and/or a free-free emitting ionised wind, so the measured contrast refers to the total interferometric continuum rather than the stellar photosphere alone. Any inference on companion mass, therefore, depends on assumptions about the circumstellar contribution, extinction, and the companion’s intrinsic spectral energy distribution.
The detection limit quoted corresponds to the median of the distribution of 3σ detection thresholds obtained from the random companion injections. The associated confidence intervals indicate that 68% (90%) of the trials yield limits between Δm ≃ 3.18–3.41 mag (3.09–3.48 mag), with the full 99% range spanning Δm ≃ 2.97–3.54 mag. An independent grid-based binary model fit converged to a formal χ2 of 0.9 minimum that corresponds to a faint companion with a flux ratio of f2/f1 ≃ 0.015 at a projected separation of ∼33 mas. This flux ratio corresponds to a magnitude difference of Δm ≃ 4.6 mag, which lies well below the previously determined 3σ detection limit of Δm ≃ 3.3 mag (i.e. f2/f1 ≃ 0.05). As a result, such a signal cannot be robustly distinguished from statistical fluctuations in the interferometric observables, and therefore we do not consider this solution as a real detection.
The interferometric limits probe projected separations of several to a few hundred astronomical units (∼4–500 au) at the distance of the source (1.2 kpc) and are therefore complementary to the radial velocity constraints derived from the Brα spectroscopy, which are primarily sensitive to even closer companions on sub-au to few-au orbits. Taken together, the absence of detectable radial velocity shifts and the lack of interferometric evidence for a companion over a wide range of separations seem to disfavour binarity as the origin of the observed variability. Instead, the combined spectroscopic and interferometric constraints support a scenario in which the observed line-profile variability and spatial asymmetries arise from intrinsic, time-variable structures in the ionised wind.
6. Conclusions
6.1. Inner-wind diagnostics from M-band spectroscopy
The CRIRES+ data deliver the first M-band spectrum of IRAS 17163, offering a new probe of its innermost circumstellar environment. In direct comparison with the well-studied post-RSG IRC+10420, the spectra reveal clear differences that trace distinct physical conditions and possibly evolutionary stages, which can be summarised as follows:
-
IRC+10420 shows the absence of metal lines in the observed wavelength regimes, suggesting a hotter circumstellar environment, likely due to the clearing of outer layers as the star evolves toward a blue supergiant phase. The mass loss of IRC+10420’s is dominated by a molecular outflow, but it currently does not host a dense, compact, partially ionised inner wind that produces strong Fe I/Fe II/Mg I/C I emission.
-
In contrast, IRAS 17163 displays prominent metal transitions, including Fe I, Fe II, Mg I, and C I, consistent with a cooler, dense circumstellar envelope typical of a yellow hypergiant or late red supergiant phase.
-
IRAS 17163 appears to be in a transitional regime in which the gas is still sufficiently cool for neutral species such as Fe I, Mg I, and C I to survive, while at the same time being ionised enough to produce Fe II emission and strong H I recombination lines. The absence of CO indicates that the molecular material has either been destroyed in the inner regions or is confined to much larger radii, consistent with the detached shells seen at longer wavelengths. These diagnostics point to a dense, partially ionised, and effectively shielded inner wind.
-
IRC +10420 is dominated by a molecular outflow in which CO survives and exhibits P-Cygni profiles. The inner regions appear to contain a smaller fraction of partially ionised gas, as evidenced by the lack of strong Fe I, Fe II, Mg I, or C I emission. The circumstellar environment points to a less dense and ionised inner wind compared to IRAS 17163.
-
Hydrogen line profiles, such as Brα, Pfβ, and Hu series lines, are broader and stronger in IRAS 17163, which indicate higher density gas in a more quiescent environment compared to the weaker hydrogen lines in IRC+10420.
-
The spectroscopic divergence in the M-band between the two sources reflects differences in mass-loss behaviour and physical conditions of their circumstellar environment.
6.2. Spatial structure from L-band interferometry
The VLTI/MATISSE observations provide a spatially resolved view of the ionised environment of IRAS 17163 in the L band. Our interferometric analysis constrains both the geometry and variability of the Brα–emitting region relative to the compact continuum emission (photospheric and warm dust contributions), yielding the following conclusions:
-
The VLTI/MATISSE observations resolve the Brα–emitting region of IRAS 17163, revealing it to be significantly more extended than the continuum emission.
-
Geometric modelling with PMOIRED constrains the Brα–emitting region to a uniform-disc size of ∼5.6 mas (≈7 au at 1.2 kpc), with a small but significant contribution (∼4%) from over-resolved flux.
-
The observations reveal spectral variability in the Brα line emission. In particular, the observed profiles show broad (∼ 130 km s−1) emission with stable centroids but variable peak fluxes (up to 30% over months), indicating intrinsic variability in the ionised wind on a timescale of months.
-
No significant asymmetries or diversions from the photocentre were derived from the modelling process. Weak differential phase signals in a set of baselines may hint towards a non-centrosymmetric Brα emission, but the quality of the data does not allow a robust conclusion. The modelling could not reproduce those features. If confirmed, they could suggest a structured wind or disc-like geometry rather than a spherically symmetric outflow.
-
Velocity-resolved Brα channel maps show a blue–red asymmetry and a compact morphology at all velocities, consistent with a radially expanding ionised wind. The maximum blueshift implies projected outflow velocities of at least ∼140 km/s.
-
No spatial variability of either the continuum or the Brα–emitting region is detected within the time frame of the observations at the given spatial resolution.
-
The long-term stability of the Brα centroid over ∼300 days, combined with the absence of robust continuum photocentre shifts, strongly disfavours binarity.
-
The interferometric spatial analysis yields no evidence for a binary companion within the sensitivity and separation range probed by the MATISSE observations, excluding companions brighter than ∼5% of the primary flux over separations from a few to several hundred au.
-
The reconstructed L-band continuum resolves a compact ∼2 mas emission region, in excellent agreement with the parametric models. This inner structure likely traces the current mass-loss phase that ultimately feeds the far more extended episodic shells previously detected with VISIR, linking the sub-au wind morphology to the long-term mass-loss history of the Fried Egg Nebula.
6.3. Large-scale geometry from optical spectropolarimetry
The optical spectropolarimetric observations provide constraints on the large-scale geometry of the circumstellar environment and allow us to distinguish between interstellar and intrinsic sources of polarisation. In particular, they probe whether the present-day wind exhibits global departures from spherical symmetry and whether recent mass-loss episodes have imprinted detectable polarimetric signatures.
-
The spectropolarimetric data of IRAS 17163 are well described by a Serkowski law with λmax = 5492 ± 77 Å, Pmax = 11.33 ± 0.08%, and K = 1.81 ± 0.14.
-
The wavelength of peak polarisation, λmax = 5492 ± 77 Å, is consistent with normal Milky Way dust with the total-to-selective extinction ratio RV ∼ 3.1.
-
The relatively high maximum polarisation (Pmax ≃ 11.3%) lies below the empirical upper limit of interstellar polarisation and reddening, supporting an origin in the Galactic interstellar medium.
-
The constant wavelength-independent polarisation angle of 25.8° indicates dust aligned with a single magnetic field orientation along the line of sight.
-
The contrast between the stable interstellar polarisation measured in 2015 and 2023 and the discrepant 1988 data suggests that IRAS 17163 may have undergone a more recent mass-loss episode that temporarily produced intrinsic polarisation. This possibility reinforces our conclusion that the star’s circumstellar environment is shaped by episodic and potentially asymmetric ejections.
-
The detection of a polarisation effect of the Hα line with FORS2, consistent with earlier high-resolution measurements, provides additional evidence for small-scale asymmetries in the innermost wind of IRAS 17163, which complements the interferometric and spectroscopic diagnostics.
These results collectively emphasise that the transition from the red supergiant to hotter phases is accompanied by a highly structured and time-variable mass loss. The presence of multiple dusty shells, together with the currently variable ionised wind, implies that IRAS 17163 is losing mass in a sequence of episodic events rather than through a continuous spherically symmetric flow. The absence of observational signatures of a companion in our interferometric and spectroscopic data disfavours binarity as the origin of this behaviour, indicating that the structured and time-variable mass loss is primarily driven by intrinsic stellar instabilities. The observed diversity in spectroscopic diagnostics and wind properties among YHGs cautions against interpreting any individual object as representative of the class and highlights the need for coordinated spectroscopic and interferometric monitoring of multiple sources to map the range of instability-driven mass-loss behaviours that shape the final pre-supernova evolution of massive stars. Such behaviour may critically influence the angular momentum evolution of the star and the circumstellar conditions into which a future supernova will explode.
Acknowledgments
We thank the anonymous referee for their time and effort in evaluating this manuscript. We thank Andrea Mehner and Anni Kasikov for fruitful discussions. Based on observations collected at the European Southern Observatory under ESO programmes 109.22VF.001, 109.22VF.002, 109.22VF.003, 109.22VF.005 (MATISSE), 111.24P0.004 (FORS2), and 107.22TZ.001 (CRIRES+). This research has made use of NASA’s Astrophysics Data System (ADS).
References
- Ababakr, K. M., Oudmaijer, R. D., & Vink, J. S. 2016, MNRAS, 461, 3089 [CrossRef] [Google Scholar]
- Appenzeller, I., Fricke, K., Fürtig, W., et al. 1998, The Messenger, 94, 1 [NASA ADS] [Google Scholar]
- Bagnulo, S., Cox, N. L. J., Cikota, A., et al. 2017, A&A, 608, A146 [NASA ADS] [CrossRef] [EDP Sciences] [Google Scholar]
- Castro-Carrizo, A., Quintana-Lacaci, G., Bujarrabal, V., Neri, R., & Alcolea, J. 2007, A&A, 465, 457 [NASA ADS] [CrossRef] [EDP Sciences] [Google Scholar]
- Cikota, A., Patat, F., Cikota, S., & Faran, T. 2017, MNRAS, 464, 4146 [Google Scholar]
- Cikota, A., Patat, F., Wang, L., et al. 2019, MNRAS, 490, 578 [NASA ADS] [CrossRef] [Google Scholar]
- Cruzalèbes, P., Petrov, R. G., Robbe-Dubois, S., et al. 2019, MNRAS, 490, 3158 [Google Scholar]
- Davies, B., Oudmaijer, R. D., & Vink, J. S. 2005, A&A, 439, 1107 [NASA ADS] [CrossRef] [EDP Sciences] [Google Scholar]
- de Jager, C. 1998, A&ARv, 8, 145 [CrossRef] [Google Scholar]
- Dorn, R. J., Anglada-Escude, G., Baade, D., et al. 2014, The Messenger, 156, 7 [NASA ADS] [Google Scholar]
- Dorn, R. J., Bristow, P., Smoker, J. V., et al. 2023, A&A, 671, A24 [NASA ADS] [CrossRef] [EDP Sciences] [Google Scholar]
- Glatzel, W., & Kraus, M. 2024, MNRAS, 529, 4947 [Google Scholar]
- Gordon, M. S., & Humphreys, R. M. 2019, Galaxies, 7, 92 [NASA ADS] [CrossRef] [Google Scholar]
- Heger, A., Fryer, C. L., Woosley, S. E., Langer, N., & Hartmann, D. H. 2003, ApJ, 591, 288 [CrossRef] [Google Scholar]
- Heger, A., & Langer, N. 1998, A&A, 334, 210 [NASA ADS] [Google Scholar]
- Humphreys, R. M., Davidson, K., & Smith, N. 2002, AJ, 124, 1026 [Google Scholar]
- Humphreys, R. M., Smith, N., Davidson, K., et al. 1997, AJ, 114, 2778 [Google Scholar]
- Hutsemékers, D., Cox, N. L. J., & Vamvatira-Nakou, C. 2013, A&A, 552, L6 [NASA ADS] [CrossRef] [EDP Sciences] [Google Scholar]
- Jones, T. 2025, Galaxies, 13, 43 [Google Scholar]
- Kasikov, A., Mehner, A., Kolka, I., & Aret, A. A&A, 708, A78 [Google Scholar]
- Koumpia, E., Oudmaijer, R. D., Graham, V., et al. 2020, A&A, 635, A183 [NASA ADS] [CrossRef] [EDP Sciences] [Google Scholar]
- Koumpia, E., Oudmaijer, R. D., de Wit, W. J., et al. 2022, MNRAS, 515, 2766 [Google Scholar]
- Lagadec, E., Zijlstra, A. A., Oudmaijer, R. D., et al. 2011, A&A, 534, L10 [NASA ADS] [CrossRef] [EDP Sciences] [Google Scholar]
- Langer, N. 2012, ARA&A, 50, 107 [CrossRef] [Google Scholar]
- Lebertre, T., Epchtein, N., Gouiffes, C., Heydari-Malayeri, M., & Perrier, C. 1989, A&A, 225, 417 [NASA ADS] [Google Scholar]
- Lobel, A., de Jager, C., Nieuwenhuijzen, H., Smolinski, J., & Gesicki, K. 1994, A&A, 291, 226 [NASA ADS] [Google Scholar]
- Lopez, B., Lagarde, S., Petrov, R. G., et al. 2022, A&A, 659, A192 [NASA ADS] [CrossRef] [EDP Sciences] [Google Scholar]
- Mérand, A. 2022, SPIE Conf. Ser., 12183, 121831N [Google Scholar]
- Messinger, D. W., Whittet, D. C. B., & Roberge, W. G. 1997, ApJ, 487, 314 [NASA ADS] [CrossRef] [Google Scholar]
- Meynet, G., Chomienne, V., Ekström, S., et al. 2015, A&A, 575, A60 [NASA ADS] [CrossRef] [EDP Sciences] [Google Scholar]
- Monnier, J. D. 2003, Rep. Progr. Phys., 66, 789 [Google Scholar]
- Moriya, T. J., Maeda, K., Taddia, F., et al. 2014, MNRAS, 439, 2917 [NASA ADS] [CrossRef] [Google Scholar]
- Oudmaijer, R. D., Davies, B., de Wit, W. J., & Patel, M. 2009, ASP Conf. Ser., 412, 17 [NASA ADS] [Google Scholar]
- Oudmaijer, R. D., & Drew, J. E. 1999, MNRAS, 305, 166 [Google Scholar]
- Oudmaijer, R. D., Geballe, T. R., Waters, L. B. F. M., & Sahu, K. C. 1994, A&A, 281, L33 [NASA ADS] [Google Scholar]
- Oudmaijer, R. D., Groenewegen, M. A. T., Matthews, H. E., Blommaert, J. A. D. L., & Sahu, K. C. 1996, MNRAS, 280, 1062 [Google Scholar]
- Oudmaijer, R. D., Jones, E. R. M., & Vioque, M. 2022, MNRAS, 516, L61 [NASA ADS] [CrossRef] [Google Scholar]
- Patat, F., & Romaniello, M. 2006, PASP, 118, 146 [Google Scholar]
- Patat, F., Maund, J. R., Benetti, S., et al. 2010, A&A, 510, A108 [NASA ADS] [CrossRef] [EDP Sciences] [Google Scholar]
- Patel, M., Oudmaijer, R. D., Vink, J. S., et al. 2008, MNRAS, 385, 967 [NASA ADS] [CrossRef] [Google Scholar]
- Petrov, B., Vink, J. S., & Gräfener, G. 2016, MNRAS, 458, 1999 [NASA ADS] [CrossRef] [Google Scholar]
- Quintana-Lacaci, G., Agúndez, M., Cernicharo, J., et al. 2016, A&A, 592, A51 [NASA ADS] [CrossRef] [EDP Sciences] [Google Scholar]
- Schlafly, E. F., & Finkbeiner, D. P. 2011, ApJ, 737, 103 [Google Scholar]
- Serkowski, K., Mathewson, D. S., & Ford, V. L. 1975, ApJ, 196, 261 [NASA ADS] [CrossRef] [Google Scholar]
- Smith, N. 2014, ARA&A, 52, 487 [NASA ADS] [CrossRef] [Google Scholar]
- Söding, L., Edenhofer, G., Enßlin, T. A., et al. 2025, A&A, 693, A139 [CrossRef] [EDP Sciences] [Google Scholar]
- Thiébaut, E. 2008, Proc. SPIE, 7013, 70131I [CrossRef] [Google Scholar]
- Tomassini, G., Lagadec, E., El Mellah, I., et al. 2026, A&A, 706, A5 [NASA ADS] [CrossRef] [EDP Sciences] [Google Scholar]
- van Dokkum, P. G. 2001, PASP, 113, 1420 [Google Scholar]
- Vink, J. S., de Koter, A., & Lamers, H. J. G. L. M. 1999, A&A, 350, 181 [Google Scholar]
- Vink, J. S., de Koter, A., & Lamers, H. J. G. L. M. 2000, A&A, 362, 295 [Google Scholar]
- Vink, J. S., de Koter, A., & Lamers, H. J. G. L. M. 2001, A&A, 369, 574 [NASA ADS] [CrossRef] [EDP Sciences] [Google Scholar]
- Wallström, S. H. J., Lagadec, E., Muller, S., et al. 2017, A&A, 597, A99 [NASA ADS] [CrossRef] [EDP Sciences] [Google Scholar]
- Wallström, S. H. J., Muller, S., Lagadec, E., et al. 2015, A&A, 574, A139 [NASA ADS] [CrossRef] [EDP Sciences] [Google Scholar]
- Wang, L., Wheeler, J. C., & Höflich, P. 1997, ApJ, 476, L27 [NASA ADS] [CrossRef] [Google Scholar]
- Whittet, D. C. B., Martin, P. G., Hough, J. H., et al. 1992, ApJ, 386, 562 [NASA ADS] [CrossRef] [Google Scholar]
- Whittet, D. C. B., & van Breda, I. G. 1978, A&A, 66, 57 [NASA ADS] [Google Scholar]
- Woillez, J., Petrov, R., Abuter, R., et al. 2024, A&A, 688, A190 [NASA ADS] [CrossRef] [EDP Sciences] [Google Scholar]
PMOIRED is available at https://github.com/amerand/PMOIRED
Defined as Γ = L/LEdd > 1, where LEdd = 3.2 × 10⁴ (M/M⊙) L⊙; then the required mass is M ≳ L/(Γ ⋅ 3.2 × 10⁴ L⊙/M⊙).
For IRC+10420, CO modelling suggests two main mass-loss episodes with Ṁ ≈ 1.2 × 10⁻⁴ and 3 × 10⁻⁴ M⊙ yr−1 (durations ∼3.8 × 10³ and ∼8 × 10² yr, respectively), separated by a ∼1.2 × 10³ yr low-Ṁ interval (Castro-Carrizo et al. 2007).
Appendix A: Complete CRIRES+ spectral coverage
This appendix presents all spectral windows observed with CRIRES+ with further highlighting the ranges in which line detections were identified (Fig. A.1). For each spectral range, we show the extracted spectra of both IRAS 17163 and IRC+10420 overplotted, to facilitate direct comparison of their line profiles and relative emission strengths. The measurements of the detected lines are presented in Table A.1.
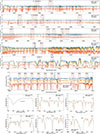 |
Fig. A.1. Full observed wavelength range of CRIRES+ for IRAS 17163 (blue) and IRC+10420 (orange), including the telluric reference (red), with line identifications (uncertain identifications marked with ; NSO/Kitt Peak FTS atmosphere data produced by NSF/NOAO). The normalised fluxes of the sources have been manually shifted by +0.6 and +0.3 units, respectively. The panels also zoom in on the well-resolved fundamental CO rovibrational transitions and cover the higher-order P-branch lines (last 2 panels), shown for completeness despite strong telluric contamination (not included in Table A.1). |
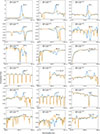 |
Fig. A.2. Detected atomic features for IRAS 17163 and IRC+10420 with CRIRES+. Uncertain identifications are marked with a *. |
Spectral measurements of CRIRES+ observations.
Appendix B: Interferometry
B.1. Supporting interferometric measurements and line-emission diagnostics
This appendix presents the interferometric observables, temporal line diagnostics, and model products that support the analysis described in the main text. For clarity and readability, the corresponding tables and figures are collected here (Fig. B.1-Fig. B.3, Table B.1, Table B.2), while their interpretation is discussed in the main text. The material includes the calibrated VLTI/MATISSE interferometric measurements, the time evolution of the Brα line properties derived from spectroscopic fitting, and the best-fit model images and interferometric observables obtained with PMOIRED.
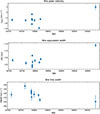 |
Fig. B.1. From top to bottom: Line-of-sight velocity with respect to the local standard of rest (VLSR), the equivalent width (EW), and the full width at half maximum (FWHM) of the Brα emission as measured with MATISSE (Table B.2). |
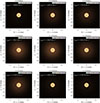 |
Fig. B.2. Channel maps from the fitting process of the MATISSE data using PMOIRED across the wavelength interval of 4.050–4.056 μm (Brα emission). Each panel corresponds to a single sampled wavelength slice; the associated Doppler velocity with respect to the local standard of rest, vLSR, is indicated in the upper-left corner of each frame (computed relative to the Brα rest wavelength λ0 = 4.0523 μm). The systemic velocity of 18 km/sec is based on Fe II lines in the optical (Wallström et al. 2017). |
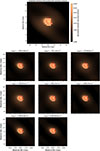 |
Fig. B.3. Brα image reconstructions of IRAS 17163 using WISARD. (Top) Integrated intensity around the Brα emission obtained by summing all velocity channels. (Grid) Velocity-channel reconstructed maps across the Brα line profile (constant velocity step of Δv km s−1), progressing from blue-shifted (top left) to red-shifted (bottom right) emission. In both panels, the reconstructed L-band continuum emission is overplotted as red contours to highlight the spatial extent of the ionised emission relative to the continuum. |
Interferometric baseline information and measured visibilities in the continuum and Brα line.
B.2. Image reconstruction
To complement the geometric modelling and obtain a model-independent view of the spatial distribution of the 4 μm emission, we performed image reconstruction of the VLTI/MATISSE data using the OImaging package developed by the Jean-Marie Mariotti Centre (JMMC7). The software provides access to several reconstruction algorithms (MiRA (Thiébaut 2008), BSMEM, SQUEEZE, WISARD) and regularisation schemes tailored to optical interferometric data.
We started with the reconstruction of selected continuum channels where the emission is stable and unaffected by line variability. The general approach adopted by the imaging algorithms is to minimise a global cost function, χ2 = χdata2 + μ ⋅ R(I), where χdata2 quantifies the fit to the interferometric observables, R(I) encodes the chosen regularisation (e.g. smoothness or compactness), and μ controls the balance between data fidelity and prior information. We tested several regularisation schemes, including quadratic smoothness and total variation, and explored a range of hyperparameters to ensure that the resulting images were stable while limiting reconstruction artefacts. The algorithm converged, resulting in a reduced χ2 of approximately 4.
The continuum reconstruction (Fig. B.3) reveals a compact morphology with a characteristic radius of ∼2 mas, consistent with the continuum size inferred from the geometric modelling (Sect. 4.1). An integrated Brα image (Fig. B.3) was obtained by summing the reconstructed intensity across all velocity channels spanning the line. While this integrated map does not correspond to a strictly self-consistent interferometric reconstruction, it provides a convenient visual summary of the overall spatial extent of the Brα emission relative to the continuum. Figure B.3 presents velocity-resolved image reconstructions across the Brα line at eight representative radial velocities spanning the full extent of the observed line profile. The selected velocity slices range from vLSR ≃ −170 km s−1 to +200 km s−1 and are symmetrically distributed around the systemic velocity (vsys = 18 km s−1), ensuring that both the blue- and red-shifted wings as well as the line core are sampled. The chosen velocities are not intended to provide a uniformly spaced spectral cube, but rather to trace the gross kinematic structure of the Brα emission at characteristic points across the line profile.
Each channel map was reconstructed independently using the WISARD algorithm, adopting the same field of view and regularisation scheme as for the continuum reconstruction. For visualisation purposes, the images are displayed using a per-channel intensity stretch, adjusted to the local dynamic range of each slice in order to enhance low-level emission. The continuum morphology, reconstructed from line-free spectral channels, is overplotted as contours to provide a spatial reference for the compact dust-emitting region with respect to the line-emitting region. Given the intrinsic variability of the Brα line between epochs, the limited (u, v) coverage and SNR available per spectral channel, and the strong chromatic structure of the line, the velocity-channel reconstructions should be interpreted qualitatively. They are primarily intended to highlight systematic changes in the spatial distribution of the ionised gas across the line profile, rather than to provide a quantitative tomographic view of the velocity field.
Gaussian fit parameters for the Brα line as observed with MATISSE.
All Tables
Interferometric baseline information and measured visibilities in the continuum and Brα line.
All Figures
|
Fig. 1. CRIRES+ spectra comparison of IRAS 17163 (blue) and IRC+10420 (yellow), showing the Pfundβ line and CO R-branch transitions. The fluxes are normalised, and a telluric correction has been applied. |
| In the text | |
|
Fig. 2. Normalised and telluric corrected CRIRES+ spectra of IRAS 17163 (blue) and IRC+10420 (yellow) around the Brackett α line at ∼4.052 μm. The emission is significantly stronger in IRAS 17163 compared to IRC+10420, indicating a higher density of ionised gas in the inner wind region. |
| In the text | |
|
Fig. 3. Comparison of the Pfund γ line profiles in IRAS 17163 and IRC+10420 before (top) and after (bottom) telluric correction. The uncorrected profile shows residual atmospheric features affecting both the continuum and line wings, while the corrected version provides a cleaner view of the intrinsic emission and absorption structure. |
| In the text | |
|
Fig. 4. uv-plane of the MATISSE observations. Each point corresponds to a projected baseline at a given wavelength. The plot includes all configurations used, illustrating the sampling of the (u, v) plane across different hour angles and baseline lengths. This coverage enables detailed image reconstruction and model fitting. |
| In the text | |
|
Fig. 5. Brα line profiles observed with MATISSE, corrected for heliocentric velocity shifts, and overplotted for all available epochs. This comparison highlights the temporal variability in the line emission, revealing changes in both the line shape and intensity. The profiles have been normalised to the continuum and aligned in velocity space to facilitate direct comparison. |
| In the text | |
|
Fig. 6. Combined FORS2 spectropolarimetric observations of IRAS 17163 obtained on 4 and 8 July 2023. The blue line in the top panel shows the Serkowski fit to the polarisation spectrum, while the red line represents the flux spectrum for comparison. |
| In the text | |
|
Fig. 7. Combined FORS2 spectropolarimetric observations of the Hα line in IRAS 17163 obtained on 4 and 8 July 4 2023. The data are unbinned and continuum-subtracted. The polarisation spectrum (top panel) has been corrected for polarisation bias. The red line in the top panel represents the flux spectrum. The light blue shading indicates the wavelength range 6550–6576 Å used for plotting the Hα line in the Q–U plane (bottom panel). |
| In the text | |
|
Fig. 8. Combined FORS2 spectropolarimetric observations of the Ca II triplet lines in IRAS 17163 obtained on 4 and 8 July 2023. The data is unbinned and continuum-subtracted. The polarisation spectrum (top panel) has been corrected due to polarisation bias. The red line in the top panel represents the flux spectrum. The light blue shading indicates the wavelength ranges used for plotting the Ca II line in the Q–U plane (Fig 9). |
| In the text | |
|
Fig. 9. Q–U diagrams for the Ca II infrared triplet lines in IRAS 17163, obtained on 4 and 8 July 2023. The data are unbinned and continuum-subtracted. The left, centre, and right panels correspond to the Ca II 8498.018 Å, 8542.089 Å, and 8662.140 Å lines, respectively. |
| In the text | |
|
Fig. 10. Visibility amplitudes as a function of baseline length, shown for the continuum (averaged for 4.04-4.05 μm and 4.054-4.06 μm; blue), and at the peak of the Brα line emission at 4.052 μm (red). The observed visibilities are fit to three different brightness distributions: a Gaussian (top), a uniform disc (middle), and a ring (bottom). By fitting these models to the observed visibilities, we infer the characteristic size of the emitting region for both the continuum and the Brα emission. The fitted size and reduced χ2 values for each model are indicated in the corresponding panels, allowing comparison of model performance. |
| In the text | |
|
Fig. 11. Model image corresponding to the best-fit brightness distribution that reproduces the observed MATISSE interferometric observables around the entire line profile of the Brα emission. The image was generated using PMOIRED, adopting the same geometry and parameters that yield the visibility, closure phase, and differential phase fits shown in Fig. 12. The intensity is normalised and displayed in logarithmic scale to highlight both the compact continuum and more extended Brα-emitting structures. |
| In the text | |
|
Fig. 12. Comparison between observed MATISSE interferometric observables (black) and best-fit model (red) predictions across all baseline configurations. From left to right, the panels show flux spectra, closure phases, differential phases, and visibilities. Each baseline is colour-coded to fit the uv-plane shown in Fig. 4. |
| In the text | |
|
Fig. A.1. Full observed wavelength range of CRIRES+ for IRAS 17163 (blue) and IRC+10420 (orange), including the telluric reference (red), with line identifications (uncertain identifications marked with ; NSO/Kitt Peak FTS atmosphere data produced by NSF/NOAO). The normalised fluxes of the sources have been manually shifted by +0.6 and +0.3 units, respectively. The panels also zoom in on the well-resolved fundamental CO rovibrational transitions and cover the higher-order P-branch lines (last 2 panels), shown for completeness despite strong telluric contamination (not included in Table A.1). |
| In the text | |
|
Fig. A.2. Detected atomic features for IRAS 17163 and IRC+10420 with CRIRES+. Uncertain identifications are marked with a *. |
| In the text | |
|
Fig. B.1. From top to bottom: Line-of-sight velocity with respect to the local standard of rest (VLSR), the equivalent width (EW), and the full width at half maximum (FWHM) of the Brα emission as measured with MATISSE (Table B.2). |
| In the text | |
|
Fig. B.2. Channel maps from the fitting process of the MATISSE data using PMOIRED across the wavelength interval of 4.050–4.056 μm (Brα emission). Each panel corresponds to a single sampled wavelength slice; the associated Doppler velocity with respect to the local standard of rest, vLSR, is indicated in the upper-left corner of each frame (computed relative to the Brα rest wavelength λ0 = 4.0523 μm). The systemic velocity of 18 km/sec is based on Fe II lines in the optical (Wallström et al. 2017). |
| In the text | |
|
Fig. B.3. Brα image reconstructions of IRAS 17163 using WISARD. (Top) Integrated intensity around the Brα emission obtained by summing all velocity channels. (Grid) Velocity-channel reconstructed maps across the Brα line profile (constant velocity step of Δv km s−1), progressing from blue-shifted (top left) to red-shifted (bottom right) emission. In both panels, the reconstructed L-band continuum emission is overplotted as red contours to highlight the spatial extent of the ionised emission relative to the continuum. |
| In the text | |
Current usage metrics show cumulative count of Article Views (full-text article views including HTML views, PDF and ePub downloads, according to the available data) and Abstracts Views on Vision4Press platform.
Data correspond to usage on the plateform after 2015. The current usage metrics is available 48-96 hours after online publication and is updated daily on week days.
Initial download of the metrics may take a while.