Open Access
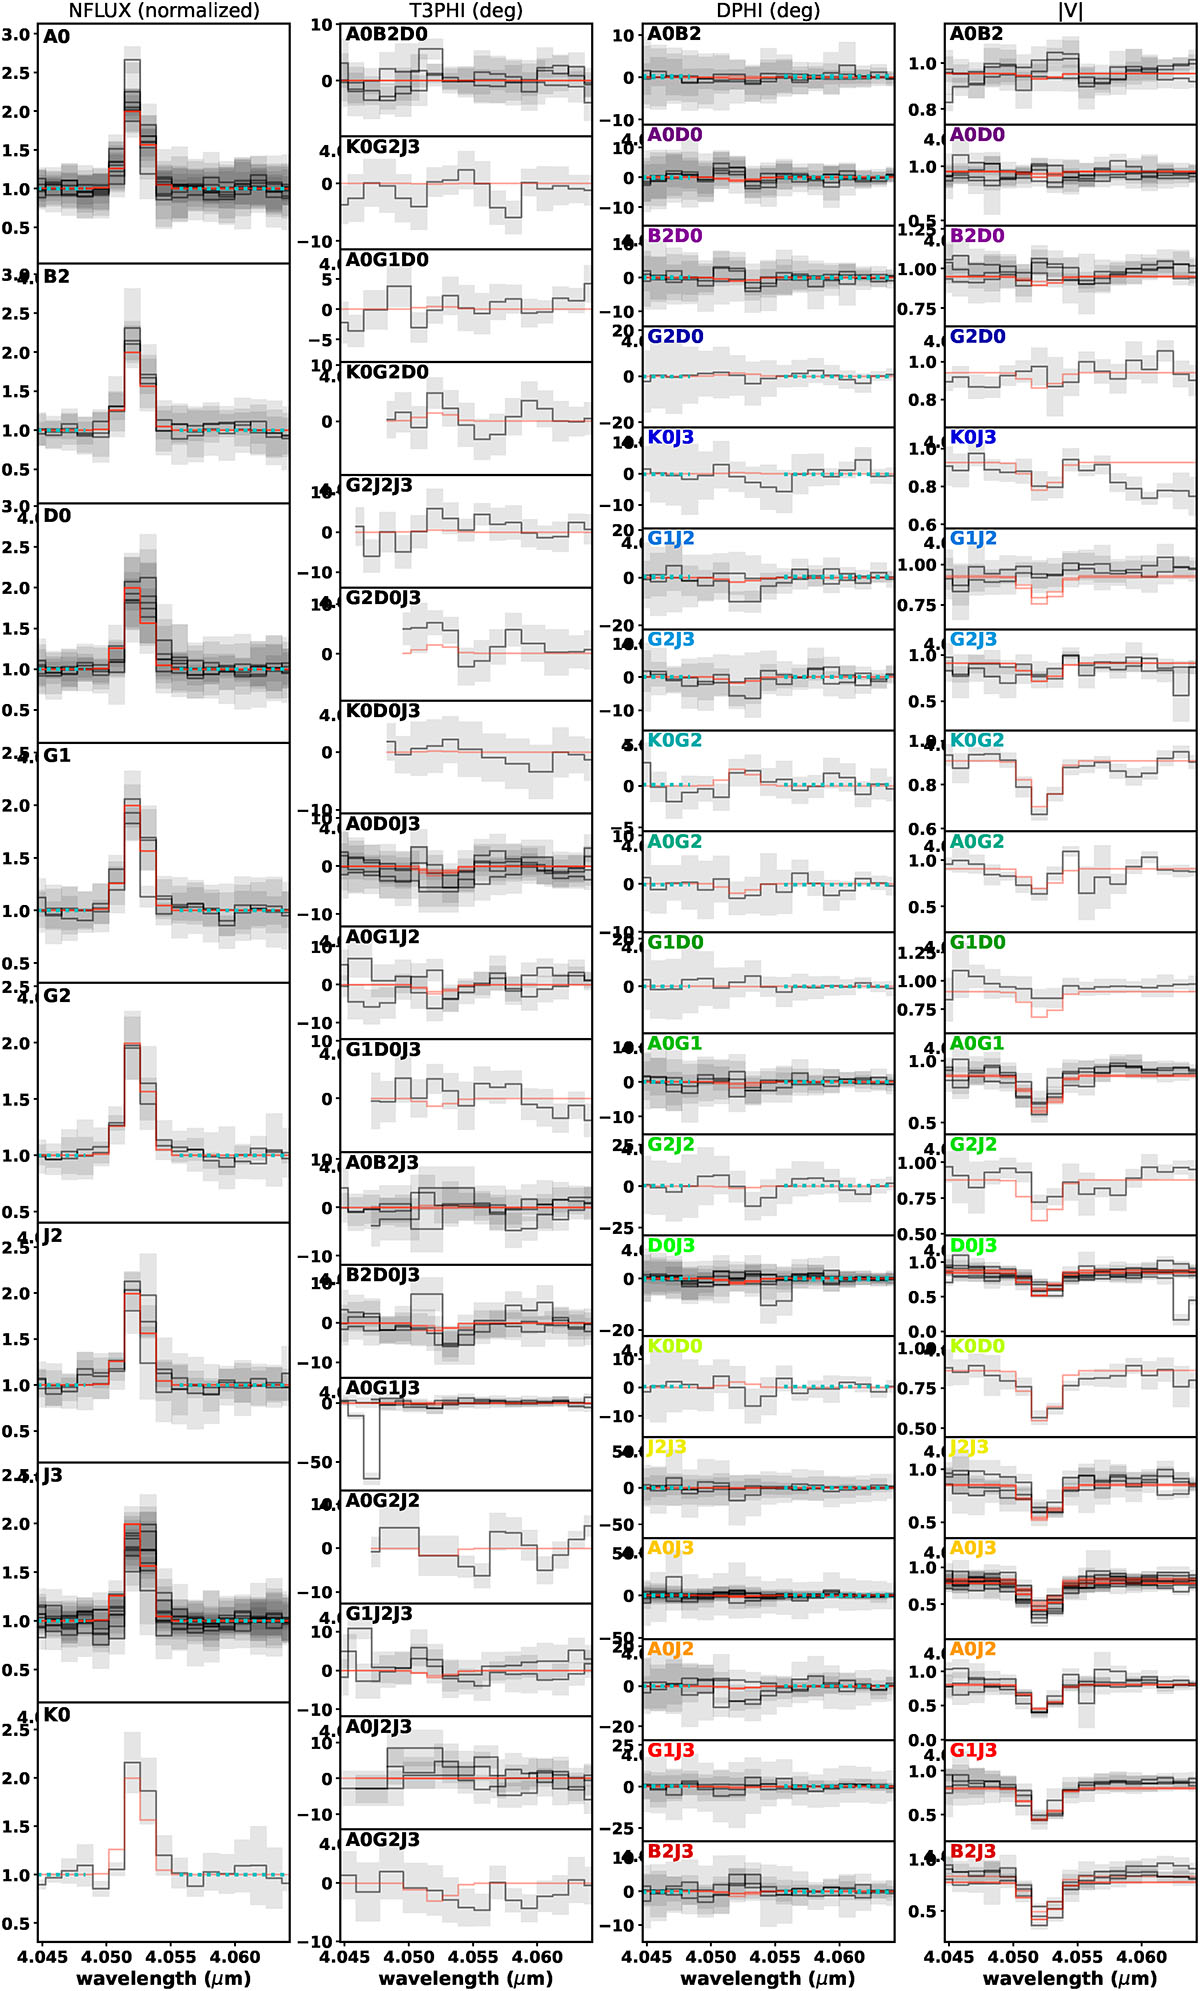
Fig. 12.
Download original image
Comparison between observed MATISSE interferometric observables (black) and best-fit model (red) predictions across all baseline configurations. From left to right, the panels show flux spectra, closure phases, differential phases, and visibilities. Each baseline is colour-coded to fit the uv-plane shown in Fig. 4.
Current usage metrics show cumulative count of Article Views (full-text article views including HTML views, PDF and ePub downloads, according to the available data) and Abstracts Views on Vision4Press platform.
Data correspond to usage on the plateform after 2015. The current usage metrics is available 48-96 hours after online publication and is updated daily on week days.
Initial download of the metrics may take a while.