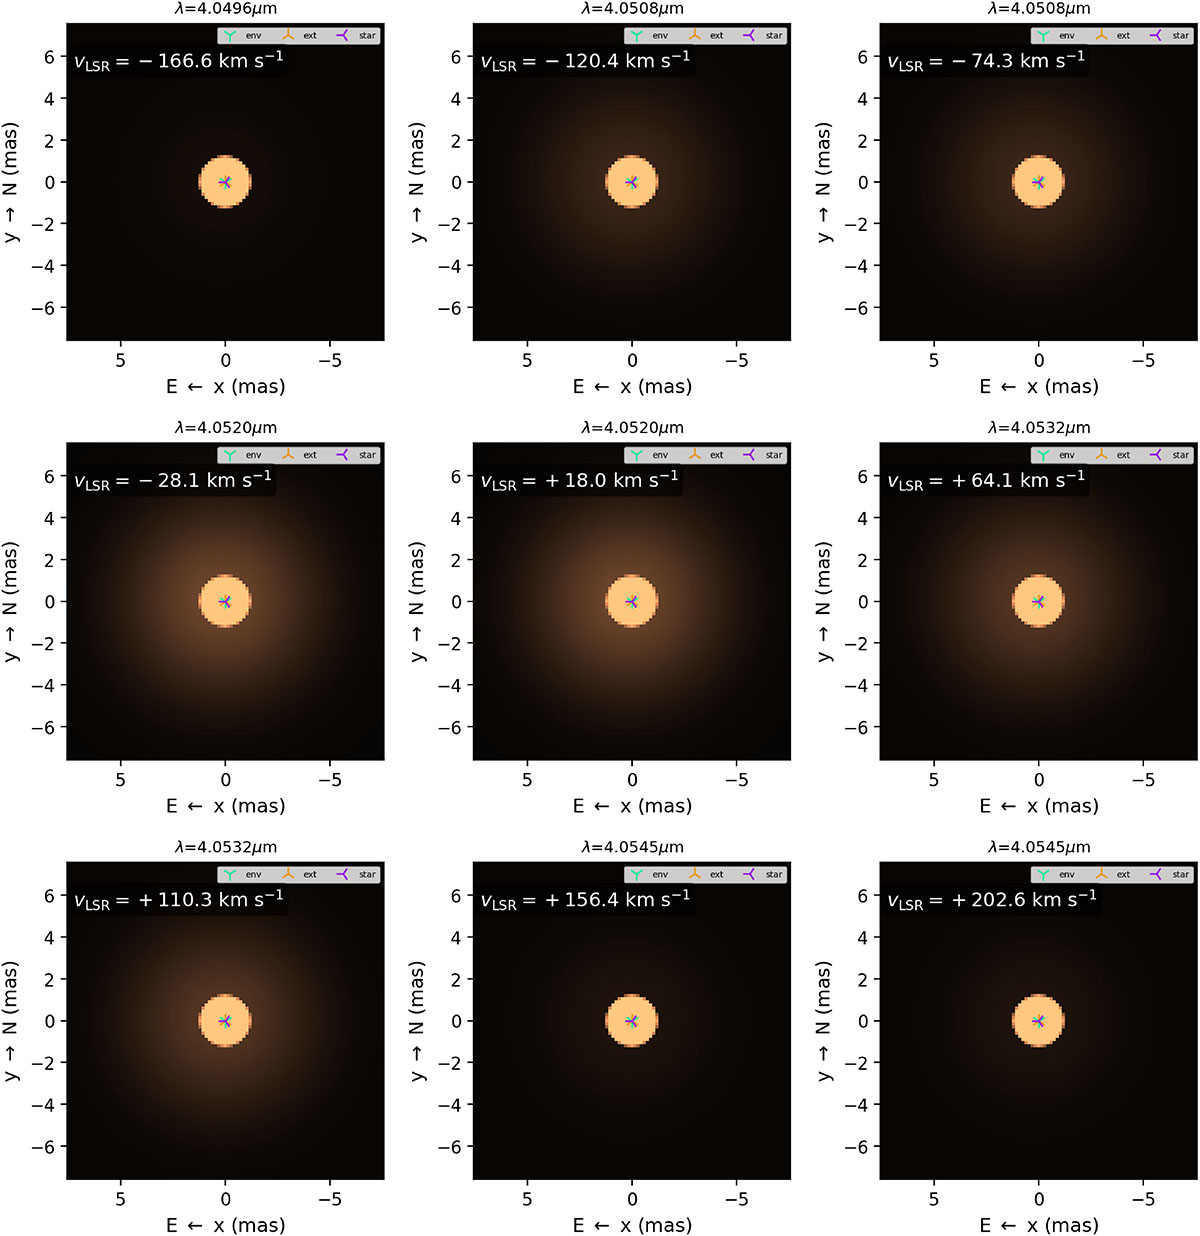
Fig. B.2.
Download original image
Channel maps from the fitting process of the MATISSE data using PMOIRED across the wavelength interval of 4.050–4.056 μm (Brα emission). Each panel corresponds to a single sampled wavelength slice; the associated Doppler velocity with respect to the local standard of rest, vLSR, is indicated in the upper-left corner of each frame (computed relative to the Brα rest wavelength λ0 = 4.0523 μm). The systemic velocity of 18 km/sec is based on Fe II lines in the optical (Wallström et al. 2017).
Current usage metrics show cumulative count of Article Views (full-text article views including HTML views, PDF and ePub downloads, according to the available data) and Abstracts Views on Vision4Press platform.
Data correspond to usage on the plateform after 2015. The current usage metrics is available 48-96 hours after online publication and is updated daily on week days.
Initial download of the metrics may take a while.