Fig. 7.
Download original image
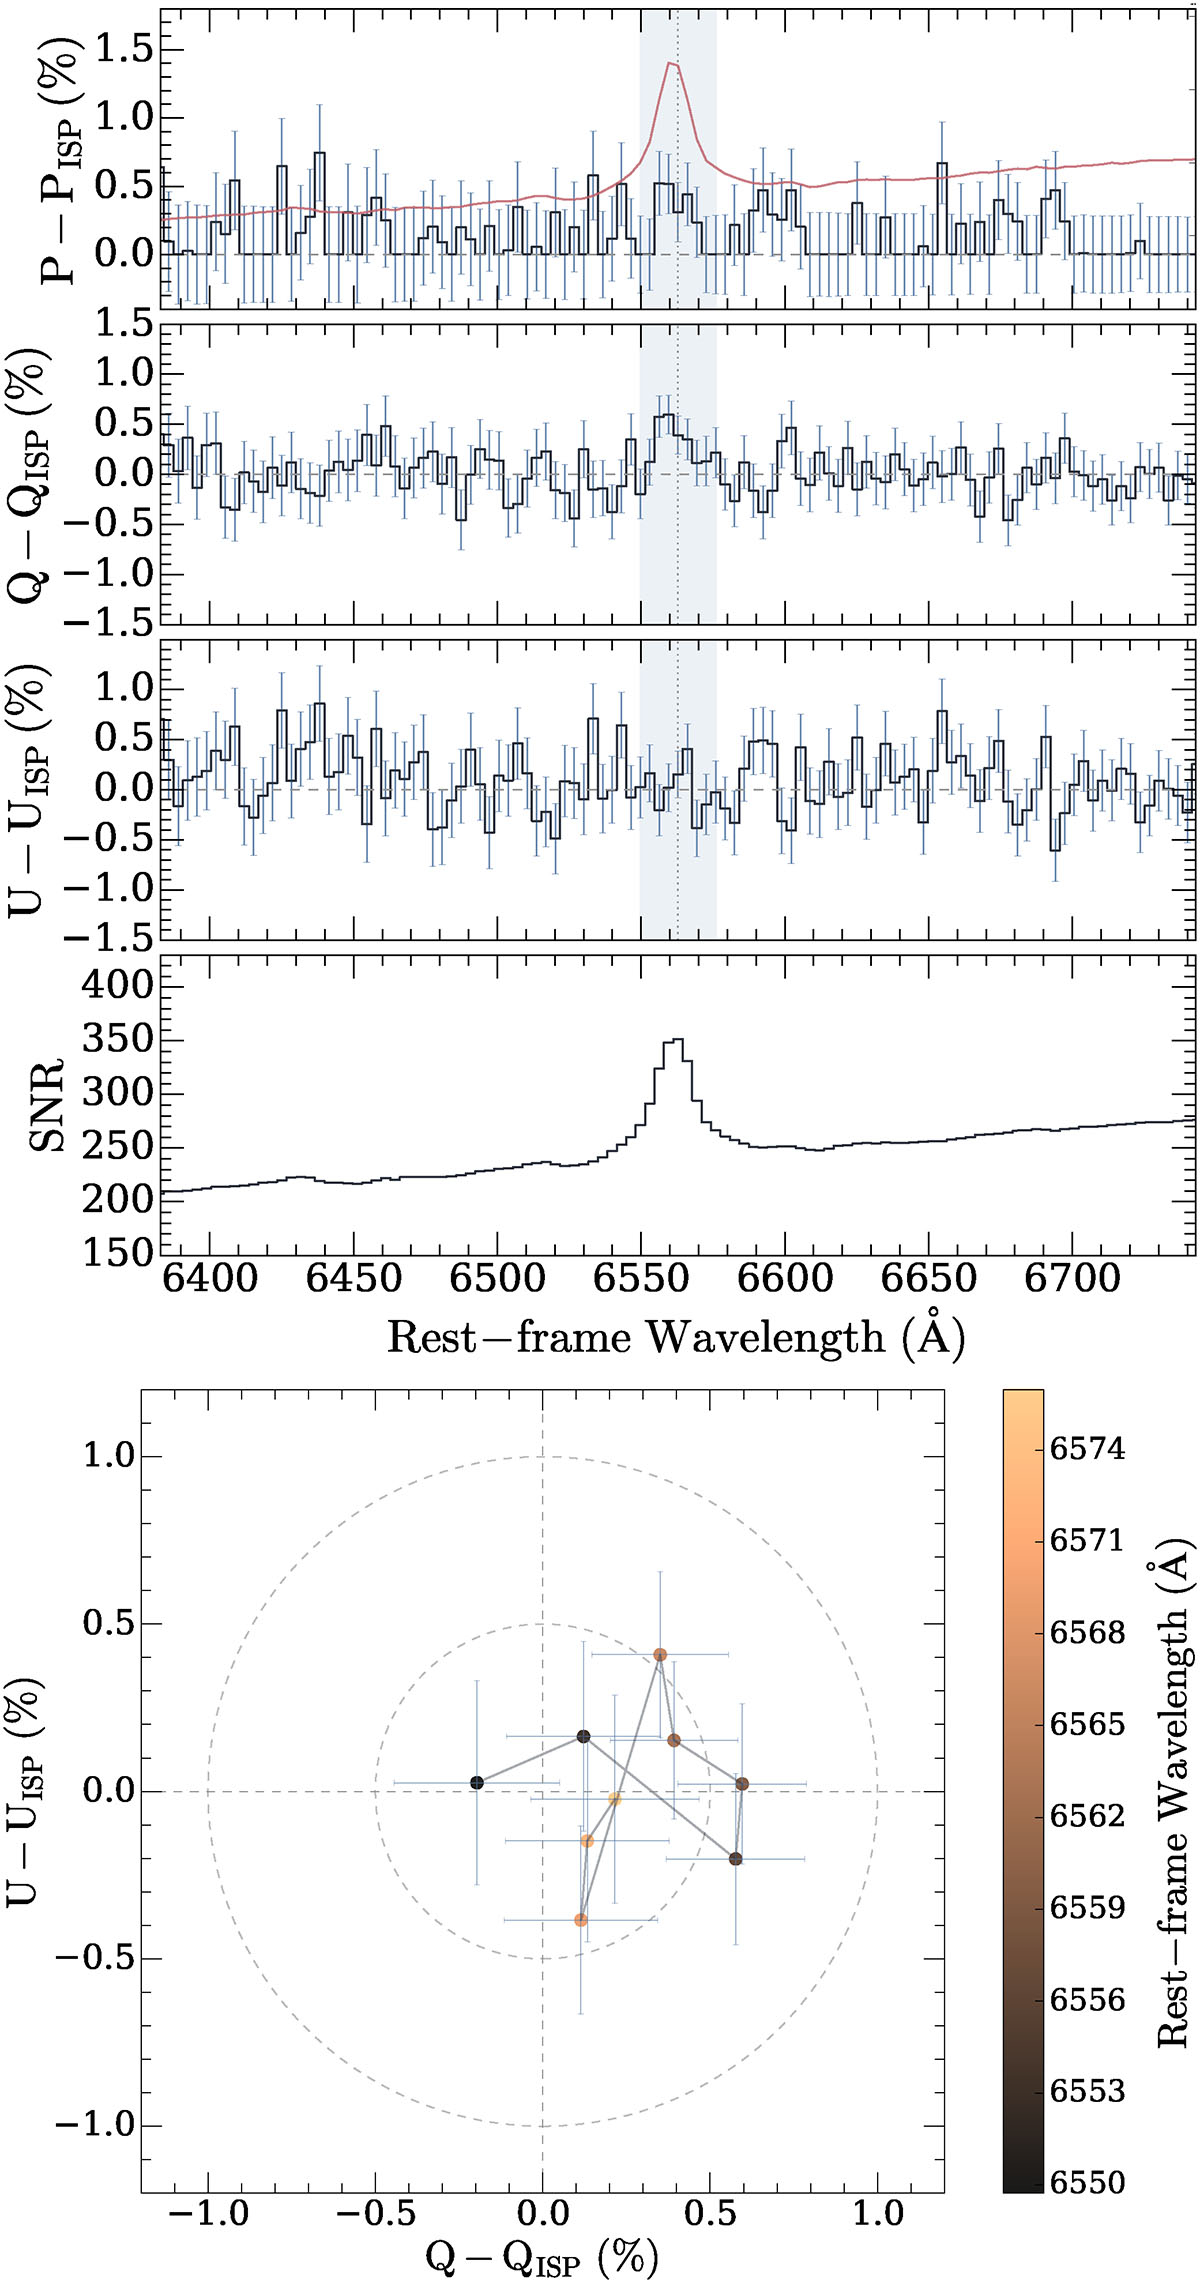
Combined FORS2 spectropolarimetric observations of the Hα line in IRAS 17163 obtained on 4 and 8 July 4 2023. The data are unbinned and continuum-subtracted. The polarisation spectrum (top panel) has been corrected for polarisation bias. The red line in the top panel represents the flux spectrum. The light blue shading indicates the wavelength range 6550–6576 Å used for plotting the Hα line in the Q–U plane (bottom panel).
Current usage metrics show cumulative count of Article Views (full-text article views including HTML views, PDF and ePub downloads, according to the available data) and Abstracts Views on Vision4Press platform.
Data correspond to usage on the plateform after 2015. The current usage metrics is available 48-96 hours after online publication and is updated daily on week days.
Initial download of the metrics may take a while.