Fig. B.3.
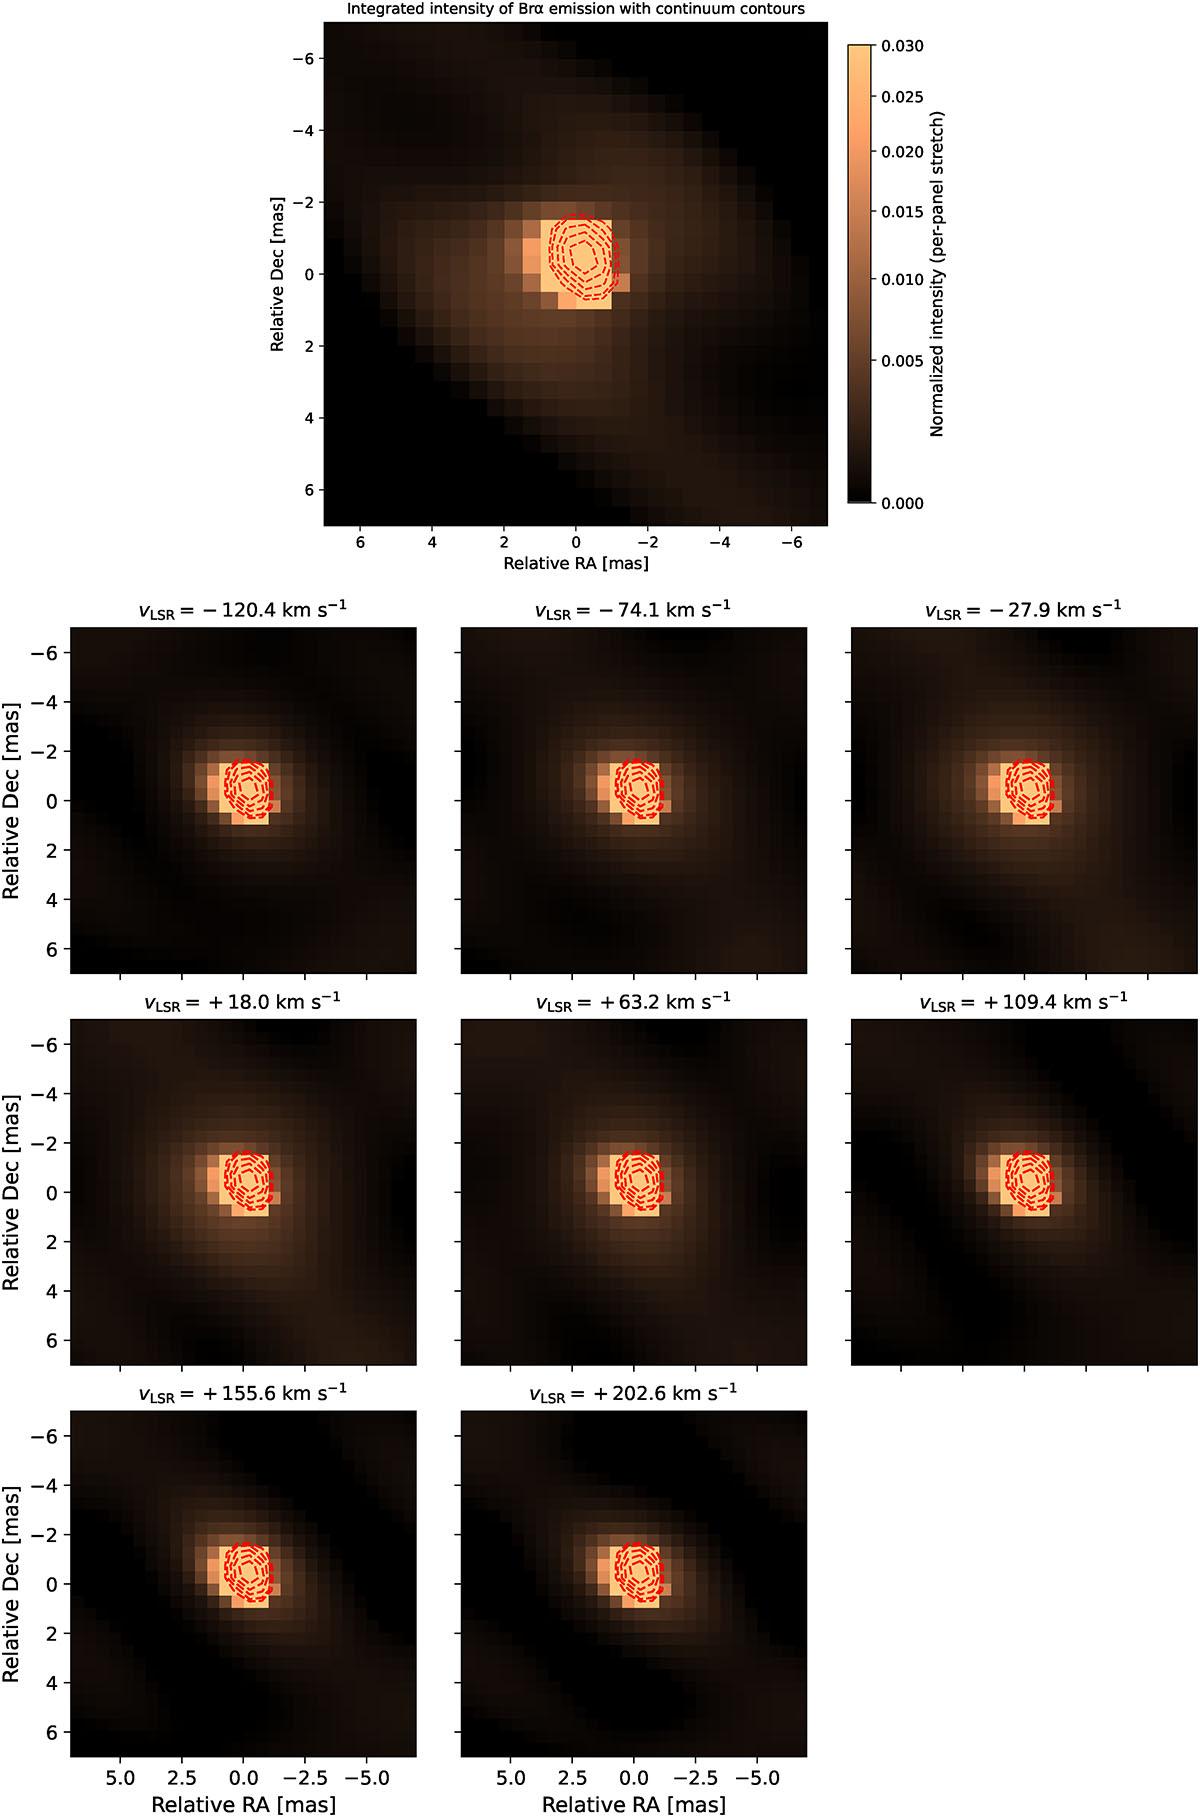
Download original image
Brα image reconstructions of IRAS 17163 using WISARD. (Top) Integrated intensity around the Brα emission obtained by summing all velocity channels. (Grid) Velocity-channel reconstructed maps across the Brα line profile (constant velocity step of Δv km s−1), progressing from blue-shifted (top left) to red-shifted (bottom right) emission. In both panels, the reconstructed L-band continuum emission is overplotted as red contours to highlight the spatial extent of the ionised emission relative to the continuum.
Current usage metrics show cumulative count of Article Views (full-text article views including HTML views, PDF and ePub downloads, according to the available data) and Abstracts Views on Vision4Press platform.
Data correspond to usage on the plateform after 2015. The current usage metrics is available 48-96 hours after online publication and is updated daily on week days.
Initial download of the metrics may take a while.