Fig. 5.
Download original image
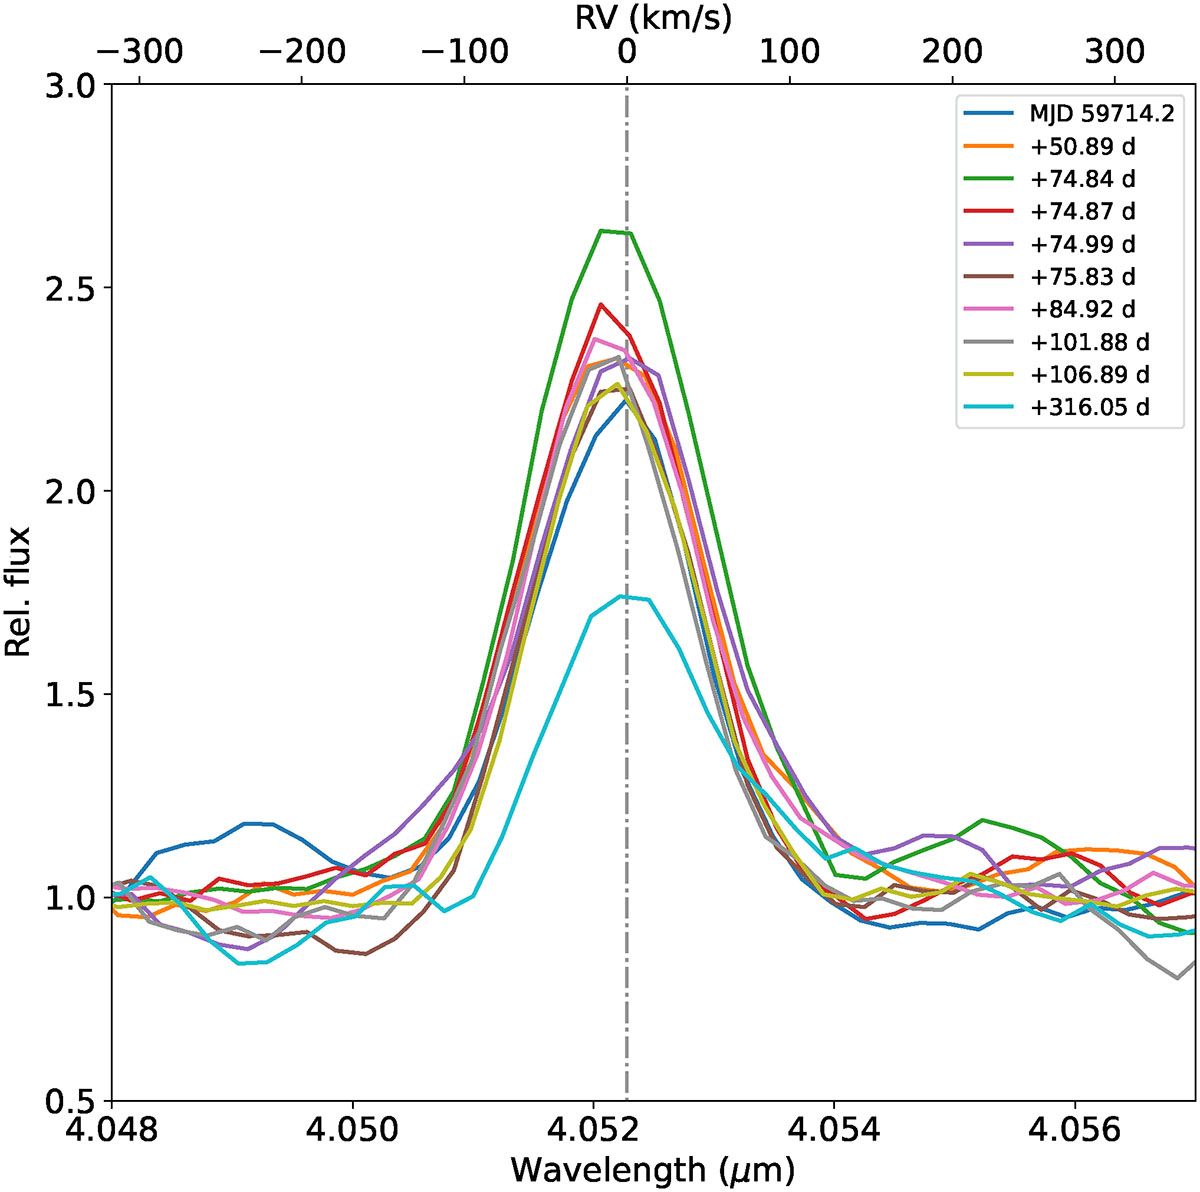
Brα line profiles observed with MATISSE, corrected for heliocentric velocity shifts, and overplotted for all available epochs. This comparison highlights the temporal variability in the line emission, revealing changes in both the line shape and intensity. The profiles have been normalised to the continuum and aligned in velocity space to facilitate direct comparison.
Current usage metrics show cumulative count of Article Views (full-text article views including HTML views, PDF and ePub downloads, according to the available data) and Abstracts Views on Vision4Press platform.
Data correspond to usage on the plateform after 2015. The current usage metrics is available 48-96 hours after online publication and is updated daily on week days.
Initial download of the metrics may take a while.