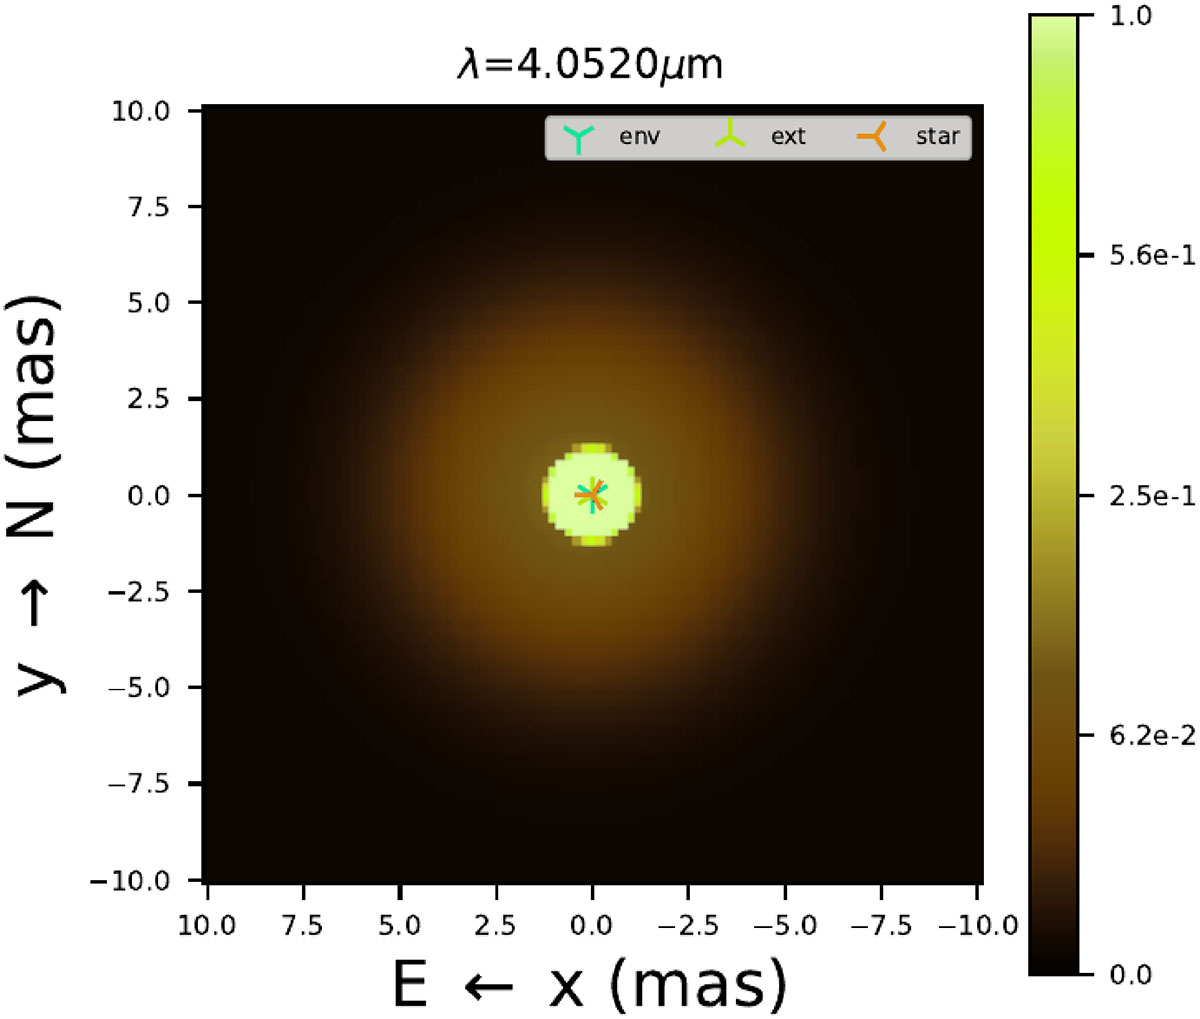
Fig. 11.
Download original image
Model image corresponding to the best-fit brightness distribution that reproduces the observed MATISSE interferometric observables around the entire line profile of the Brα emission. The image was generated using PMOIRED, adopting the same geometry and parameters that yield the visibility, closure phase, and differential phase fits shown in Fig. 12. The intensity is normalised and displayed in logarithmic scale to highlight both the compact continuum and more extended Brα-emitting structures.
Current usage metrics show cumulative count of Article Views (full-text article views including HTML views, PDF and ePub downloads, according to the available data) and Abstracts Views on Vision4Press platform.
Data correspond to usage on the plateform after 2015. The current usage metrics is available 48-96 hours after online publication and is updated daily on week days.
Initial download of the metrics may take a while.