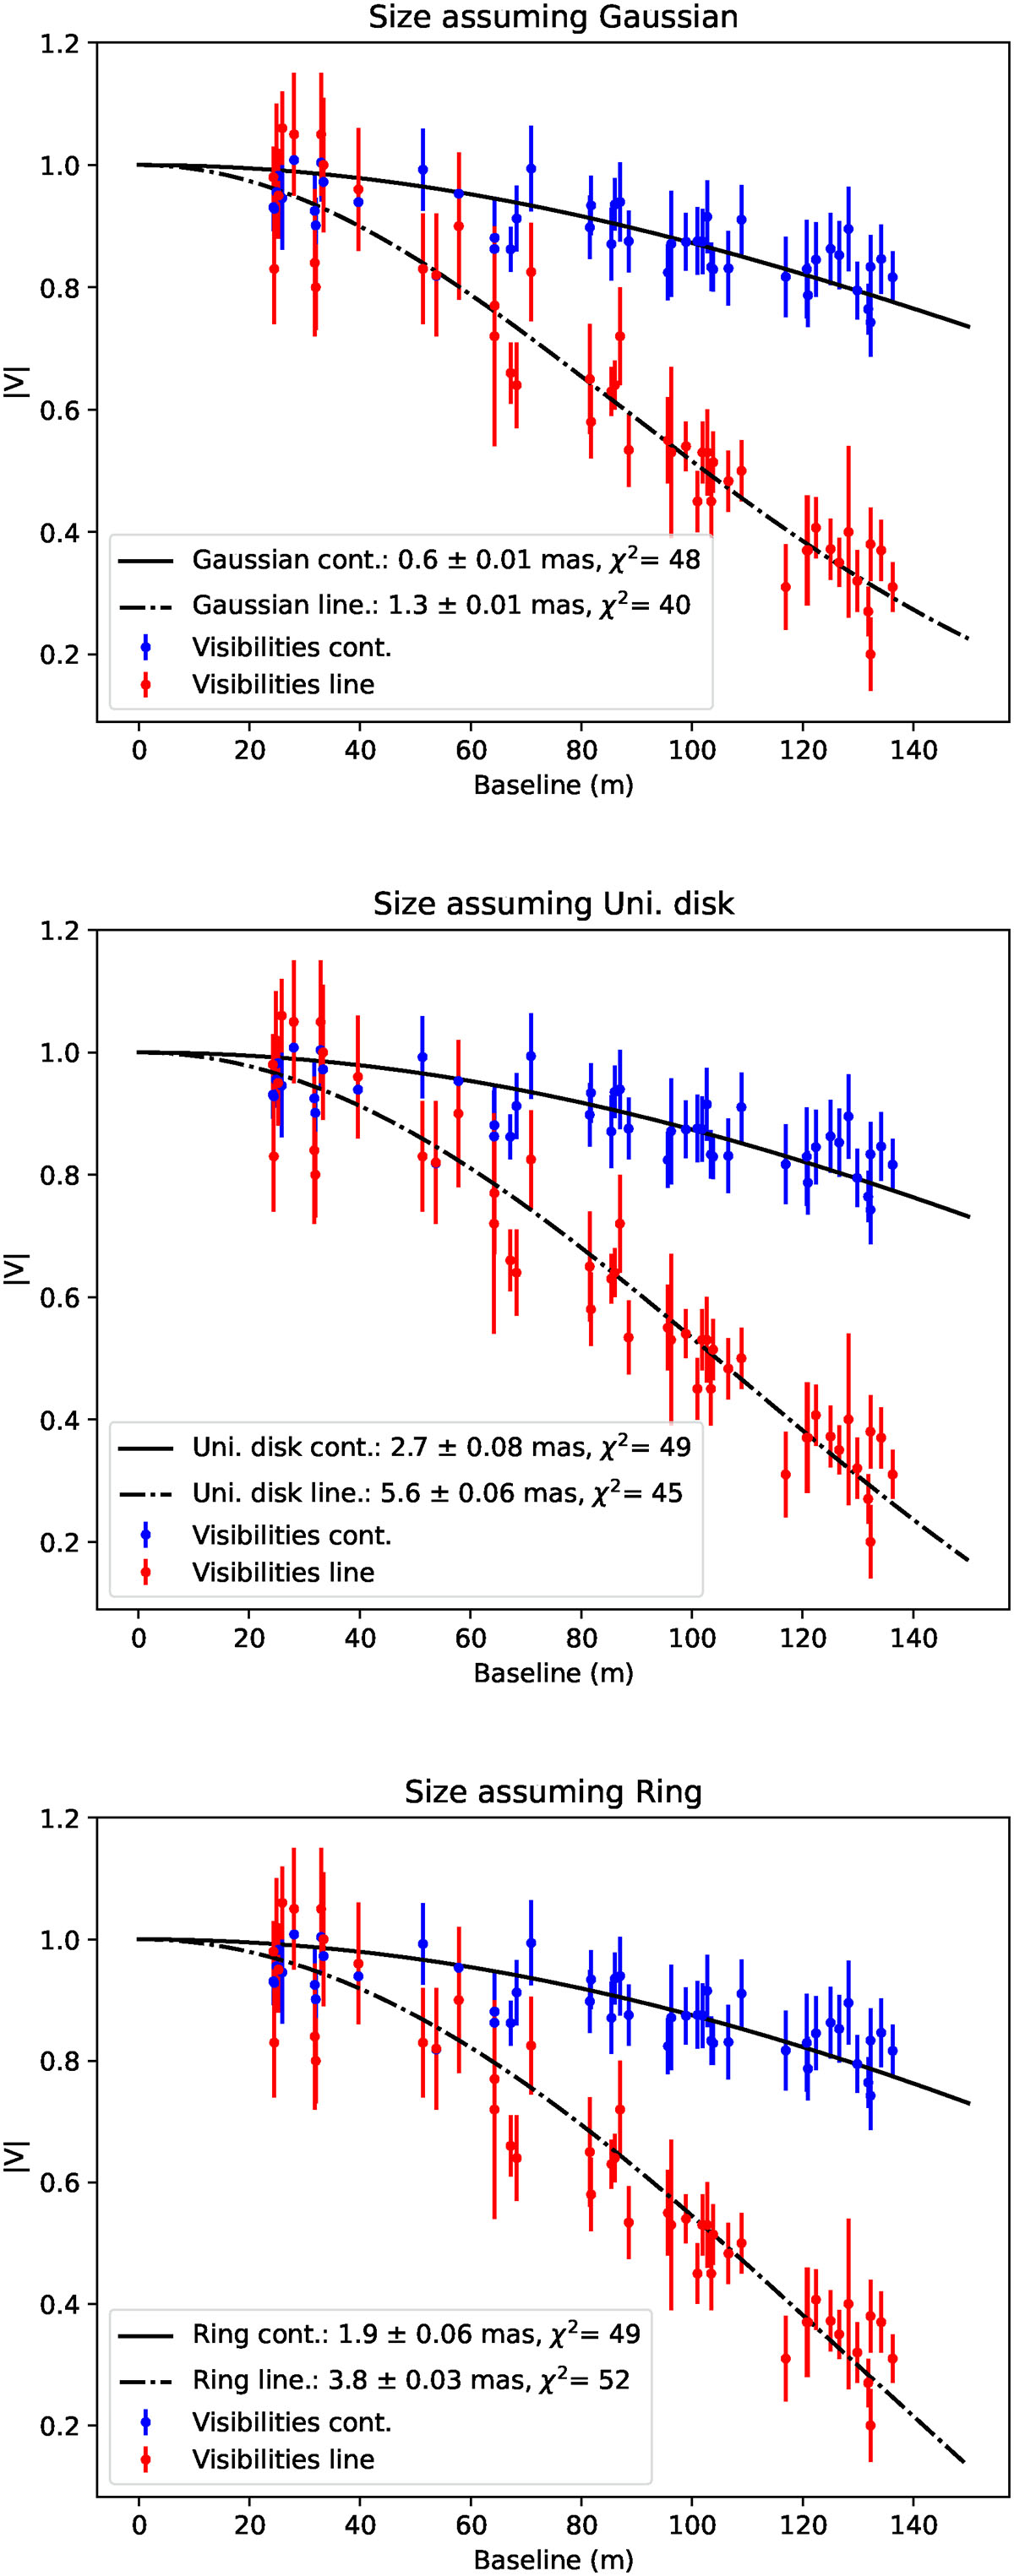
Fig. 10.
Download original image
Visibility amplitudes as a function of baseline length, shown for the continuum (averaged for 4.04-4.05 μm and 4.054-4.06 μm; blue), and at the peak of the Brα line emission at 4.052 μm (red). The observed visibilities are fit to three different brightness distributions: a Gaussian (top), a uniform disc (middle), and a ring (bottom). By fitting these models to the observed visibilities, we infer the characteristic size of the emitting region for both the continuum and the Brα emission. The fitted size and reduced χ2 values for each model are indicated in the corresponding panels, allowing comparison of model performance.
Current usage metrics show cumulative count of Article Views (full-text article views including HTML views, PDF and ePub downloads, according to the available data) and Abstracts Views on Vision4Press platform.
Data correspond to usage on the plateform after 2015. The current usage metrics is available 48-96 hours after online publication and is updated daily on week days.
Initial download of the metrics may take a while.