| Issue |
A&A
Volume 709, May 2026
|
|
|---|---|---|
| Article Number | A73 | |
| Number of page(s) | 20 | |
| Section | Planets, planetary systems, and small bodies | |
| DOI | https://doi.org/10.1051/0004-6361/202558749 | |
| Published online | 05 May 2026 | |
TOI-4552 b: A new ultra-short-period rocky world revealed by NIRPS and TESS
1
Institut Trottier de recherche sur les exoplanètes, Département de Physique, Université de Montréal,
Montréal,
Québec,
Canada
2
Observatoire du Mont-Mégantic,
Québec,
Canada
3
Observatoire de Genève, Département d’Astronomie, Université de Genève,
Chemin Pegasi 51,
1290
Versoix,
Switzerland
4
Department of Physics & Astronomy, McMaster University,
1280 Main St W,
Hamilton,
ON
L8S 4L8,
Canada
5
Centro de Astrobiología (CAB), CSIC-INTA,
Camino Bajo del Castillo s/n,
28692,
Villanueva de la Cañada (Madrid),
Spain
6
Instituto de Astrofísica e Ciências do Espaço, Universidade do Porto,
CAUP, Rua das Estrelas,
4150-762
Porto,
Portugal
7
Departamento de Física Teórica e Experimental, Universidade Federal do Rio Grande do Norte,
Campus Universitário,
Natal,
RN,
59072-970,
Brazil
8
Univ. Grenoble Alpes, CNRS, IPAG,
38000
Grenoble,
France
9
Departamento de Física e Astronomia, Faculdade de Ciências, Universidade do Porto,
Rua do Campo Alegre,
4169-007
Porto,
Portugal
10
Department of Earth, Planetary, and Space Sciences, University of California,
Los Angeles,
CA
90095,
USA
11
Department of Physics, University of Toronto,
Toronto,
ON
M5S 3H4,
Canada
12
Department of Physics, McGill University, 3600 rue University,
Montréal,
QC
H3A 2T8,
Canada
13
Department of Earth & Planetary Sciences, McGill University,
3450 rue University,
Montréal,
QC
H3A 0E8,
Canada
14
Centre Vie dans l’Univers, Faculté des sciences de l’Université de Genève,
Quai Ernest-Ansermet 30,
1205
Geneva,
Switzerland
15
Instituto de Astrofísica de Canarias (IAC),
Calle Vía Láctea s/n,
38205
La Laguna,
Tenerife,
Spain
16
Departamento de Astrofísica, Universidad de La Laguna (ULL),
38206
La Laguna,
Tenerife,
Spain
17
Space Research and Planetary Sciences, Physics Institute, University of Bern,
Gesellschaftsstrasse 6,
3012
Bern,
Switzerland
18
Consejo Superior de Investigaciones Científicas (CSIC),
28006
Madrid,
Spain
19
Bishop’s University, Dept of Physics and Astronomy,
Johnson-104E, 2600 College Street,
Sherbrooke,
QC
J1M 1Z7,
Canada
20
Department of Physics, Engineering Physics, and Astronomy, Queen’s University,
99 University Avenue,
Kingston,
ON
K7L 3N6,
Canada
21
Department of Physics and Space Science, Royal Military College of Canada,
13 General Crerar Cres.,
Kingston,
ON
K7P 2M3,
Canada
22
Center for astrophysics | Harvard & Smithsonian,
60 Garden Street,
Cambridge,
MA
02138,
USA
23
American Association of Variable Star Observers,
Cambridge,
USA
24
Department of Physics, University of Oxford,
Oxford
OX13RH,
UK
25
LESIA, Observatoire de Paris, CNRS, Université Paris Diderot, Universite Pierre et Marie Curie,
5 place Jules Janssen,
92190
Meudon,
France
26
AIM, CEA, CNRS, Université Paris-Saclay, Universite de Paris,
91191
Gif-sur-Yvette,
France
27
Department of Physics and Astronomy, The University of New Mexico,
210 Yale Blvd NE,
Albuquerque,
NM
87106,
USA
28
SETI Institute, Mountain View, CA 94043, USA NASA Ames Research Center,
Moffett Field,
CA
94035,
USA
29
Department of Physics, The University of Warwick,
Gibbet Hill Road,
Coventry
CV4 7AL,
UK
30
Space Telescope Science Institute,
3700 San Martin Drive,
Baltimore,
MD
21218,
USA
31
School of Physics & Astronomy, University of Birmingham,
Edgbaston,
Birmingham
B15 2TT,
UK
32
Department of Physics and Kavli Institute for Astrophysics and Space Research, Massachusetts Institute of Technology,
Cambridge,
MA
02139,
USA
33
Astrobiology Research Unit, Université de Liège,
19C Allée du 6 Août,
4000
Liège,
Belgium
★ Corresponding author: This email address is being protected from spambots. You need JavaScript enabled to view it.
Received:
23
December
2025
Accepted:
16
March
2026
Abstract
Context. A particularly intriguing subclass of rocky exoplanets are ultra-short-period worlds, which orbit their host stars in less than a day. These planets are particularly rare around M dwarf stars, and only ten of them have a constrained mass and radius so far.
Aims. We present the validation and characterisation of the ultra-short-period (0.3 days) Earth-sized planet TOI-4552 b orbiting a nearby (27.26 pc away) M4.5V dwarf.
Methods. We complemented TESS photometry ground-based transit observations from LCO, ExTrA, and SPECULOOS to validate the planetary radius, and we cleared the field of any contaminants. Speckle imaging with Zorro (Gemini-S) rules out false-positive scenarios caused by eclipsing binary sources. Spectroscopic observations with NIRPS and HARPS were used to obtain stellar abundances, constrain the planetary mass, and estimate the orbital parameters in conjunction with the transit observations.
Results. TOI-4552 is a quiet star. It lacks short-term stellar variations in photometric or radial velocity data that might be associated with stellar rotation. Long-term photometric data from ASAS-SN also suggest a lack of activity signals. TOI-4552 b (Mp = 1.83 ± 0.47 M⊕, Rp = 1.11 ± 0.04 R⊕) lies between the Earth-like and iron-rich composition tracks on the mass-radius diagram. The exopie interior structure model, without constraints from refractory abundance ratio, yields a core mass fraction of 0.54−0.25+0.17 and a bulk density of 7.74±2.14g/cm3. Since the core mass fraction spans a wide range because the uncertainty on the mass is high, the definitive interior composition cannot be determined with the current dataset.
Conclusions. TOI-4552 b probably is marginally richer in iron than the Earth, but confirmation of its status requires additional precise radial velocity measurements. Combined with its high emission spectroscopic metric (ESM = 19.5), negligible stellar activity, and short orbital period, TOI-4552 b emerges as a compelling target for atmospheric and surface composition studies with JWST.
Key words: planets and satellites: composition / planets and satellites: detection / planets and satellites: interiors / stars: abundances / stars: low-mass
© The Authors 2026
 Open Access article, published by EDP Sciences, under the terms of the Creative Commons Attribution License (https://creativecommons.org/licenses/by/4.0), which permits unrestricted use, distribution, and reproduction in any medium, provided the original work is properly cited.
This article is published in open access under the Subscribe to Open model. This email address is being protected from spambots. You need JavaScript enabled to view it. to support open access publication.
1 Introduction
The Transiting Exoplanet Survey Satellite (TESS; Ricker et al. 2015) mission has been at the forefront of discovering new worlds in the solar neighbourhood via the transit method. As of 2025, more than 7000 planetary candidates have been flagged in TESS datasets around a varied population of stars. These stars include M dwarfs, which are cooler (Teff < 4000 K) and less massive (M* = 0.1-0.7M⊙) than the Sun, but are more numerous in our Galaxy (e.g. Chabrier 2001; Bochanski et al. 2010). Their smaller size facilitates stronger signals for transiting planets, and their low mass allows for the detection of smaller planets around them. All these factors make exoplanets easier to detect around such stars, which are also known to host a large population of rocky planets (Bonfils et al. 2013; Dressing & Charbonneau 2015; Gillis et al. 2026). However, it is important to note that many M dwarfs exhibit substantial stellar activity (e.g. Galletta et al. 2025; Rajpurohit et al. 2025; Mignon et al. 2023; Roettenbacher & Kane 2017) which can significantly hinder planet detection. As a result, while M dwarfs offer clear advantages for exoplanet searches, their intrinsic activity can also present notable observational challenges.
Due to their lower effective temperatures, M-type stars are brighter in the near-infrared (NIR) than in the visible (VIS) wavelength band. To extract the maximum amount of spectral information from these stars, a new dedicated instrument, the Near-Infra-Red Planet Searcher (NIRPS; Bouchy et al. 2025, 2017), has been developed. NIRPS is installed on the 3.6 m telescope at La Silla Observatory in Chile and works alongside the High Accuracy Radial velocity Planet Searcher (HARPS; Mayor et al. 2003). As part of the guaranteed time observation (GTO) sub-programme 2 (SP2) of NIRPS, we followed-up TESS transiting candidates to confirm planetary detections and measure their masses. The measurement of the planetary mass and radius is crucial for placing meaningful constraints on its interior and atmospheric composition through the bulk density.
One particularly interesting subclass of rocky planets are ultra-short-period (USP) worlds, which are uniquely identified by their orbital period of less than 1 day. While some, such as 55 Cancri e (Dawson & Fabrycky 2010; McArthur et al. 2004), have been studied extensively, their rarity makes it difficult to conduct a wider study. Only ten USPs orbiting M dwarfs have published masses and radii (Lee et al. 2025; Dai et al. 2024; Murgas et al. 2024; Burt et al. 2024; Palle et al. 2023; Essack et al. 2023; Lam et al. 2021; Bluhm et al. 2021; Cloutier et al. 2021; Hirano et al. 2021; Cloutier et al. 2020; Shporer et al. 2020). A small dataset like this is not enough to develop a complete understanding about the nature of these worlds. Observations with the James Webb Space Telescope (JWST; Gardner et al. 2006, 2023) have revealed that several USPs are barren worlds lacking substantial atmospheres (e.g. Kreidberg et al. 2019; Luque et al. 2025) that were likely stripped by the intense stellar irradiation to which these planets are subjected (>200 S⊕). As a result, interior structure models can be run without atmospheric degeneracies. Since previous studies (Plotnykov & Valencia 2020; Brinkman et al. 2024) have concluded that rocky planets exhibit a diverse range of compositions, it is only by expanding the sample size that we can identify any trends and conduct population studies.
Beyond their compositional significance, USPs offer unique opportunities for surface geological studies with JWST. Their short orbital periods make them available for short and repeated observations, and their high irradiation can drive detectable phase-curve signals. Phase-curve and secondary eclipse measurements can constrain albedos, day-night temperature contrasts, and even surface mineralogy in the absence of an atmosphere (e.g. Hu et al. 2012; Paragas et al. 2025).
We present the discovery and characterisation of a USP, TOI-4552 b, as part of the NIRPS GTO SP2. The paper is structured as follows: Section 2 discusses the various facilities in space and on the ground that were used to observe the target star and construct our dataset. Section 3 covers the various methods we used to characterise the star using photometry and HARPS+NIRPS spectroscopy. In Sect. 4, we present our global photometry and RV model and analysis of the results. Section 5 discusses the results in more detail and presents the interior structure modelling and future scientific relevance of TOI-4552 b. Finally, we summarise and conclude in Sect. 6.
2 Observations
2.1 TESS photometry
The first alert for TOI-4552b (TIC 248250955) was as a level 1 planetary candidate (Guerrero et al. 2021) on October 28, 2021, by the TESS Science Processing Operations Center (SPOC; Jenkins et al. 2016) pipeline at NASA Ames Research Center on the publicly available TESS data webpage1. It has been observed in TESS sectors 12 (year 1), 39 (year 3), and 66 (year 5), each with a 120-second exposure time and a 20-second exposure time for sector 66. The target was imaged on CCD 2 of camera 1 for all three sectors. Owing to the short orbital period of 0.3011 days, each sector contains approximately 70 transits.
Since the TESS pixels are relatively large (21″ on sky), the retrieved stellar flux of its targets is often contaminated by a neighbour. tpfplotter (Aller et al. 2020) was used to plot the target pixel file (TPF) for sector 12 (Fig. 1) consisting of neighbouring sources from Gaia DR3 (Gaia Collaboration 2023). The TPF highlights the pixels used for the aperture mask to obtain the simple aperture photometry (SAP; Twicken et al. 2010; Morris et al. 2020) flux in orange. Because the field is crowded, we used TESS-cont (Castro-González et al. 2024) to identify the strongest contamination sources. These stars, with their angular separation from TOI-4552 and relative percentage of contamination, are TIC 248250924 (63″; 17%), TIC 248250937 (18″; 7%), TIC 248251013 (58″; 2%), TIC 248250948 (4″; 1.2%), and TIC 248250933 (44″; 1%). The TPFs for all three sectors highlighting these contaminants are presented in Fig. A.1.
According to the data validation report (DVR; Twicken et al. 2018) produced on October 30, 2023, which presents a joint analysis of the target for all three sectors, the light curves were corrected for dilution and crowding effected by a factor that agreed with the sources listed above. Additionally, the centroid test and the eclipsing binary discrimination test were conducted for validation. The results of these tests favour TOI-4552 as the host of the planetary candidate. A signal-to-noise ratio (S/N) of 11.8 was reported in the DVR for the fit, denoting that the candidate is likely a planet (S/N > 10). Our analysis used the normalised presearch data conditioning simple aperture photometry (PDCSAP; Smith et al. 2012; Stumpe et al. 2012, 2014) flux, which was corrected for dilution in the TESS aperture by known contaminating sources and also for instrumental systematics. Figure 2 shows the three TESS sectors phase folded at the period and time of conjunction of TOI-4552 b.
The large 21″ pixel scale of TESS can also create some ambiguity regarding which star is hosting the transiting planet candidate when multiple stars are located inside the aperture mask. Since the TESS pixel centred on TOI-4552 shows at least one apparent Gaia-detected contaminant, follow-up with seeing-limited ground-based photometry (~1-2″) and diffractionlimited imaging with a high angular resolution is required to attribute the transit event to the correct star and vet false positives from other eclipsing binaries in the aperture mask. Several facilities around the world contribute to this effort under the TESS follow-up observing program (TFOP2) working group sub-group 1 (SG1; Collins 2019).
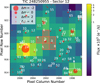 |
Fig. 1 Target pixel file of TOI-4552 for TESS sector 12, created using tpfplotter (Aller et al. 2020). The pixels (21″ pixel scale) outlined in orange correspond to the aperture mask used to extract the SAP flux for the light curve. All Gaia DR3 (Gaia Collaboration 2023) sources in the field are numbered, with 1 marking TOI-4552. The size of the red circles represents the TESS magnitude of the stars relative to TOI-4552. Since it is a crowded field, TESS SPOC provides light curves corrected for the dilution caused by the strongest contaminants. Figure A.1 shows the TPF of all three sectors with the primary contaminants. |
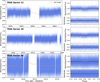 |
Fig. 2 TESS transit light curves from sectors 12, 39, and 66. The normalised flux (blue points) and the Gaussian process (GP) model (orange) used to detrend the light curve is plotted on the left. The phase-folded light curves centred on the transit of TOI-4552 b, the transit model (dashed black line), the binned flux (red points), and the residuals after fitting for the transit are plotted on the right for each sector. Sectors 12 and 39 were observed by TESS at a 2-minute cadence, whereas sector 66 was observed at a 20-second cadence. Since TOI-4552 b is a USP, we chose to keep the high cadence of sector 66 to provide a better sampling at the expense of lower precision. |
2.2 Ground-based transit confirmations: ExTrA
The instrument EXoplanets in Transits and their Atmospheres (ExTrA; Bonfils et al. 2015) is a near-infrared (0.85-1.55 μm) multi-object spectrograph fed by three F/8 telescopes each with 60 cm primary mirrors. We used ExTrA to intensely monitor TOI-4552 from 2022 to 2024 over 26 individual nights as part of TFOP SG1 using the low-resolution (R~20) mode. On 9 of these nights, all three telescopes observed the transit, two telescopes observed the transit on 16 nights, and for one night, only one telescope observed the transit. A total of 61 full and/or partial transits were used in our analysis (Fig. A.2). The data reduction and detrending was performed using the method described in Cointepas et al. (2021). The closest contaminant star, TIC 248250948, lies 3.94″ from the target, so we adopted a 3.86″ aperture to minimise dilution. The typical seeing during the observations was about 1.3″, which ensured that most of the stellar flux remained within the chosen aperture. A 1.2% dilution correction was then applied during the light-curve extraction and detrending level to remove any residual contamination from nearby sources.
2.3 Ground-based transit confirmations: LCOGT
The Las Cumbres Observatory Global Telescope network (LCOGT; Brown et al. 2013) is composed of robotic 1.0 m class telescopes distributed across multiple observatories worldwide and is regularly used for TFOP SG1 follow-up. As part of this programme, TOI-4552 was monitored in 2022, yielding four full transits from the Cerro Tololo Inter-American Observatory (CTIO; Chile) and two full transits from the South African Astronomical Observatory (SAAO; South Africa), all in the Sloan i' photometric bandpass. All data were calibrated using the standard BANZAI pipeline (McCully et al. 2018), and differential photometric data were extracted using AstroImageJ (Collins et al. 2017). The typical photometric aperture radius for all observations was 2.7″. Figure A.2 shows the detrended, combined, and phase-folded transit light curves used in our joint analysis.
2.4 Ground-based transit confirmations: SPECULOOS
The Search for habitable Planets EClipsing ULtra-cOOl Stars (SPECULOOS; Delrez et al. 2018) southern observatory consists of four robotic 1.0 m telescopes (Europa, Ganymede, Io, and Callisto) located at the European Southern Observatory (ESO) Paranal site, suitable for transit observations of late M-type stars such as TOI-4552. Thirteen transits were recorded from 2022 to 2024 with the Ganymede, Europa, and Io telescopes in various combination of the Sloan g′, r′, and z′ filters, and 20 individual transits were used in our analysis. The allesfitter Python package (Günther & Daylan 2021) was used to detrend the transit light curves (Fig. A.2) following a procedure similar to that described by Dransfield et al. (2024) and Henderson et al. (2024).
2.5 High-resolution imaging: Zorro
Additional gravitationally bound or unbound sources might exist that are not resolved in Gaia DR3 and may contaminate the derived planetary and stellar parameters. To assess the effect of such sources (if any) and further rule out false-positive scenarios, as is the standard procedure for TESS objects of interest (TOIs), we observed TOI-4552 with the Zorro imager (Scott et al. 2021) located on the 8.1 m Gemini-South telescope in Chile. Zorro is a fast dual-channel speckle imager that operates at the diffraction limit for a 6.7″ field of view. Observations were made on four individual nights: 17 May 2022, 28 July 2022, 30 July 2022 and 8 April 2023 using the 562 nm and 832 nm bands simultaneously. The techniques and procedures for observation, data reduction, and image reconstruction are described in (Howell et al. 2025). Figure 3 depicts the relative 5σ contrast as a function of on-sky separation; no contaminants were detected within the contrast limit of ∆m ≲ 5 beyond 0.1″.
2.6 NIRPS velocimetry
TOI-4552 was monitored simultaneously by NIRPS and HARPS from 2023 to 2024 for a total of 60 individual nights. These observations were carried out as part of the NIRPS GTO SP2 corresponding to ground-based RV follow-up of TESS planetary candidates. We used the high-efficiency instrument mode (λ/∆λ ~ 75 000), which feeds the spectrograph through a 0.9″ fibre centred on the star and a 0.4″ fibre observing the simultaneous sky background calibration at a separation of 39″ on the sky from the star. The larger science fibre allows for a higher instrument throughput, which is important for observing faint stars such as TOI-4552. The exposure time per observation was 900 seconds, and two consecutive exposures were made every night, except for one night, resulting in a total of 119 individual science frames. Because the orbital period (0.3011 days) is so short, the nightly consecutive observations exhibit a slight but significant phase difference (~7%); we therefore chose not to bin the data.
The raw data used in our analysis were processed via the ESO-supported NIRPS DRS-3.2.0 (Bouchy et al. 2025). A key challenge in near-infrared velocimetry is contamination from telluric absorption and emission lines introduced by Earth’s atmosphere. Although the NIRPS DRS applies a correction for these features (Allart et al. 2022), the process is not always perfect. In particular, at times when the systemic velocity of the star (vsys; see Table 1) is close to the barycentric Earth radial velocity (BERV), the stellar and telluric lines can overlap, making the correction less effective. If this overlap occurs at multiple epochs, the RV time series is offset and imprinted with the harmonics of the Earth’s orbital period (365.24days). This BERV overlap phenomenon and ways to mitigate it were explored in detail in more recent works (Srivastava et al. 2026; Frensch et al. 2026; Parc et al. 2025) and are described in Sect. 4.2. Alternatively, the NIRPS spectra can be extracted and processed using the APERO framework (Cook et al. 2022), which yielded results consistent with NIRPS DRS-3.2.0. We therefore chose to use the NIRPS DRS-3.2.0 data for our analysis.
The final RV extraction used the line-by-line (LBL; v0.65.001) framework (Artigau et al. 2022), which has been demonstrated to work effectively in the NIR (e.g. Suárez Mascareño et al. 2025; Donati et al. 2025). Since TOI-4552 is faint, it would be challenging to create a high-S/N template for the RV calculation inside the LBL algorithm. We therefore instead constructed the template from 111 NIRPS observations of GJ 643, which is much brighter (V = 11.73, J = 7.55) and similar in spectral type (M4.5V) to TOI-4552. The LBL reported a median RV uncertainty per exposure (σRV) for TOI-4552 of 7.7 m/s, with a root mean square (RMS) of 9.2 m/s. A total of nine exposures of TOI-4552 acquired on 15 April 2023, 17 April 2023, 29 July 2024, 23 August 2024, 19 September 2024, 12 October 2024 and 24 October 2024 were excluded from the final analysis, corresponding to low-S/N outliers (σRV > 14 m/s) attributed to poor observing conditions.
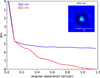 |
Fig. 3 High-contrast image of TOI-4552 using Zorro at Gemini-S (Scott et al. 2021; Howell et al. 2025) in the two simultaneous channels (562 nm and 832 nm) as a function of on-sky separation. Four nights of observations were combined here. The 5σ contrast curve shows no evidence that neighbours or companions contaminate the signal. |
Stellar parameters for TOI-4552.
2.7 HARPS velocimetry
By design, NIRPS observations are simultaneously accompanied by HARPS, and together, they provide full coverage of the VIS and NIR wavelength ranges. An instrumental problem with the HARPS-EGGS mode fibre shutter forced us to split the 59 HARPS measurements into EGGS (37 observations, λ/∆λ = 80 000), and HAM (22 observations, λ/∆λ = 115 000) instrument modes. As a result of the high magnitude (V = 14.44) and late stellar type (M4.5V), HARPS was unable to produce high-quality radial-velocity measurements. We used the standard template-matching algorithm sBART (Silva et al. 2022)3 to obtain the RVs because it has been optimised and tested extensively on HARPS datasets. For EGGS mode observations, σRV is 9.5 m/s, with an RMS of 27.9 m/s, while the uncertainties on the HAM mode were three times larger. Therefore, we only used the HARPS-EGGS observations in our final analysis. The observations from the nights of 15 April 2023 and 17 April 2023 were rejected because the corresponding nights were flagged and removed from the NIRPS time series. The final RV time series for NIRPS and HARPS is provided in Table A.1.
3 Stellar characterisation of TOI-4552
3.1 Empirically derived stellar parameters
We derived the stellar radius of TOI-4552 using its empirical relation with the Ks absolute magnitude from Mann et al. (2015) for M dwarfs, adopting the Ks magnitudes reported by 2MASS (Skrutskie et al. 2006) and the distance from Gaia DR3 parallax measurements (Gaia Collaboration 2023). This yielded a radius of R* = 0.2869 ± 0.0088 R⊙. Similarly, the stellar mass was estimated using the empirical M* - Ks relation from Mann et al. (2019), giving M* = 0.2619 ± 0.0063 M⊙. From these values, we computed the surface gravity (log g* = 4.940 ± 0.028 cm s−2) and stellar luminosity (L* = 0.00836 ± 0.0013 L⊙). The effective temperature (Teff = 3258 ± 115 K) used in the luminosity calculation was obtained through spectroscopic analysis combined with SED fitting (see Sects. 3.3 and 3.2). All uncertainties were propagated using a Monte Carlo approach, and the final stellar bulk parameters are summarised in Table 1.
3.2 Spectral energy distribution fit
The stellar parameters were also derived by fitting a spectral energy distribution (SED) to multi-band photometry using the Virtual Observatory Spectral Analyzer (VOSA) tool (Bayo et al. 2008). The observational data included fluxes from the GBP, G, and GRP bands from the Gaia mission (Gaia Collaboration 2018), B and V from APASS (Henden et al. 2015), g′, r′, and i′ from the SDSS Catalogue, release 12 (Alam et al. 2015), J, H, and Ks from 2MASS (Skrutskie et al. 2006), and W1, W2, W3, and W4 from the WISE mission (Wright et al. 2010). VOSA performs a χ2 minimisation between the observational data and synthetic SEDs from theoretical models, including BT-Settl (Allard et al. 2012), Kurucz (Kurucz 1993), and Castelli & Kurucz (Castelli & Kurucz 2003). The model that provided the best fit was the BT-Settl model with Teff = 3300 ± 50 K, metallicity [M/H] = 0.0 dex, and surface gravity log(g) = 5.0 dex (cm s−2). The fit accounted for the observed and theoretical fluxes, their errors, the number of data points, and the object distance and radius. The resulting SED is presented in Fig. 4.
The bolometric luminosity was obtained by integrating the SED, giving L* = 0.00770 ± 0.00003 L⊙. By using the Stefan-Boltzmann law, we obtained the stellar radius R* = 0.268 ± 0.008 R⊙. Finally, the stellar mass (M* =0.259 ± 0.012 M⊙) was estimated using Eq. (6) from Schweitzer et al. (2019).
A comparison between the empirically computed stellar properties and those from the SED fit is listed in Table 2. The mass and radius of the star agree within 1σ between the two methods. Because the uncertainties were lower, we adopted the empirically derived stellar parameters (Table 1).
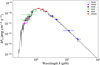 |
Fig. 4 Spectral energy distribution of TOI-4552. The best-fitting BT-Settl model (Allard et al. 2012) for parameters Teff = 3300K, [M/H] =0 dex, and log g* = 5.0 dex is shown by the black curve. The photometric data from APASS (magenta), Gaia (green), 2MASS (red), SDSS (black), and WISE (blue) are plotted with horizontal error bars indicating the filter passbands. |
TOI-4552 stellar parameters derived by different methods.
3.3 HARPS stellar analysis
To derive stellar parameters with the HARPS optical spectrum, we first combined the 33 HARPS-EGGS spectra reduced with the ESPRESSO DRS-3.2.5 pipeline (Pepe et al. 2021) repurposed to work on HARPS data (and corrected for their RV) by using the task scombine within IRAF4 to obtain a high-S/N spectrum. Then, we applied the machine-learning tool ODUSSEAS5 (Antoniadis-Karnavas et al. 2020, 2024) to derive the effective temperature (Teff) and metallicity ([Fe/H]) from the pseudo-equivalent widths (EWs) of a set of ~4000 lines in the optical spectra. This tool applies a machine-learning model trained with the same lines measured and calibrated in a reference sample of 47 M dwarfs observed with HARPS, whose [Fe/H] were obtained from photometric calibrations (Neves et al. 2012) and the Teff from interferometric calibrations (Khata et al. 2021). Using this method, we derived a Teff = 3323 ± 101 K and [Fe/H] = 0.00 ± 0.12 dex. The same process was repeated for the same HARPS spectra reduced by the offline DRS-3.5 pipeline as well, which yielded Teff = 3247 ± 96K and [Fe/H] = 0.01 ± 0.11.
The HARPS Teff values agree with the value obtained from the SED fit and with the value reported by TESS DVR (Teff = 3265 ± 157 K). To accommodate the large uncertainties of each measurement, we combined the four estimates of the effective temperature by performing a Gaussian resampling by assuming a normal distribution for all four Teff centred at the reported value and the uncertainty as the standard deviation. At each step, we drew one value from each distribution, averaged the values, and repeated this for 10000 iterations. The median and 1σ scatter of the resulting distribution give our final value of Teff = 3258 ± 115 K. In this way, we inflated the uncertainty in Teff to account for any biases that might affect the uncertainties in the values reported for the four sources.
TOI-4552 stellar abundances measured with NIRPS.
3.4 NIRPS stellar analysis
The stellar elemental abundances were derived from the NIRPS spectra following the method of Gromek et al. (in prep.), based on the work of Hejazi et al. (2023), and they are summarised in Table 3. We performed a spectral synthesis analysis using the order-merged telluric-corrected NIRPS template spectrum calculated within the LBL framework. Synthetic spectra were generated with MARCS stellar atmosphere models (Gustafsson et al. 2008) and the turbospectrum radiative transfer code (Alvarez & Plez 1998; Plez 2012), implemented via modified iSpec routines (Blanco-Cuaresma 2019; Blanco-Cuaresma et al. 2014) using solar abundances from Asplund et al. (2009). The stellar parameters adopted to generate the model spectra were Teff = 3258 ± 115 K, vmac = 4 ± 2.25 km s−1, and vmic = 0.75 ± 0.5 kms−1. The macroturbulence (vmac) and microturbulence (vmic) velocities were determined through χ2-minimisation of molecular OH lines, which are especially sensitive to these broadening parameters (Souto et al. 2017; Hejazi et al. 2023). Absorption lines were selected from the normalised spectrum, cross-referenced with atomic and molecular features in the VALD line list (Kupka et al. 2011), and further refined via visual inspection to exclude blended or contaminated features. The oxygen abundance was derived from OH features.
Synthetic spectra were generated for each line by varying the elemental abundance [X/H] between −0.75 and +0.75 dex in 0.25 dex steps that were then interpolated to 0.015 dex resolution. Best-fit abundances were obtained via χ2 minimisation between the model and observed spectrum within a fitting window. For certain lines for which the continuum level between the model and the spectra did not match, we fitted and applied a uniform flux offset that minimised the χ2 between the observed data and the model in the continuum region within 0.5 nm of the spectral line. The final abundances for each element were calculated as weighted averages of the individual abundances, with the weighting equal to the RMSE between the best-fit model and the observed line in each line region, divided by the line depth. Random uncertainties (σran ) were calculated as the standard deviation of the line-by-line abundance distribution divided by  , where N is the number of lines used per element. Systematic uncertainties due to Teff, [M/H], log gt, vmac, and vmic were estimated by independently resampling each stellar parameter from its Gaussian uncertainty distribution and repeating the analysis over 15 iterations (Hejazi et al. 2023). The total uncertainty was computed by summing the random and systematic components in quadrature. The global metallicity and α-enhancement was recomputed following Hinkel et al. (2022), yielding [M/H] = −0.01 ±0.07 dex from the summed number ratios of O, Na, Mg, Si, K, Ca, Ti, Cr, Mn, and Fe, and [α/Fe] =0.06±0.12 using the α-elements O, Mg, Si, Ca, and Ti. The final stellar abundance measurements and parameters are reported in Tables 1 and 3.
It should be noted that the best-fit SED model of BT-Settl agrees with the spectroscopically derived Teff and [M/H] values for TOI-4552. We report the values inferred from spectroscopic observations in Table 1.
3.5 Stellar activity
To constrain any potential stellar activity signals, we analysed the spectroscopic activity indicators in the NIRPS RV computed in the standard LBL reduction framework, namely the differential temperature metric (∆T; Artigau et al. 2024) and the second-order derivative of the velocity (D2V; Zechmeister et al. 2018; Artigau et al. 2022). Figure B.2 shows the time series for the two indicators and the respective Lomb-Scargle periodogram. No significant peaks are detected above the 99.9% confidence level on a short timescale, apart from aliases of the one-day RV sampling. For long-term monitoring, we detected no significant trends in the TESS SAP light curve. However, we only have three sectors of photometric data, each separated by two years, so the sampling is insufficient to identify any definitive variability. As an alternative, we obtained the publicly available photometric measurements from the All-Sky Automated Survey for Supernovae (ASAS-SN; Kochanek et al. 2017) Sky Patrol V2.06 (Hart et al. 2023; Shappee et al. 2014). These observations were made using the V- and g′-band filters and are displayed in Fig. B.1 along with the periodogram. The highest detected peak is at 765 days (slightly above the 99.99% confidence level), a possible signature of magnetic activity, as can be the case in late-M dwarfs (Suárez Mascareño et al. 2016). However, it is of note that this period is very close to the two year harmonic of the Earth’s orbital period and is thus likely an artefact of the window function. We conclude that TOI-4552 is a quiet star, and no significant short-term stellar rotation period is detected in the RVs and TESS photometry. No obvious magnetic cycle is detected in long-term photometry either.
4 Transit and radial velocity analysis
4.1 Transit light-curve analysis
TOI-4552 was observed in three TESS sectors (12, 39, and 66) and monitored from the ground with ExTrA, LCO, and SPECULOOS. No additional transiting candidates or signatures of transit-timing variations (TTVs) were observed in our transit sample, making TOI-4552 b the only detected short-period transiting planet in the system. We first retrieved the TESS light curves using lightkurve (Lightkurve Collaboration 2018)7. While these PDCSAP light curves were corrected for instrumental systematics, we observed additional residual correlated structures that might affect the retrieved planetary radius. We therefore used a Gaussian process (GP) with the Matern-3/2 kernel approximation implemented in celerite (Foreman-Mackey et al. 2017) available natively in juliet to further detrend the light curves. The following formalism for the term was used:
 (1)
(1)
where α is the amplitude β is the length scale, and τ is the time lag. To prevent the GP from fitting the USP transits, we restricted the lower limit of the length scale to be one day. The same GP kernel was used inside Allesfitter to detrend the SPECU-LOOS light curves (e.g. Dransfield et al. 2024; Henderson et al. 2024) and ExTrA light curves (e.g. Cointepas et al. 2021). The LCO light curves were detrended at the extraction phase via the AstroImageJ software.
Using preliminary period and time of conjugation measurements reported by SPOC (Porb = 0.3011 days; tc = 2459361.8822BJD), we performed transit fits using juliet (Espinoza et al. 2019) to ensure that the retrieved radii of the planet were consistent between instruments using stellar parameters from Table 1. The two-coefficient limb-darkening formalism from Kipping (2013) was used, and both coefficients were fit individually for each instrument. All three TESS sectors (12, 39, and 66) were modelled as independent instruments to incorporate their separate GP fits, light curves from LCO-CTIO and LCO-SAAO were modelled separately, all three ExTrA telescopes (ExTrA1, ExTrA2, ExTrA3) were modelled separately, and each of the SPECULOOS telescopes and the various combinations of photometric filters (Europa-g′, Europa-r′, Ganymede-r′, Io-g′, and Io-r′, Io-z′) were modelled as different instruments. Table 4 highlights the transit depth (δ) and planetary radius (Rp) obtained for each individual instrument and the number of total transits observed, which all agree within a 2σ uncertainty. It should be noted that no additional dilution correction was applied to the extracted light curves at this point. The same Porb and tc were later used as priors in the joint fit with RVs (see Sect. 4.4).
TOI-4552 b radius derived from transit lightcurves of each individual instrument.
4.2 Radial velocity analysis: BERV overlap
The Earth’s atmosphere is not as transparent in the NIR as in the VIS wavelength range. Telluric absorption and emission features pollute the entire NIR coverage of NIRPS, and while we have methods for correcting them (Srivastava et al. 2026; Allart et al. 2022; Cook et al. 2022), they are not perfect and might leave some residuals that are anchored in the Earth’s rest frame. The previously mentioned BERV crossing phenomenon occurs due to these anchored residuals. Following the procedure explored in Srivastava et al. (2026), we performed a post-processing reduction to mask any pixels in all observations of TOI-4552 that varied in flux beyond a 2.5σ threshold relative to the median stellar spectrum. The value for this threshold is partly arbitrary and may not be optimal for other targets. It depends on the S/N of the science observation and the efficiency of the telluric absorption and emission corrections. This aggressive masking of pixels aimed to remove telluric residuals at the expense of RV precision. An obvious signature of the dataset being contaminated by telluric residuals is the presence of harmonics of the Earth’s orbital period (365.24/n days) in the periodogram. Throughout the development and testing phase of this post-processing tool, we analysed the effect of differing thresholds on the RV time series (Fig. 5). The 2.5σ threshold was found to be optimal, as it reduced the power of the peaks associated with harmonics of Earth’s orbital period to below the 0.01% false-alarm probability (FAP; 99.99% confidence) in the periodogram.
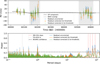 |
Fig. 5 NIRPS RV time series of TOI-4552 (top) along with the corresponding periodograms (bottom). We present here the unmasked (Residual uncorrected) and masked (Residual corrected) time series at 4σ and 2.5σ thresholds, along with their corresponding periodograms. The telluric residual corrected time series (green) is adopted for our final analysis. |
4.3 Radial velocity analysis: Gaussian process detrending
We also explored alternative methods to correct for the effects of telluric residuals, including the use of a Gaussian Process (GP) to detrend for the systematics. While GP hyperparameters can have a physical interpretation (Stock et al. 2023), we used it to model systematics, and we therefore chose a kernel and priors for the hyperparameters to avoid overfitting the data. We again used the Mateŕn-3/2 kernel approximation available in juliet (see Sect. 4.1 for more details). The GP was applied to two datasets, one dataset that was not corrected for the telluric residuals (blue points in Fig. 5), and the other dataset was corrected for these features (green points in Fig. 5). The various models and their results are displayed in Table 5.
When we did not correct for the BERV overlap systematics and then fitted the GP and planet together with wide priors, the detection of the planet is not significant and is statistically similar to the GP-only fit, according to the interpretation of the ∆ logZ (Kass & Raftery 1995). Although we corrected for the BERV overlap to the best of our ability, some minor correlated noise might remain in the RV time series. To account for this, we tried to fit the planet with and without a GP, and the scenario of a GP + planet fit was more statistically favoured (Table 5). This highlights that identifying the cause and correcting for the systematics is a necessary step. For this fit, the Porb, tc, and instrumental white-noise jitter (σw) were fit as free parameters following their prior distributions used in the joint fit (see Sect. 4.4, Table B.1). We note that for the purpose of the model comparison, the results in the table reflect the various models that were only fit on the RV data. After we identified the best model (GP + planet on the telluric-residual-corrected time series), we used it in combination with the transit data to obtain the final parameters we detail in the next section.
4.4 Joint fit
As with the transit photometry analysis, we used juliet for the joint fit. Table B.1 features all the parameters, priors, and posteriors we used for the analysis. The segregation of photometric instruments was the same as in Sect. 4.1. Since the ExTrA light curves were ensured to be free of any dilution and contamination effects during the extraction and detrending process, the dilution factor was fit to be unity for this dataset. For all other photometric data, we allowed the dilution factor to vary between 0.5 and 1. While TESS SPOC does correct for dilution, as mentioned previously, we decided to allow a variable dilution factor to account for any imperfections. We fit a two coefficient limb-darkening model implemented in juliet (Espinoza & Jordán 2016) using the formalism presented in Kipping (2013) for each individual telescope. The posteriors are only poorly constrained, but they are consistent within the uncertainties of the instruments. The stellar density was calculated using the stellar mass and radius from Table 1, and we used the parametrisation suggested in Espinoza (2018) for the planetary radius and impact parameter. We additionally fixed the eccentricity to e = 0 and the argument of periastron to ω = 90° as the close proximity to the host star almost guarantees a tidally locked non-eccentric orbit (e.g. Lyu et al. 2024). To lower the computational load, the fit was performed using detrended ExtrA, LCO, and SPECULOOS light curves, while the TESS data were detrended simultaneously with the joint fit using the same kernel as described before (Sect. 4.1). As justified in Sect. 3.5, there are no indications of any shortterm stellar activity to be fit in our data; therefore, we only used a GP to model any minor systematics, as detailed in Sect. 4.3. An excess white-noise jitter was fit for NIRPS and HARPS separately as the instrument performances vary significantly.
To run our one-planet model with 94 parameters, we used the built-in dynamic-dynesty sampler in juliet with 10000 live points to prevent undersampling. A final planetary radius of 1.11 ± 0.04 R⊕ was obtained, corresponding to a transit depth of 1258 ± 55 ppm, consistent with measurements from individual photometric instruments (see Table 4). The derived RV semiamplitude of 4.32 ± 1.08 m/s corresponds to a mass of 1.83 ± 0.47 M⊕, which is a mass precision of 25% (3.9σ). The priors and posteriors for the final fit are presented in Table B.1. While we used HARPS in our final analysis, the solution is primarily driven by NIRPS (see Fig. 6). This highlights the advantage of NIR velocimetry for M dwarf targets.
Comparing the relative Bayesian evidence (∆logZ) between various models used to remove systematics from the radial velocity timeseries.
5 Discussion
5.1 TOI-4552 b composition and core mass fraction
TOI-4552 b is the eleventh rocky USP around an M dwarf star to have a constrained mass and radius measurement. The other ten (TOI-6255 b (Dai et al. 2024), GJ 367 b (Lam et al. 2021), GJ 1252 b (Shporer et al. 2020),Wolf 327 b (Murgas et al. 2024), TOI-1685 b (Hirano et al. 2021; Bluhm et al. 2021; Burt et al. 2024), LTT 3780 b (Cloutier et al. 2020), GJ 806 b (Palle et al. 2023), TOI-1634 b (Hirano et al. 2021), TOI-1075 b (Essack et al. 2023), and TOI-6324 b (Lee et al. 2025) along with TOI-4552 b are presented in the mass-radius diagram (Fig. 7), with the Earthlike, silicate-rich, and pure iron composition lines taken from Zeng et al. (2019). The masses and radii were taken from the most recent publication after a query search on the NASA Exoplanet Archive8 (Christiansen et al. 2025) for planets with an orbital period of P < 1 day, a radius of R < 2 R⊕, a reported mass, and a host start effective temperature of Teff < 4000 K. Other USPs orbiting FGK stars are also plotted in grey to provide a comparison to the M dwarf sample.
Using the final planetary mass and radius, we derived a bulk density of 7.74±2.12g/cm3, which is higher but within 1σ of that of the Earth (ρ⊕ = 5.51 g/cm3). Most USPs around M dwarfs fall into either Earth-like or silicate-rich composition categories; however, GJ 367 b (Mp = 0.63M⊕; Rp = 0.69R⊕) stands out as distinctly rich in iron. In our own Solar System, Mercury is the prime example of a rocky planet with an overabundance of iron compared to Venus, Earth, and Mars. Accordingly, planets such as GJ 367 b are often referred to as super-Mercuries. According to the location in the mass-radius diagram, the composition of TOI-4552 b lies between those of the Earth and Mercury, similar to several other USPs around FGK stars.
To better quantify the composition of TOI-4552 b, we computed an interior structure model using the publicly available code exopie9 (Plotnykov & Valencia 2024), which is an updated version of the previous code SUPEREARTH (Plotnykov & Valencia 2020; Valencia et al. 2006). The core mass fraction (CMF) quantifies the proportion of the total mass of a planet that is contained in its core, and it thereby reflects the relative abundances of iron and silicates, of which the core and mantle are primarily composed, respectively. We first ran exopie assuming a completely rocky planet without a water mass fraction and a variable (0-20%) amount of iron in the mantle and silicon in the core. The planetary mass and radius were used as priors, and no constraints were placed on the composition using stellar abundance measurements (Table 3). The results can be found in the corner plot of Fig. C.1. The sampler converged on mass and radius values that were within 1σ of our measurements. The resultant CMF of 0.54 is higher than
that of the Earth (CMF⊕ = 0.33) and lower than that of Mercury (CMFMercury = 0.7; Szurgot 2015), but it is consistent within the uncertainties. Another relevant metric is the uncompressed density of a planet, which is a measure of the mean density at zero pressure (Faure & Mensing 2007). Again using exopie, we calculated the uncompressed density of TOI-4552 b (ρuncom) to be 4.84±0.70g/cm3, which lies partway between that of the Earth (ρuncom,Earth = 4.4 g/cm3) and Mercury (ρuncom,Mercury = 5.3 g/cm3; Prentice & Jontof-Hutter 2005,) but is consistent with both.
A common assumption when constraining planetary composition is that because a planet and its host star form from the same interstellar medium, the planetary refractory elemental abundances should reflect those of its star (Dorn et al. 2015; Hinkel & Unterborn 2018). However, some recent works have questioned the validity of this assumption (Santos et al. 2017; Plotnykov & Valencia 2020; Brinkman et al. 2024) because observations suggest that refractory ratios of rocky worlds span a wider range than the ratios of stars. Given the slightly high CMF of TOI-4552b, we also ran a second exopie model that did not use the planetary mass and radius as priors. Instead, we adopted the host star abundance ratios ([Fe/H], [Mg/H], and [Si/H]) to predict the composition of a representative rocky planet formed around this star. Since the [Mg/H] and [Si/H] calculations were made using one and two spectral lines, respectively, we instead used [a/H] as a proxy for both since they are α-elements. The result (Fig. C.2) suggests a planet with CMF = 0.32 , which is just within 1σ of the CMF constrained by the mass and radius. The CMF is not constrained well enough to conclude whether TOI-4552 b is an iron-rich super-Mercury or an Earth-like rocky world because both are statistically plausible based on the current dataset.
The formation and evolution pathways of Mercury-like exoplanets remain uncertain. Some hypotheses, such as that they are remnants of stripped gas giants (Lin et al. 2025) or products of giant impacts (Bonomo et al. 2019; Cambioni et al. 2024), are considered unlikely, while other studies (Brinkman et al. 2024) found no compelling evidence for the existence of super-Mercuries at all, although GJ 367 b appears to be a strong candidate. It lies close to the iron sequence of the mass-radius diagram (see Fig. 7). Based on planet formation simulations, Mah & Bitsch (2023) proposed that super-Mercuries are more likely to form around stars with low Mg/Si ratios (< 1), which agrees with large uncertainties with the value derived from the stellar spectrum analysis of TOI-4552 (Mg/Si = 0.62 , Table 1).
We note that Brinkman et al. (2025) reanalysed the systems Kepler-100b (Weiss et al. 2024) and HD 93963Ab (Serrano et al. 2022) using additional RV measurements from MAROON-X (Seifahrt et al. 2018) and KPF (Gibson et al. 2016). The authors concluded that the earlier classification of these planets as superMercuries was driven by low-precision mass measurements and that with the higher-precision data, the inferred CMFs are instead consistent with Earth-like values. Given the modest 3.9σ mass detection, we cannot exclude that the mass of TOI-4552 b is slightly overestimated; the masses of several planets were revised downward as more precise RV measurements became available (e.g. LHS 1140 b; Cadieux et al. 2024), as was the case for the several USPs mentioned prior (Brinkman et al. 2025). We thus conclude that despite the high density, more precise RV measurements are required to confirm or refute the status of TOI-4552 b as a super-Mercury.
The relatively high density of TOI-4552 b might simply reflect an underestimated radius. A recent study (Han et al. 2025) argued that TESS radii are underestimated relative to K2/Kepler on average because the large TESS pixels can bias the dilution correction. This explanation seems unlikely for TOI-4552. The planetary radii inferred from the dilution-corrected TESS photometry and from ground-based observatories agree within the uncertainties (see Table 4). Additionally, our final radius of 1.11 ±0.04 R⊕ was calculated by allowing the dilution factor for the photometric data to be a varying parameter.
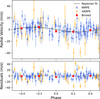 |
Fig. 6 Top : NIRPS RV measurements (blue points) and the final fit Keplerian model (grey line), phase-folded according to P and tc in Table 6. The red points correspond to the binned RVs. Bottom : residuals of the RVs after subtracting the model. |
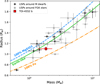 |
Fig. 7 Mass-radius diagram of all rocky USPs (Rp < 2R⊕, P < 1 day) around M dwarfs (Teff < 4000 K) and FGK stars that currently have a measured mass and radius. All planet parameters were obtained through a query search on NASA Exoplanet Archive. Silicate-rich (blue), Earthlike (green), and iron-rich (orange) composition lines, taken from Zeng et al. (2019), are overplotted. According to the measured mass and radius, TOI-4552 b lies in the gap between the Earth-like and pure iron composition lines. A more precise mass measurement is required to obtain better constraints on the composition. |
5.2 Potential tidal and rotational deformation
Since USPs are very close to their host stars, the levels of tidal deformation in these rocky plants might be significant. TOI-6255 b (Dai et al. 2024) is one such USP on the verge of tidal disruption. Based on the equations presented in Dai et al. (2024), a similar analysis can be performed for TOI-4552 b. As defined in Rappaport et al. (2013), the Roche period (PRoche) is the lower limit for the orbital period before the planet is tidally disrupted. The equation
 (2)
(2)
approximates the Roche period (in hours) based on the planetary bulk density (ρP). For TOI-4552b, PRoche is 4.5 h. Since the orbital period (7.2 h) is longer, TOI-4552 b is likely not on the verge of tidal disruption. Furthermore, Eqs. (4), (10), and (11) in Dai et al. (2024) can be used to estimate the fractional change in the radius of TOI-4552 b that is due to rotational deformation, which can be probed during planetary transit. This change in radius is approximately 2.8%. The current precision of the planetary radius is about 4%, and this deformational change therefore cannot be accurately measured using the current dataset.
Planetary parameters for TOI-4552 b.
5.3 Prospects for JWST observations
Characterising hot rocky planets has become a defining JWST effort that is reflected in focused studies (e.g. Diamond-Lowe et al. 2021; Luque et al. 2025) and in the ongoing 500-hour Rocky Worlds survey (Redfield et al. 2024). Because their orbital periods are shorter than one day, USPs are optimal targets for observation and analysis while minimising the required telescope time. Some USPs orbiting M dwarfs have already been observed with JWST or future observations are planned: TOI-1685b (GO3263, GO4098, GO4195; Luque et al. 2025), TOI-6255b (GO8864), GJ 367 b (GO2508; Zhang et al. 2024), LHS 3844 b (GO1846, GO4008, GO7953), and LTT 3780 b (GO3730). TOI-4552 b joins this short list of coveted USPs for follow-up observations. The orbital period of TOI-4552 b is the third shortest (comparable to those of TOI-6255 b and GJ 367 b), and the high emission spectroscopic metric (ESM; Kempton et al. 2018) of 19.5 (Table 6, Fig. 8) makes it a favourable USP for emission spectroscopy studies.
The leading theory of planet formation states that the primordial H2/He atmospheres of close-in rocky planets were irradiated away by the strong X-ray/UV radiation from their M-type host stars, making a CO2/CO dominated secondary atmosphere the likely scenario (Wordsworth & Kreidberg 2022). No positive atmospheric detections of such worlds have been made so far (Kane et al. 2020; Zhang et al. 2024; Luque et al. 2025); nevertheless, recent JWST results indicate a possible CO2/CO atmosphere due to vaporised surface SiO2 around 55 Cnc e (Hu et al. 2024; Zilinskas et al. 2025).
Formation theories additionally suggest that terrestrial planets begin as molten rocks that cool down on a geological timescale. The time it takes to solidify the molten interior can range from 100 Myr (Hamano et al. 2013; Boukaré et al. 2025) to 10 Gyr (Driscoll & Barnes 2015), depending on the proximity to the host star and the orbital eccentricity of the planet. The dayside temperature of TOI-4552 b is Tday = 1434 K, calculated using a heat redistribution factor of f = 2/3 following equations from López-Morales & Seager (2007); Morris et al. (2022). This temperature is too low to sustain a surface magma ocean (Elkins-Tanton 2012). However, the close-in orbit (a = 0.0056 AU) and any orbital eccentricity, despite the short circularisation timescale of tcirc = 0.25 Myr (Heller et al. 2010; Rodríguez Martínez et al. 2023), would subject it to extreme levels of tidal forces, resulting in a molten mantle, leading to a higher nightside temperature (Henning et al. 2009; Driscoll & Barnes 2015; Herath et al. 2024; Boukaré et al. 2025). This change in the nightside temperature can be probed through the shape of the phase curve, and a non-zero orbital eccentricity could be measured using mid-eclipse timing. Assuming a solid mantle and no internal heating, we predict Tnight = 707 K. Any significant deviations from this value (within the uncertainties) could have implications for our understanding of the evolution of such extreme rocky worlds.
In light of recent research related to the characterisation of the surface material components of rocky planets with MIRI (Hu et al. 2012; Paragas et al. 2025), TOI-4552 b is a prime candidate for a phase-curve study with MIRI following the recommendation by Hammond et al. (2025). Phase curves are inherently immune to the major drawbacks of transit and secondary-eclipse-only observations such as the transit light source (TLS; Rackham et al. 2018) effect and missing the transit/eclipse due to unconstrained orbital parameters. In addition, they provide a longer stable baseline for accurately detecting any secondary eclipse or transit features. USPs constitute an attractive subclass of rocky planets that enables full phase-curve measurements with a relatively modest observing time investment. Obtaining a phase curve encompassing one transit and two eclipses would constitute an optimal strategy that would be a stable baseline for the full dataset.
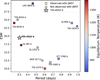 |
Fig. 8 Emission spectroscopic metric (ESM) vs. period plot of all currently detected transiting rocky USPs around M dwarfs with a constrained mass and radius. LHS 3844 b is plotted as well although no published mass is available because it is one of the most extensively studied USPs (Kreidberg et al. 2019). The ESMs for all planets were taken from the respective discovery publications. The colour bar indicates the equilibrium temperature, and planets that have already been observed with JWST are marked as squares. TOI-4552 b has an ESM of 19.5 and is the third shortest period, making it a high-value target for emission spectroscopy. |
6 Summary and conclusion
We presented the result of the NIRPS-GTO SP2 programme and confirmed that the planetary signal around the mid-M dwarf TOI-4552. TOI-4552b is an Earth-sized (Rp = 1.11 ± 0.04 R⊕) planet, as inferred from photometric light curves from TESS, ExTrA, SPECULOOS, and LCO observatories. Our radial velocity analysis, which is primarily driven by NIRPS and corroborated by HARPS, yielded a mass of 1.83 ± 0.47 M⊕ that corresponds to a bulk density of ρp = 7.74 ± 2.12 g/cm3 and is marginally higher than the Earth’s. Spectroscopy and short- and long-term photometry showed no indication of stellar activity, and we therefore suggest that TOI-4552 is a quiet star.
Based on the planetary mass and radius, we ran an interior structure model using exopie, which favoured a CMF of 0.54 that is partway between an Earth-like and super-Mercury composition. Additional RV measurements with greater precision (e.g. with ESPRESSO) are needed to make a definitive conclusion regarding the composition of TOI-4552 b.
With recent works focused on investigating exoplanet surface geology using JWST (e.g. Hu et al. 2012; Paragas et al. 2025), TOI-4552 b emerges as an excellent candidate. Its high emission spectroscopy metric (ESM = 19.5), likely circular orbit, ultra-short period (0.3011 days), and quiet host star make it a particularly favourable target for atmospheric and surface composition characterisation with JWST.
Data availability
Full Table A.1 is available at the CDS via https://cdsarc.cds.unistra.fr/viz-bin/cat/J/A+A/709/A73
Acknowledgements
RD, ÉA, CC, BB, PL, AL & JPW acknowledge the financial support of the FRQ-NT through the Centre de recherche en astrophysique du Québec as well as the support from the Trottier Family Foundation and the Trottier Institute for Research on Exoplanets. RD & ÉA acknowledges support from Canada Foundation for Innovation (CFI) program, the Université de Montréal and Université Laval, the Canada Economic Development (CED) program and the Ministere of Economy, Innovation and Energy (MEIE). ED-M, SCB, EC & NCS acknowledge the support from FCT - Fun-dação para a Ciência e a Tecnologia through national funds by these grants: UIDB/04434/2020, UIDP/04434/2020. ED-M further acknowledges the support from FCT through Stimulus FCT contract 2021.01294.CEECIND. ED-M acknowledges the support by the Ramón y Cajal contract RyC2022-035854-I funded by MICIU/AEI/10.13039/501100011033 and by ESF+. The Board of Observational and Instrumental Astronomy (NAOS) at the Federal University of Rio Grande do Norte’s research activities are supported by continuous grants from the Brazilian funding agency CNPq. This study was partially funded by the Coordenação de Aperfeiçoamento de Pessoal de Nível Superior—Brasil (CAPES) — Finance Code 001 and the CAPES-Print program. 0 XB, XDe & TF acknowledge funding from the French ANR under contract number ANR24CE493397 (ORVET), and the French National Research Agency in the framework of the Investissements d’Avenir program (ANR-15-IDEX-02), through the funding of the “Origin of Life″ project of the Grenoble-Alpes University. SCB acknowledges the support from Fundaçâo para a Ciência e Tecnologia (FCT) in the form of a work contract through the Scientific Employment Incentive program with reference 2023.06687.CEECIND. NBC acknowledges support from an NSERC Discovery Grant, a Canada Research Chair, and an Arthur B. McDonald Fellowship, and thanks the Trottier Space Institute for its financial support and dynamic intellectual environment. XDu acknowledges the support from the European Research Council (ERC) under the European Union’s Horizon 2020 research and innovation programme (grant agreement SCORE No 851555) and from the Swiss National Science Foundation under the grant SPECTRE (No 200021_215200). This work has been carried out within the framework of the NCCR PlanetS supported by the Swiss National Science Foundation under grants 51NF40_182901 and 51NF40_205606. DE acknowledge support from the Swiss National Science Foundation for project 200021_200726. The authors acknowledge the financial support of the SNSF. JIGH, ASM, RR & AKS acknowledge financial support from the Spanish Ministry of Science, Innovation and Universities (MICIU) projects PID2020-117493GB-I00 and PID2023-149982NB-I00. ICL acknowledges CNPq research fellowships (Grant No. 313103/2022-4). BLCM acknowledge CAPES postdoctoral fellowships. BLCM acknowledges CNPq research fellowships (Grant No. 305804/2022-7). JRM acknowledges CNPq research fellowships (Grant No. 308928/2019-9). CM acknowledges the funding from the Swiss National Science Foundation under grant 200021_204847 “PlanetsInTime”. Co-funded by the European Union (ERC, FIERCE, 101052347). Views and opinions expressed are however those of the author(s) only and do not necessarily reflect those of the European Union or the European Research Council. Neither the European Union nor the granting authority can be held responsible for them. GAW is supported by a Discovery Grant from the Natural Sciences and Engineering Research Council (NSERC) of Canada. We acknowledge funding from the European Research Council under the ERC Grant Agreement n. 337591-ExTrA. AL acknowledges support from the Fonds de recherche du Québec (FRQ) -Secteur Nature et technologies under file #349961. KAM acknowledges support from the Swiss National Science Foundation (SNSF) under the Postdoc Mobility grant P500PT_230225. AKS acknowledges financial support from La Caixa Foundation (ID 100010434) under the grant LCF/BQ/DI23/11990071. Based on data collected by the SPECULOOS consortium. The ULiege’s contribution to SPECULOOS has received funding from the European Research Council under the European Union’s Seventh Framework Programme (FP/2007-2013) (grant Agreement n° 336480/SPECULOOS), from the Balzan Prize and Francqui Foundations, from the Belgian Scientific Research Foundation (F.R.S.-FNRS; grant n° T.0109.20), from the University of Liege, and from the ARC grant for Concerted Research Actions financed by the Wallonia-Brussels Federation. This work is supported by a grant from the Simons Foundation (PI Queloz, grant number 327127). This research is in part funded by the European Union’s Horizon 2020 research and innovation program (grants agreements n° 803193/BEBOP), and from the Science and Technology Facilities Council (STFC; grant n° ST/S00193X/1, and ST/W000385/1)/ This research has made use of the NASA Exoplanet Archive, which is operated by the California Institute of Technology, under contract with the National Aeronautics and Space Administration under the Exoplanet Exploration Program. We acknowledge the use of public TESS data from pipelines at the TESS Science Office and at the TESS Science Processing Operations Center. Resources supporting this work were provided by the NASA High-End Computing (HEC) Program through the NASA Advanced Supercomputing (NAS) Division at Ames Research Center for the production of the SPOC data products.
References
- Alam, S., Albareti, F. D., Allende Prieto, C., et al. 2015, ApJS, 219, 12 [Google Scholar]
- Allard, F., Homeier, D., & Freytag, B. 2012, Philos. Trans. Roy. Soc. Lond. Ser. A, 370, 2765 [NASA ADS] [Google Scholar]
- Allart, R., Lovis, C., Faria, J., et al. 2022, A&A, 666, A196 [NASA ADS] [CrossRef] [EDP Sciences] [Google Scholar]
- Aller, A., Lillo-Box, J., Jones, D., Miranda, L. F., & Barceló Forteza, S. 2020, A&A, 635, A128 [NASA ADS] [CrossRef] [EDP Sciences] [Google Scholar]
- Alvarez, R., & Plez, B. 1998, A&A, 330, 1109 [NASA ADS] [Google Scholar]
- Antoniadis-Karnavas, A., Sousa, S. G., Delgado-Mena, E., et al. 2020, A&A, 636, A9 [NASA ADS] [CrossRef] [EDP Sciences] [Google Scholar]
- Antoniadis-Karnavas, A., Sousa, S. G., Delgado-Mena, E., Santos, N. C., & Andreasen, D. T. 2024, A&A, 690, A58 [NASA ADS] [CrossRef] [EDP Sciences] [Google Scholar]
- Artigau, É., Cadieux, C., Cook, N. J., et al. 2022, AJ, 164, 84 [NASA ADS] [CrossRef] [Google Scholar]
- Artigau, É., Cadieux, C., Cook, N. J., et al. 2024, AJ, 168, 252 [Google Scholar]
- Asplund, M., Grevesse, N., Sauval, A. J., & Scott, P. 2009, ARA&A, 47, 481 [NASA ADS] [CrossRef] [Google Scholar]
- Bayo, A., Rodrigo, C., Barrado Y Navascués, D., et al. 2008, A&A, 492, 277 [NASA ADS] [CrossRef] [EDP Sciences] [Google Scholar]
- Blanco-Cuaresma, S. 2019, MNRAS, 486, 2075 [Google Scholar]
- Blanco-Cuaresma, S., Soubiran, C., Heiter, U., & Jofré, P. 2014, iSpec: Stellar atmospheric parameters and chemical abundances, Astrophysics Source Code Library [record ascl:1409.006] [Google Scholar]
- Bluhm, P., Pallé, E., Molaverdikhani, K., et al. 2021, A&A, 650, A78 [NASA ADS] [CrossRef] [EDP Sciences] [Google Scholar]
- Bochanski, J. J., Hawley, S. L., Covey, K. R., et al. 2010, AJ, 139, 2679 [NASA ADS] [CrossRef] [Google Scholar]
- Bonfils, X., Delfosse, X., Udry, S., et al. 2013, A&A, 549, A109 [NASA ADS] [CrossRef] [EDP Sciences] [Google Scholar]
- Bonfils, X., Almenara, J. M., Jocou, L., et al. 2015, SPIE Conf. Ser., 9605, 96051L [NASA ADS] [Google Scholar]
- Bonomo, A. S., Zeng, L., Damasso, M., et al. 2019, Nat. Astron., 3, 416 [Google Scholar]
- Bouchy, F., Doyon, R., Artigau, É., et al. 2017, The Messenger, 169, 21 [NASA ADS] [Google Scholar]
- Bouchy, F., Doyon, R., Pepe, F., et al. 2025, A&A, 700, A10 [NASA ADS] [CrossRef] [EDP Sciences] [Google Scholar]
- Boukaré, C.-É., Lemasquerier, D., Cowan, N. B., et al. 2025, Nat. Astron., 9, 1511 [Google Scholar]
- Brinkman, C. L., Polanski, A. S., Huber, D., et al. 2024, AJ, 168, 281 [Google Scholar]
- Brinkman, C. L., Weiss, L. M., Huber, D., et al. 2025, AJ, 170, 109 [Google Scholar]
- Brown, T. M., Baliber, N., Bianco, F. B., et al. 2013, PASP, 125, 1031 [Google Scholar]
- Burt, J. A., Hooton, M. J., Mamajek, E. E., et al. 2024, ApJ, 971, L12 [NASA ADS] [CrossRef] [Google Scholar]
- Cadieux, C., Plotnykov, M., Doyon, R., et al. 2024, ApJ, 960, L3 [NASA ADS] [CrossRef] [Google Scholar]
- Cambioni, S., Weiss, B. P., Asphaug, E., et al. 2024, in LPI Contributions, 3040, 55th Lunar and Planetary Science Conference, 1360 [Google Scholar]
- Castelli, F., & Kurucz, R. L. 2003, in IAU Symposium, 210, Modelling of Stellar Atmospheres, eds. N. Piskunov, W. W. Weiss, & D. F. Gray, A20 [Google Scholar]
- Castro-González, A., Lillo-Box, J., Armstrong, D. J., et al. 2024, A&A, 691, A233 [NASA ADS] [CrossRef] [EDP Sciences] [Google Scholar]
- Chabrier, G. 2001, ApJ, 554, 1274 [NASA ADS] [CrossRef] [Google Scholar]
- Christiansen, J. L., McElroy, D. L., Harbut, M., et al. 2025, Planet. Sci. J., 6, 186 [Google Scholar]
- Cloutier, R., Eastman, J. D., Rodriguez, J. E., et al. 2020, AJ, 160, 3 [Google Scholar]
- Cloutier, R., Charbonneau, D., Stassun, K. G., et al. 2021, AJ, 162, 79 [NASA ADS] [CrossRef] [Google Scholar]
- Cointepas, M., Almenara, J. M., Bonfils, X., et al. 2021, A&A, 650, A145 [NASA ADS] [CrossRef] [EDP Sciences] [Google Scholar]
- Collins, K. 2019, in American Astronomical Society Meeting Abstracts, 233, 140.05 [Google Scholar]
- Collins, K. A., Kielkopf, J. F., Stassun, K. G., & Hessman, F. V. 2017, AJ, 153, 77 [Google Scholar]
- Cook, N. J., Artigau, É., Doyon, R., et al. 2022, PASP, 134, 114509 [NASA ADS] [CrossRef] [Google Scholar]
- Dai, F., Howard, A. W., Halverson, S., et al. 2024, AJ, 168, 101 [NASA ADS] [CrossRef] [Google Scholar]
- Dawson, R. I., & Fabrycky, D. C. 2010, ApJ, 722, 937 [Google Scholar]
- Delrez, L., Gillon, M., Queloz, D., et al. 2018, SPIE Conf. Ser., 10700, 107001I [Google Scholar]
- Diamond-Lowe, H., Youngblood, A., Charbonneau, D., et al. 2021, AJ, 162, 10 [NASA ADS] [CrossRef] [Google Scholar]
- Donati, J. F., Cristofari, P. I., Moutou, C., et al. 2025, A&A, 700, A227 [NASA ADS] [CrossRef] [EDP Sciences] [Google Scholar]
- Dorn, C., Khan, A., Heng, K., et al. 2015, A&A, 577, A83 [NASA ADS] [CrossRef] [EDP Sciences] [Google Scholar]
- Dransfield, G., Timmermans, M., Triaud, A. H. M. J., et al. 2024, MNRAS, 527, 35 [Google Scholar]
- Dressing, C. D., & Charbonneau, D. 2015, ApJ, 807, 45 [Google Scholar]
- Driscoll, P. E., & Barnes, R. 2015, Astrobiology, 15, 739 [NASA ADS] [CrossRef] [Google Scholar]
- Elkins-Tanton, L. T. 2012, Annu. Rev. Earth Planet. Sci., 40, 113 [CrossRef] [Google Scholar]
- Espinoza, N. 2018, RNAAS, 2, 209 [Google Scholar]
- Espinoza, N., & Jordán, A. 2016, MNRAS, 457, 3573 [NASA ADS] [CrossRef] [Google Scholar]
- Espinoza, N., Kossakowski, D., & Brahm, R. 2019, MNRAS, 490, 2262 [Google Scholar]
- Essack, Z., Shporer, A., Burt, J. A., et al. 2023, AJ, 165, 47 [NASA ADS] [CrossRef] [Google Scholar]
- Faure, G., & Mensing, T. M. 2007, Introduction to Planetary Science: The Geological Perspective (Berlin: Springer) [Google Scholar]
- Foreman-Mackey, D., Agol, E., Ambikasaran, S., & Angus, R. 2017, AJ, 154, 220 [Google Scholar]
- Frensch, Y. G. C., Bouchy, F., Lo Curto, G., et al. 2026, A&A, 707, A73 [NASA ADS] [CrossRef] [EDP Sciences] [Google Scholar]
- Gagné, J., Mamajek, E. E., Malo, L., et al. 2018, ApJ, 856, 23 [Google Scholar]
- Gaia Collaboration (Brown, A. G. A., et al.) 2018, A&A, 616, A1 [NASA ADS] [CrossRef] [EDP Sciences] [Google Scholar]
- Gaia Collaboration (Vallenari, A., et al.) 2023, A&A, 674, A1 [NASA ADS] [CrossRef] [EDP Sciences] [Google Scholar]
- Galletta, G., Colombo, S., Prisinzano, L., & Micela, G. 2025, A&A, 698, A180 [NASA ADS] [CrossRef] [EDP Sciences] [Google Scholar]
- Gardner, J. P., Mather, J. C., Clampin, M., et al. 2006, Space Sci. Rev., 123, 485 [Google Scholar]
- Gardner, J. P., Mather, J. C., Abbott, R., et al. 2023, PASP, 135, 068001 [NASA ADS] [CrossRef] [Google Scholar]
- Gibson, S. R., Howard, A. W., Marcy, G. W., et al. 2016, SPIE Conf. Ser., 9908, 990870 [Google Scholar]
- Gillis, E., Cloutier, R., & Pass, E. 2026, arXiv e-prints [arXiv:2602.23364] [Google Scholar]
- Guerrero, N. M., Seager, S., Huang, C. X., et al. 2021, ApJS, 254, 39 [NASA ADS] [CrossRef] [Google Scholar]
- Günther, M. N., & Daylan, T. 2021, ApJS, 254, 13 [CrossRef] [Google Scholar]
- Gustafsson, B., Edvardsson, B., Eriksson, K., et al. 2008, A&A, 486, 951 [NASA ADS] [CrossRef] [EDP Sciences] [Google Scholar]
- Hamano, K., Abe, Y., & Genda, H. 2013, Nature, 497, 607 [NASA ADS] [CrossRef] [Google Scholar]
- Hammond, M., Guimond, C. M., Lichtenberg, T., et al. 2025, ApJ, 978, L40 [Google Scholar]
- Han, T., Robertson, P., Brandt, T. D., et al. 2025, ApJ, 988, L4 [Google Scholar]
- Hart, K., Shappee, B. J., Hey, D., et al. 2023, arXiv e-prints [arXiv:2304.03791] [Google Scholar]
- Hejazi, N., Crossfield, I. J. M., Nordlander, T., et al. 2023, ApJ, 949, 79 [CrossRef] [Google Scholar]
- Heller, R., Jackson, B., Barnes, R., Greenberg, R., & Homeier, D. 2010, A&A, 514, A22 [NASA ADS] [CrossRef] [EDP Sciences] [Google Scholar]
- Henden, A. A., Levine, S., Terrell, D., & Welch, D. L. 2015, in American Astronomical Society Meeting Abstracts, 225, 336.16 [Google Scholar]
- Henderson, B. A., Casewell, S. L., Goad, M. R., et al. 2024, MNRAS, 530, 318 [NASA ADS] [Google Scholar]
- Henning, W. G., O’Connell, R. J., & Sasselov, D. D. 2009, ApJ, 707, 1000 [Google Scholar]
- Herath, M., Boukaré, C.-É., & Cowan, N. B. 2024, MNRAS, 535, 2404 [Google Scholar]
- Hinkel, N. R., & Unterborn, C. T. 2018, ApJ, 853, 83 [NASA ADS] [CrossRef] [Google Scholar]
- Hinkel, N. R., Young, P. A., & Wheeler, III, C. H. 2022, AJ, 164, 256 [Google Scholar]
- Hirano, T., Livingston, J. H., Fukui, A., et al. 2021, AJ, 162, 161 [NASA ADS] [CrossRef] [Google Scholar]
- Howell, S. B., Martínez-Vázquez, C. E., Furlan, E., et al. 2025, Front. Astron. Space Sci., 12, 1608411 [Google Scholar]
- Hu, R., Ehlmann, B. L., & Seager, S. 2012, ApJ, 752, 7 [NASA ADS] [CrossRef] [Google Scholar]
- Hu, R., Bello-Arufe, A., Zhang, M., et al. 2024, Nature, 630, 609 [NASA ADS] [CrossRef] [Google Scholar]
- Jenkins, J. M., Twicken, J. D., McCauliff, S., et al. 2016, SPIE Conf. Ser., 9913, 99133E [Google Scholar]
- Kane, S. R., Roettenbacher, R. M., Unterborn, C. T., Foley, B. J., & Hill, M. L. 2020, Planet. Sci. J., 1, 36 [Google Scholar]
- Kass, R. E., & Raftery, A. E. 1995, J. Am. Statist. Assoc., 90, 773 [CrossRef] [Google Scholar]
- Kempton, E. M. R., Bean, J. L., Louie, D. R., et al. 2018, PASP, 130, 114401 [Google Scholar]
- Khata, D., Mondal, S., Das, R., & Baug, T. 2021, MNRAS, 507, 1869 [NASA ADS] [CrossRef] [Google Scholar]
- Kipping, D. M. 2013, MNRAS, 435, 2152 [Google Scholar]
- Kochanek, C. S., Shappee, B. J., Stanek, K. Z., et al. 2017, PASP, 129, 104502 [Google Scholar]
- Kreidberg, L., Koll, D. D. B., Morley, C., et al. 2019, Nature, 573, 87 [NASA ADS] [CrossRef] [Google Scholar]
- Kupka, F., Dubernet, M. L., & VAMDC Collaboration. 2011, Baltic Astron., 20, 503 [Google Scholar]
- Kurucz, R. L. 1993, SYNTHE spectrum synthesis programs and line data (Smithsonian Astrophysical Observatory) [Google Scholar]
- Lam, K. W. F., Csizmadia, S., Astudillo-Defru, N., et al. 2021, Science, 374, 1271 [NASA ADS] [CrossRef] [Google Scholar]
- Lee, R. A., Dai, F., Howard, A. W., et al. 2025, ApJ, 983, L36 [Google Scholar]
- Lightkurve Collaboration (Cardoso, J. V. d. M., et al.) 2018, Lightkurve: Kepler and TESS time series analysis in Python, Astrophysics Source Code Library [record ascl:1812.013] [Google Scholar]
- Lin, Z., Cambioni, S., & Seager, S. 2025, ApJ, 978, L41 [Google Scholar]
- López-Morales, M., & Seager, S. 2007, ApJ, 667, L191 [CrossRef] [Google Scholar]
- Luque, R., Coy, B. P., Xue, Q., et al. 2025, AJ, 170, 49 [Google Scholar]
- Lyu, X., Koll, D. D. B., Cowan, N. B., et al. 2024, ApJ, 964, 152 [Google Scholar]
- Mah, J., & Bitsch, B. 2023, A&A, 673, A17 [NASA ADS] [CrossRef] [EDP Sciences] [Google Scholar]
- Mann, A. W., Feiden, G. A., Gaidos, E., Boyajian, T., & von Braun, K. 2015, ApJ, 804, 64 [Google Scholar]
- Mann, A. W., Dupuy, T., Kraus, A. L., et al. 2019, ApJ, 871, 63 [Google Scholar]
- Mayor, M., Pepe, F., Queloz, D., et al. 2003, The Messenger, 114, 20 [NASA ADS] [Google Scholar]
- McArthur, B. E., Endl, M., Cochran, W. D., et al. 2004, ApJ, 614, L81 [Google Scholar]
- McCully, C., Volgenau, N. H., Harbeck, D.-R., et al. 2018, SPIE Conf. Ser., 10707, 107070K [Google Scholar]
- Mignon, L., Meunier, N., Delfosse, X., et al. 2023, A&A, 675, A168 [NASA ADS] [CrossRef] [EDP Sciences] [Google Scholar]
- Morris, B. M., Heng, K., Jones, K., et al. 2022, A&A, 660, A123 [NASA ADS] [CrossRef] [EDP Sciences] [Google Scholar]
- Morris, R. L., Twicken, J. D., Smith, J. C., et al. 2020, Kepler Data Processing Handbook: Photometric Analysis, Kepler Science Document KSCI-19081-003, id. 6, ed. J. M. Jenkins [Google Scholar]
- Murgas, F., Pallé, E., Orell-Miquel, J., et al. 2024, A&A, 684, A83 [NASA ADS] [CrossRef] [EDP Sciences] [Google Scholar]
- Neves, V., Bonfils, X., Santos, N. C., et al. 2012, A&A, 538, A25 [NASA ADS] [CrossRef] [EDP Sciences] [Google Scholar]
- Palle, E., Orell-Miquel, J., Brady, M., et al. 2023, A&A, 678, A80 [NASA ADS] [CrossRef] [EDP Sciences] [Google Scholar]
- Paragas, K., Knutson, H. A., Hu, R., et al. 2025, ApJ, 981, 130 [Google Scholar]
- Parc, L., Bouchy, F., Cook, N. J., et al. 2025, A&A, 702, A138 [NASA ADS] [CrossRef] [EDP Sciences] [Google Scholar]
- Pepe, F., Cristiani, S., Rebolo, R., et al. 2021, A&A, 645, A96 [NASA ADS] [CrossRef] [EDP Sciences] [Google Scholar]
- Plez, B. 2012, Turbospectrum: Code for spectral synthesis, Astrophysics Source Code Library [record ascl:1205.004] [Google Scholar]
- Plotnykov, M., & Valencia, D. 2020, MNRAS, 499, 932 [CrossRef] [Google Scholar]
- Plotnykov, M., & Valencia, D. 2024, MNRAS, 530, 3488 [Google Scholar]
- Prentice, A. J. R., & Jontof-Hutter, D. 2005, Highlights Astron., 13, 73 [Google Scholar]
- Rackham, B. V., Apai, D., & Giampapa, M. S. 2018, ApJ, 853, 122 [Google Scholar]
- Rajpurohit, A. S., Kumar, V., Srivastava, M. K., et al. 2025, A&A, 704, A154 [NASA ADS] [CrossRef] [EDP Sciences] [Google Scholar]
- Rappaport, S., Sanchis-Ojeda, R., Rogers, L. A., Levine, A., & Winn, J. N. 2013, ApJ, 773, L15 [NASA ADS] [CrossRef] [Google Scholar]
- Redfield, S., Batalha, N., Benneke, B., et al. 2024, arXiv e-prints [arXiv:2404.02932] [Google Scholar]
- Ricker, G. R., Winn, J. N., Vanderspek, R., et al. 2015, J. Astron. Telesc. Instrum. Syst., 1, 014003 [Google Scholar]
- Rodríguez Martínez, R., Gaudi, B. S., Schulze, J. G., et al. 2023, AJ, 165, 97 [Google Scholar]
- Roettenbacher, R. M., & Kane, S. R. 2017, ApJ, 851, 77 [Google Scholar]
- Santos, N. C., Adibekyan, V., Dorn, C., et al. 2017, A&A, 608, A94 [NASA ADS] [CrossRef] [EDP Sciences] [Google Scholar]
- Schweitzer, A., Passegger, V. M., Cifuentes, C., et al. 2019, A&A, 625, A68 [NASA ADS] [CrossRef] [EDP Sciences] [Google Scholar]
- Scott, N. J., Howell, S. B., Gnilka, C. L., et al. 2021, Front. Astron. Space Sci., 8, 138 [NASA ADS] [CrossRef] [Google Scholar]
- Seifahrt, A., Stürmer, J., Bean, J. L., & Schwab, C. 2018, SPIE Conf. Ser., 10702, 107026D [NASA ADS] [Google Scholar]
- Serrano, L. M., Gandolfi, D., Hoyer, S., et al. 2022, A&A, 667, A1 [Google Scholar]
- Shappee, B. J., Prieto, J. L., Grupe, D., et al. 2014, ApJ, 788, 48 [Google Scholar]
- Shporer, A., Collins, K. A., Astudillo-Defru, N., et al. 2020, ApJ, 890, L7 [Google Scholar]
- Silva, A. M., Faria, J. P., Santos, N. C., et al. 2022, A&A, 663, A143 [NASA ADS] [CrossRef] [EDP Sciences] [Google Scholar]
- Skrutskie, M. F., Cutri, R. M., Stiening, R., et al. 2006, AJ, 131, 1163 [NASA ADS] [CrossRef] [Google Scholar]
- Smith, J. C., Stumpe, M. C., Van Cleve, J. E., et al. 2012, PASP, 124, 1000 [Google Scholar]
- Souto, D., Cunha, K., García-Hernández, D. A., et al. 2017, ApJ, 835, 239 [Google Scholar]
- Srivastava, A., Bouchy, F., & Doyon, R. 2026, A&A, submitted [Google Scholar]
- Stassun, K. G., Oelkers, R. J., Paegert, M., et al. 2019, AJ, 158, 138 [Google Scholar]
- Stock, S., Kemmer, J., Kossakowski, D., et al. 2023, A&A, 674, A108 [NASA ADS] [CrossRef] [EDP Sciences] [Google Scholar]
- Stumpe, M. C., Smith, J. C., Van Cleve, J. E., et al. 2012, PASP, 124, 985 [Google Scholar]
- Stumpe, M. C., Smith, J. C., Catanzarite, J. H., et al. 2014, PASP, 126, 100 [Google Scholar]
- Suárez Mascareño, A., Rebolo, R., & González Hernández, J. I. 2016, A&A, 595, A12 [Google Scholar]
- Suárez Mascareño, A., Artigau, É., Mignon, L., et al. 2025, A&A, 700, A11 [NASA ADS] [CrossRef] [EDP Sciences] [Google Scholar]
- Szurgot, M. 2015, in LPI Contributions, 1839, Comparative Tectonic and Geodynamics of Venus, Earth and Rocky Exoplanets, ed. LPI Editorial Board, 5001 [Google Scholar]
- Twicken, J. D., Clarke, B. D., Bryson, S. T., et al. 2010, SPIE Conf. Ser., 7740, 774023 [NASA ADS] [Google Scholar]
- Twicken, J. D., Catanzarite, J. H., Clarke, B. D., et al. 2018, PASP, 130, 064502 [Google Scholar]
- Valencia, D., O’Connell, R. J., & Sasselov, D. 2006, Icarus, 181, 545 [Google Scholar]
- Weiss, L. M., Isaacson, H., Howard, A. W., et al. 2024, ApJS, 270, 8 [NASA ADS] [CrossRef] [Google Scholar]
- Wordsworth, R., & Kreidberg, L. 2022, ARA&A, 60, 159 [NASA ADS] [CrossRef] [Google Scholar]
- Wright, E. L., Eisenhardt, P. R. M., Mainzer, A. K., et al. 2010, AJ, 140, 1868 [Google Scholar]
- Zechmeister, M., Reiners, A., Amado, P. J., et al. 2018, A&A, 609, A12 [NASA ADS] [CrossRef] [EDP Sciences] [Google Scholar]
- Zeng, L., Jacobsen, S. B., Sasselov, D. D., et al. 2019, Proc. Natl. Acad. Sci. U.S.A., 116, 9723 [Google Scholar]
- Zhang, M., Hu, R., Inglis, J., et al. 2024, ApJ, 961, L44 [NASA ADS] [CrossRef] [Google Scholar]
- Zilinskas, M., van Buchem, C. P. A., Zieba, S., et al. 2025, A&A, 697, A34 [NASA ADS] [CrossRef] [EDP Sciences] [Google Scholar]
IRAF is distributed by National Optical Astronomy Observatories, operated by the Association of Universities for Research in Astronomy, Inc., under contract with the National Science Foundation, USA.
Appendix A Supplementary data
The TESS target pixel files with the major contamination sources are depicted in Fig. A.1. Ground based photometric phasefolded lightcurves are shown in Fig. A.2. Table A.1 provides the HAPRS and NIRPS timeseries corrected for tellurics used in this analysis.
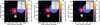 |
Fig. A.1 TESS target pixel file of TOI-4552 from sectors 12 (left), 39 (centre) and 66 (right), created with TESS-cont (Castro-González et al. 2024). The aperture mask is highlighted in red and the pixel size is 21″. TOI-4552 is highlighted in white with the mesh pattern. The heatmap depicts the per-pixel relative flux contributed by TOI-4552, used to optimise the aperture mask. The five stars that contaminate the lightcurve of TOI-4552 the most are highlighted, with the size of the source being a relative measure of the contamination. The TESS SPOC lightcurves are already corrected for the dilution effect from these five sources. |
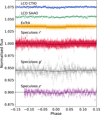 |
Fig. A.2 Ground based photometry of TOI-4552 separated by instruments and photometric bands. All lightcurves are phasefolded to reflect the transit feature. Any offsets in the normalised flux axis are purely to represent all datasets within the same plot and are not representative of instrument-relative flux. |
Radial velocity timeseries of NIRPS and HARPS used for the analysis (corrected for BERV crossing systematics).
Appendix B Stellar activity and joint fit table
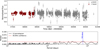 |
Fig. B.1 Long-term photometric monitoring of TOI-4552 done as part of the ASAS-SN survey (Kochanek et al. 2017). The data was recorded in the V and g photometric bands. The periodogram peaks at a signal of 765 days, very close to the two year harmonic of Earth’s orbital period, and likely an artifact of the window function. No other significant peaks are present that can be attributed to stellar rotation or magnetic cycle, thus TOI-4552 is a quiet star. |
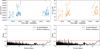 |
Fig. B.2 Left: Second-order derivative of the velocity (top) and its respective periodogram (bottom). Right: Differential temperature metric (top) and its periodogram (bottom). Both quantities are stellar activity indicators reported as part of the standard LBL RV extraction process (Artigau et al. 2022, 2024) for NIRPS and show no clear peaks in the periodogram that might correspond to any activity signal. |
Median values and 68% confidence intervals of the posterior distributions of the joint fit.
Appendix C TOI-4552 b interior structure modelling
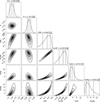 |
Fig. C.1 Corner plot depicting the interior structure model of TOI-4552b using exopie (Plotnykov & Valencia 2024) with the planetary mass and radius as priors. The abundance of iron in the mantle and silicon in the core is left to vary freely between 0 and 20%. The resulting CMF of 0.54 is partway between that of Mercury (= 0.7; Szurgot 2015) and Earth (= 0.33), suggesting a marginal over-abundance of iron (also evident from the high iron mass fraction, Fe-MF). |
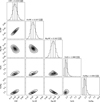 |
Fig. C.2 Corner plot of an alternative interior structure model illustrating the expected planetary properties under the assumption that the refractory element abundances of the planet match those of the host star. Therefore, only the stellar element abundances ([Fe/H], [Mg/H] and [Si/H]) were input as parameters, with [α/H] used as a proxy for [Mg/H] and [Si/H] due to very few lines used in the abundance measurements for those elements. No constraints were put on planetary mass and radius. The expected CMF for a rocky planet around TOI-4552 is 0.32, consistent with that of the Earth. This is just within the lower uncertainty bound predicted by the interior model constrained by the mass and radius measurements (CMF = 0.54$$; Section 5.1; Fig C.1). |
All Tables
TOI-4552 b radius derived from transit lightcurves of each individual instrument.
Comparing the relative Bayesian evidence (∆logZ) between various models used to remove systematics from the radial velocity timeseries.
Radial velocity timeseries of NIRPS and HARPS used for the analysis (corrected for BERV crossing systematics).
Median values and 68% confidence intervals of the posterior distributions of the joint fit.
All Figures
|
Fig. 1 Target pixel file of TOI-4552 for TESS sector 12, created using tpfplotter (Aller et al. 2020). The pixels (21″ pixel scale) outlined in orange correspond to the aperture mask used to extract the SAP flux for the light curve. All Gaia DR3 (Gaia Collaboration 2023) sources in the field are numbered, with 1 marking TOI-4552. The size of the red circles represents the TESS magnitude of the stars relative to TOI-4552. Since it is a crowded field, TESS SPOC provides light curves corrected for the dilution caused by the strongest contaminants. Figure A.1 shows the TPF of all three sectors with the primary contaminants. |
| In the text | |
|
Fig. 2 TESS transit light curves from sectors 12, 39, and 66. The normalised flux (blue points) and the Gaussian process (GP) model (orange) used to detrend the light curve is plotted on the left. The phase-folded light curves centred on the transit of TOI-4552 b, the transit model (dashed black line), the binned flux (red points), and the residuals after fitting for the transit are plotted on the right for each sector. Sectors 12 and 39 were observed by TESS at a 2-minute cadence, whereas sector 66 was observed at a 20-second cadence. Since TOI-4552 b is a USP, we chose to keep the high cadence of sector 66 to provide a better sampling at the expense of lower precision. |
| In the text | |
|
Fig. 3 High-contrast image of TOI-4552 using Zorro at Gemini-S (Scott et al. 2021; Howell et al. 2025) in the two simultaneous channels (562 nm and 832 nm) as a function of on-sky separation. Four nights of observations were combined here. The 5σ contrast curve shows no evidence that neighbours or companions contaminate the signal. |
| In the text | |
|
Fig. 4 Spectral energy distribution of TOI-4552. The best-fitting BT-Settl model (Allard et al. 2012) for parameters Teff = 3300K, [M/H] =0 dex, and log g* = 5.0 dex is shown by the black curve. The photometric data from APASS (magenta), Gaia (green), 2MASS (red), SDSS (black), and WISE (blue) are plotted with horizontal error bars indicating the filter passbands. |
| In the text | |
|
Fig. 5 NIRPS RV time series of TOI-4552 (top) along with the corresponding periodograms (bottom). We present here the unmasked (Residual uncorrected) and masked (Residual corrected) time series at 4σ and 2.5σ thresholds, along with their corresponding periodograms. The telluric residual corrected time series (green) is adopted for our final analysis. |
| In the text | |
|
Fig. 6 Top : NIRPS RV measurements (blue points) and the final fit Keplerian model (grey line), phase-folded according to P and tc in Table 6. The red points correspond to the binned RVs. Bottom : residuals of the RVs after subtracting the model. |
| In the text | |
|
Fig. 7 Mass-radius diagram of all rocky USPs (Rp < 2R⊕, P < 1 day) around M dwarfs (Teff < 4000 K) and FGK stars that currently have a measured mass and radius. All planet parameters were obtained through a query search on NASA Exoplanet Archive. Silicate-rich (blue), Earthlike (green), and iron-rich (orange) composition lines, taken from Zeng et al. (2019), are overplotted. According to the measured mass and radius, TOI-4552 b lies in the gap between the Earth-like and pure iron composition lines. A more precise mass measurement is required to obtain better constraints on the composition. |
| In the text | |
|
Fig. 8 Emission spectroscopic metric (ESM) vs. period plot of all currently detected transiting rocky USPs around M dwarfs with a constrained mass and radius. LHS 3844 b is plotted as well although no published mass is available because it is one of the most extensively studied USPs (Kreidberg et al. 2019). The ESMs for all planets were taken from the respective discovery publications. The colour bar indicates the equilibrium temperature, and planets that have already been observed with JWST are marked as squares. TOI-4552 b has an ESM of 19.5 and is the third shortest period, making it a high-value target for emission spectroscopy. |
| In the text | |
|
Fig. A.1 TESS target pixel file of TOI-4552 from sectors 12 (left), 39 (centre) and 66 (right), created with TESS-cont (Castro-González et al. 2024). The aperture mask is highlighted in red and the pixel size is 21″. TOI-4552 is highlighted in white with the mesh pattern. The heatmap depicts the per-pixel relative flux contributed by TOI-4552, used to optimise the aperture mask. The five stars that contaminate the lightcurve of TOI-4552 the most are highlighted, with the size of the source being a relative measure of the contamination. The TESS SPOC lightcurves are already corrected for the dilution effect from these five sources. |
| In the text | |
|
Fig. A.2 Ground based photometry of TOI-4552 separated by instruments and photometric bands. All lightcurves are phasefolded to reflect the transit feature. Any offsets in the normalised flux axis are purely to represent all datasets within the same plot and are not representative of instrument-relative flux. |
| In the text | |
|
Fig. B.1 Long-term photometric monitoring of TOI-4552 done as part of the ASAS-SN survey (Kochanek et al. 2017). The data was recorded in the V and g photometric bands. The periodogram peaks at a signal of 765 days, very close to the two year harmonic of Earth’s orbital period, and likely an artifact of the window function. No other significant peaks are present that can be attributed to stellar rotation or magnetic cycle, thus TOI-4552 is a quiet star. |
| In the text | |
|
Fig. B.2 Left: Second-order derivative of the velocity (top) and its respective periodogram (bottom). Right: Differential temperature metric (top) and its periodogram (bottom). Both quantities are stellar activity indicators reported as part of the standard LBL RV extraction process (Artigau et al. 2022, 2024) for NIRPS and show no clear peaks in the periodogram that might correspond to any activity signal. |
| In the text | |
|
Fig. C.1 Corner plot depicting the interior structure model of TOI-4552b using exopie (Plotnykov & Valencia 2024) with the planetary mass and radius as priors. The abundance of iron in the mantle and silicon in the core is left to vary freely between 0 and 20%. The resulting CMF of 0.54 is partway between that of Mercury (= 0.7; Szurgot 2015) and Earth (= 0.33), suggesting a marginal over-abundance of iron (also evident from the high iron mass fraction, Fe-MF). |
| In the text | |
|
Fig. C.2 Corner plot of an alternative interior structure model illustrating the expected planetary properties under the assumption that the refractory element abundances of the planet match those of the host star. Therefore, only the stellar element abundances ([Fe/H], [Mg/H] and [Si/H]) were input as parameters, with [α/H] used as a proxy for [Mg/H] and [Si/H] due to very few lines used in the abundance measurements for those elements. No constraints were put on planetary mass and radius. The expected CMF for a rocky planet around TOI-4552 is 0.32, consistent with that of the Earth. This is just within the lower uncertainty bound predicted by the interior model constrained by the mass and radius measurements (CMF = 0.54$$; Section 5.1; Fig C.1). |
| In the text | |
Current usage metrics show cumulative count of Article Views (full-text article views including HTML views, PDF and ePub downloads, according to the available data) and Abstracts Views on Vision4Press platform.
Data correspond to usage on the plateform after 2015. The current usage metrics is available 48-96 hours after online publication and is updated daily on week days.
Initial download of the metrics may take a while.