Fig. 2
Download original image
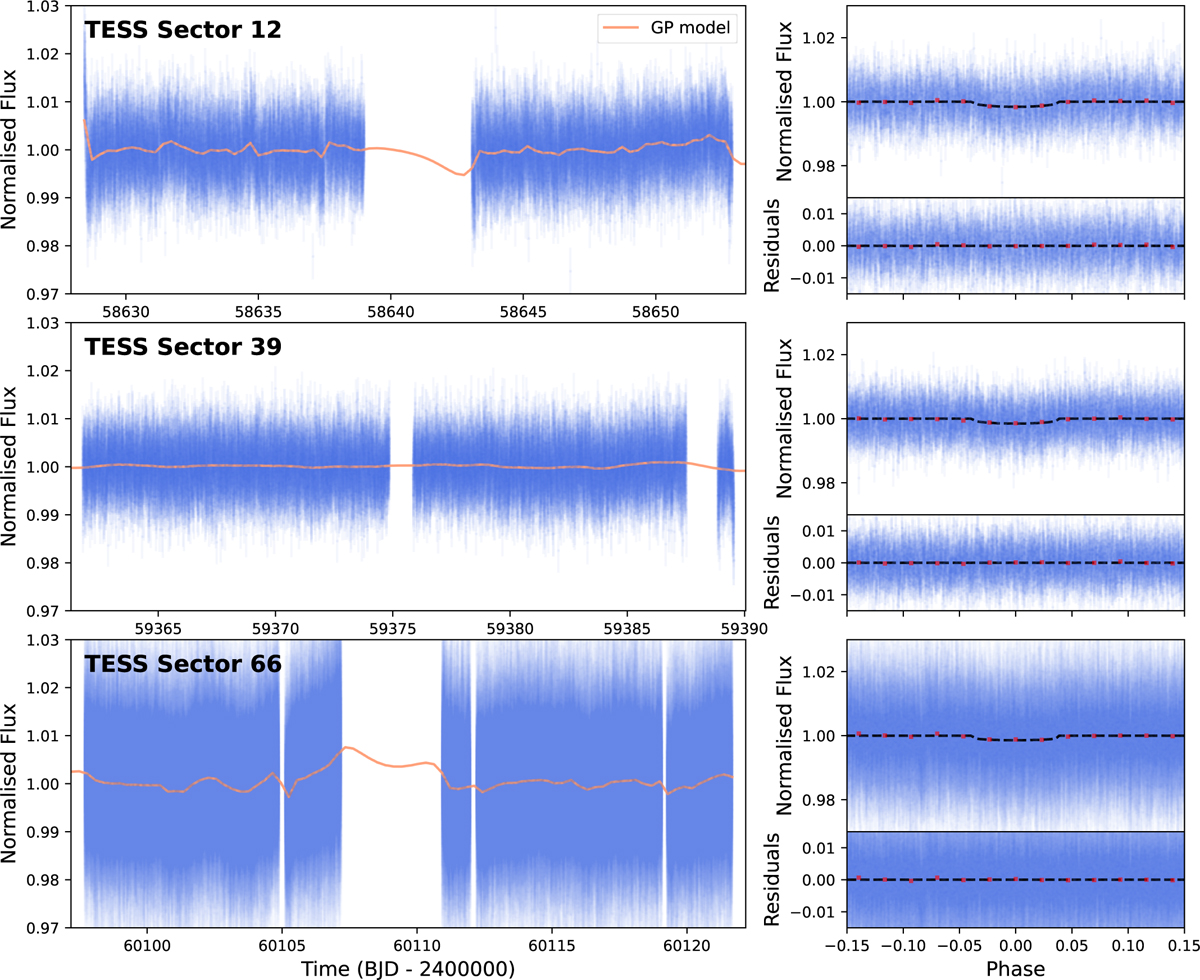
TESS transit light curves from sectors 12, 39, and 66. The normalised flux (blue points) and the Gaussian process (GP) model (orange) used to detrend the light curve is plotted on the left. The phase-folded light curves centred on the transit of TOI-4552 b, the transit model (dashed black line), the binned flux (red points), and the residuals after fitting for the transit are plotted on the right for each sector. Sectors 12 and 39 were observed by TESS at a 2-minute cadence, whereas sector 66 was observed at a 20-second cadence. Since TOI-4552 b is a USP, we chose to keep the high cadence of sector 66 to provide a better sampling at the expense of lower precision.
Current usage metrics show cumulative count of Article Views (full-text article views including HTML views, PDF and ePub downloads, according to the available data) and Abstracts Views on Vision4Press platform.
Data correspond to usage on the plateform after 2015. The current usage metrics is available 48-96 hours after online publication and is updated daily on week days.
Initial download of the metrics may take a while.