| Issue |
A&A
Volume 708, April 2026
|
|
|---|---|---|
| Article Number | L18 | |
| Number of page(s) | 8 | |
| Section | Letters to the Editor | |
| DOI | https://doi.org/10.1051/0004-6361/202659083 | |
| Published online | 17 April 2026 | |
Letter to the Editor
The hidden population of long gamma-ray bursts from compact object mergers
1
Department of Physics and Earth Science, University of Ferrara, Via Saragat 1, I-44122 Ferrara, Italy
2
INAF – Osservatorio di Astrofisica e Scienza dello Spazio di Bologna, Via Piero Gobetti 101, 40129 Bologna, Italy
3
INFN – Sezione di Ferrara, Via Saragat 1, 44122 Ferrara, Italy
4
INAF – Osservatorio Astronomico d’Abruzzo, Via Mentore Maggini snc, Teramo, 64100 Teramo, Italy
5
Astrophysics Research Institute, LJMU, IC2, Liverpool Science Park, 146 Brownlow Hill, Liverpool L3 5RF, UK
6
INFN – Sezione di Bologna, Viale C. Berti Pichat 6/2 – 40126 Bologna, Italy
7
Dipartimento di Fisica, Università degli Studi di Cagliari, SP Monserrato-Sestu, km 0.7, I-09042 Monserrato, Italy
8
Ioffe Institute, Politekhnicheskaya 26, 194021 St. Petersburg, Russia
★ Corresponding author: This email address is being protected from spambots. You need JavaScript enabled to view it.
Received:
22
January
2026
Accepted:
16
March
2026
Abstract
Context. The prompt-emission time profiles of GRB 230307A and other long-duration compact object merger (COM) candidates exhibit a unique set of temporal properties, characterised by a deterministic evolution of waiting times and pulse widths.
Aims. We searched the Fermi/GBM catalogue for other unidentified long COM candidates exhibiting temporal properties similar to those observed in GRB 230307A.
Methods. We examined the temporal and spectral prompt-emission properties of GRBs featuring at least eight light-curve peaks. For candidates, all with unknown redshifts, that exhibited properties similar to GRB 230307A, we analysed their trajectories in the Ep, i − Eiso plane as a function of redshift. We then evaluated the joint likelihood of their compatibility with the Ep, i − Eiso relation satisfied by the bulk of long GRBs. Furthermore, we calculated their minimum variability timescales (MVTs) for comparison against known COM and collapsar populations.
Results. We identified nine COM candidates with unknown redshifts and demonstrated that there are at least two outliers of the Ep, i − Eiso relation with 3.1σ (Gaussian) confidence level. Furthermore, their MVTs are more consistent with those of COM than with collapsar GRBs.
Conclusions. These results indicate that this specific set of temporal properties can serve as a diagnostic tool to distinguish long-duration COMs from the broader collapsar population. Furthermore, our findings suggest that the fraction of unidentified COMs among long GRBs might be larger than previously assumed.
Key words: gamma-ray burst: general / gamma-ray burst: individual: GRB230307A
© The Authors 2026
 Open Access article, published by EDP Sciences, under the terms of the Creative Commons Attribution License (https://creativecommons.org/licenses/by/4.0), which permits unrestricted use, distribution, and reproduction in any medium, provided the original work is properly cited.
This article is published in open access under the Subscribe to Open model. This email address is being protected from spambots. You need JavaScript enabled to view it. to support open access publication.
1. Introduction
Compact object mergers (COMs), typically associated with short γ-ray bursts (SGRBs), are also occasionally found to be associated with long-duration GRBs (LGRBs). This association is exemplified by the case of GRB 230307A, a long burst accompanied by kilonova emission characteristic of COMs (e.g., Dai et al. 2024; Zhong et al. 2024; Levan et al. 2024; Yang et al. 2024; Dalessi et al. 2025; Gillanders & Smartt 2025). For this reason, GRBs are now often classified according to their progenitor and referred to as type-I and type-II GRBs, corresponding to COMs and massive star collapse, respectively, rather than being classified solely by their duration (e.g., Zhang 2006).
Maccary et al. (2026, hereafter M26) identified a set of four distinctive properties characterising the evolution of the time profile of GRB 230307A and those of other COM candidates such as GRB 211211A and GRB 060614. By contrast, the same properties are not seen in any typical long GRB associated with a type Ic-BL supernova (SN). The Ep, i − Eiso relation (e.g., Amati et al. 2002; Amati 2006) holds for type-II GRBs, while type-I lie above them in this plane and form a distinct cluster of points, thus offering a way to distinguish GRB progenitors. Moreover, a short (≲100 ms) minimum variability timescale (MVT) characterises the time profiles of type-I GRBs, both short and long (MacLachlan et al. 2012, 2013; Golkhou et al. 2015; Camisasca et al. 2023; Veres et al. 2023; Maccary et al. 2025; Stratta et al. 2025).
The goal of this paper is to identify additional COM candidates within the Fermi/GBM catalogue and to use the Ep, i − Eiso relation to further investigate their origin along with the clues given by the MVT. In Sect. 2, we describe our selection of a sample of long type-I GRB candidates that display similar properties to those identified in M26. Given these GRBs are not associated with a redshift measurement, we study their tracks in the Ep, i − Eiso plane as a function of the (unknown) redshift, performing statistical tests to assess their compatibility with the Ep, i − Eiso of type-II GRBs. In Sect. 3, we discuss our results and present our conclusions. Throughout this work, we use the flat-ΛCDM cosmology model with the latest cosmological parameter values, H0 = 67.66 km Mpc−1 s−1 and Ω0 = 0.31 (Planck Collaboration VI 2020).
2. Data analysis
2.1. Sample selection
We inspected the bursts detected by Fermi/GBM, from launch to June 2024, looking for a behaviour similar to that observed in GRB 230307A (M26). The background subtraction was carried out following the procedure in Maccary et al. (2025), resulting in the GRBs drawn for the present analysis. The peaks present in the light curve (LC) were identified with MEPSA (Guidorzi 2015). We selected the bursts exhibiting at least eight statistically significant peaks in their LCs to ensure an adequate sampling of the temporal profile, enabling a statistically meaningful characterisation of the temporal evolution of the properties identified in M26. We ended up with 263 bursts. We identified nine type-I candidates (hereafter called sample S0) featuring pulses, whose peak rates (PRs), waiting times (WTs), and full widths at half maximum (FWHMs) clearly show a deterministic evolution over time, in line with what was observed for GRB 230307A. These data are reported in Table 1. Three cases are showcased in Fig. 1, while the other six are reported in Fig. A.1 of the Appendix. Table A.1 reports the parameters obtained for the exponential models, defined in Appendix A, which describe the temporal evolution of the properties listed above. In Appendix C, we performed a Pearson correlation test (reported in Fig. C) to further assess the observed correlations between the aforementioned four properties and the peak times of the pulses observed in the time profile of these bursts.
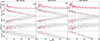 |
Fig. 1. Temporal evolution of the PR, WT, FWHM, and Ep for three GRBs selected from the sample S0. The grey solid lines represent the best-fitting exponential evolution and the shaded areas show the 3σ confidence intervals. |
Type-I GRB candidates identified in this work (referred to as sample S0).
2.2. Time-resolved spectral analysis
Using the Fermi/GBM data tools, we modelled the time-resolved energy spectra, adopting the Band function (Band et al. 1993), and we derived the temporal evolution of the peak energy, Ep, of the ν Fν spectrum throughout the burst. The high-energy power-law index β was fixed to β = −2.3 whenever it could not be constrained (e.g., Tsvetkova et al. 2017).
Time-resolved intervals were determined via Bayesian blocks (Scargle et al. 2013), merging adjacent blocks to ensure ≥1000 counts per interval (Maistrello et al. 2024). The criterion on the minimum number of counts was added to ensure that each block provides a statistically meaningful fit of the spectrum.
For at least seven GRBs, we observed an exponential evolution of Ep with time, sometimes following an initial rise before the peak. For GRB 140306A and GRB 230304B, we observed a significant tracking throughout the burst, in addition to the hard-to-soft exponential behaviour. For two cases, GRB 090831 and GRB 221121A, we were unable to obtain the time-integrated spectrum, owing to the faintness of the signal. The results of the modelling are reported in Table A.2 and the evolution of Ep with time is shown in Figs. 1 and A.1.
2.3. Study in the Ep, i − Eiso plane
We retrieved the intrinsic spectral peak energy, Ep, i = Ep (1 + z), and isotropic-equivalent energy Eiso values for 344 type-II GRBs with known redshift, z, using all available data from February 1997 to September 2025, mainly from the Konus/Wind catalogues (Tsvetkova et al. 2017, 2021). Hereafter, this sample is referred to as SII.
We modelled the Ep, i − Eiso correlation with a power-law following standard procedures, using the D’Agostini likelihood (D’Agostini 2005), which accounts for errors on both x- and y-axis and models the intrinsic dispersion, σint, of the relation. The likelihood maximisation was carried out within a Bayesian framework, performing a Markov chain Monte Carlo analysis (MCMC), using the Python package emcee (Foreman-Mackey et al. 2013). We modelled the relation as
 (1)
(1)
obtaining q = −15.3 ± 1.5, m = 0.34 ± 0.03, and σint = 0.27 ± 0.02. In parallel, we considered a sample of 47 type-I GRBs (15 of which being classified as short with extended emission), which is hereafter referred to as SI. Data were taken from the different Konus/Wind catalogues (Svinkin et al. 2016; Tsvetkova et al. 2017, 2021; Lysenko et al. 2025) and complemented with the data from the Fermi/GBM online catalogue1.
All S0 candidates have unknown redshifts. One can track their paths in the Ep, i − Eiso plane as a function of the unknown redshift, z, treated as a variable in the 0.01–5 range. To this aim, we used the fluence, f, and the observed peak energy, Ep, from the Fermi/GBM catalogue. The isotropic-equivalent energy, Eiso(z), was calculated as Eiso(z) = 4πdL2(z)f/(1 + z), where dL(z) is the luminosity distance, while the intrinsic peak energy is Ep, i(z) = Ep (1 + z). Figure 2 shows the results. Overall, one cannot help but notice that the S0 candidates preferentially populate the region above the Ep, i − Eiso relation, where most type-I GRBs lie.
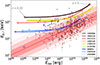 |
Fig. 2. Tracks of type-I candidates (sample S0) in the Ep,i − Eiso plane as a function of z. The tracks are colour-coded according to their ℒ* values, with darker (lighter) colours corresponding to higher (lower) ℒ*. Blue and brown points represent GRBs from sample SI and SII, respectively. The red line shows the Ep,i − Eiso relation and the shaded areas are the 1-, 2-, and 3-σint regions. The gold star is GRB 230307A. |
To evaluate the joint probability that the location of the S0 sample in the Eiso − Ep, i plane is incidental and that they are type-II GRBs, compatibly with the relation dispersion σint and with the individual measurement uncertainties, we conceived the following test. We collected all long (T90 > 2 s) GRBs without redshift in the online Fermi/GBM catalogue (excluding the S0 candidates) into the sample called SIInz. Under the assumption that all these GRBs are consistent with the Ep, i − Eiso relation, for each of them we derived the path in the Eiso − Ep, i plane and calculated the D’Agostini negative log-likelihood that best models the Ep, i − Eiso of SII, whose parameters (m, q, σint) are reported above
![Mathematical equation: $$ \begin{aligned} \mathcal{L} (z) = \frac{1}{2}\log \Big [2\pi (\sigma _{\rm {int}}^{2}+\sigma _{y}^{2} + m^{2}\,\sigma _{x}^{2})\Big ] + \frac{[y(z) -m\,x(z)-q]^{2}}{2(\sigma _{\rm {int}}^2+\sigma _{y}^{2}+m^2\,\sigma _{x}^2)}, \end{aligned} $$](/articles/aa/full_html/2026/04/aa59083-26/aa59083-26-eq11.gif) (2)
(2)
where x(z) = log Eiso(z) and y(z) = log Ep, i(z), where σx and σy are the corresponding uncertainties, which do not depend on z, but just on the relative uncertainties on f and on Ep.
For each GRB of SIInz, we determined z*, which is the value of z when minimising ℒ(z): ℒ* = ℒ(z*) = minz(ℒ(z)). The same procedure was applied to the S0 sample, whose ℒ* values are reported in Table 1. The sum of the values obtained for the S0 sample is a measure of the un-normalised joint likelihood, being the logarithm of the product of all individual likelihood values:  , where
  is the value for the i-th GRB of S0.
To determine the p-value, which is the probability of obtaining a value of ≥ ℒ*, S0(tot) under the assumption that they are all type-II GRBs, we built the reference distribution for ℒ*, S0(tot), according to the following process. We randomly drew Nsim = 106 samples of N = 9 GRBs from SIInz and for each of them we calculated the same metric,  The corresponding distribution of
  values was then used as a reference. As a result, only 124 cases had
  We conclude that the assumption that our S0 sample of nine long merger candidates are all type-II GRBs following the Ep, i − Eiso relation has a p-value equal to 1.24 × 10⁻⁴, equivalent to 3.7 σ (Gaussian). We also tried to reject the following more general H0 hypothesis: S0 includes at most Nout outliers of the Ep, i − Eiso relation. To test this H0, we have to reject from each sample a number, Nout, of GRBs with the largest ℒ* values out of nine and calculate the total value over the remaining ones,
  . This must be done for the real and the simulated samples. The Nout = 0 case is already described above. Table B.1 reports the p-values obtained for a range of Nout values. In particular, for Nout = 1, the p-value is 8.21 × 10⁻⁴, which is equivalent to 3.1 σ (Gaussian). Thus, we conclude, with > 3σ confidence, that at least 2/9 of our S0 candidates do not satisfy the Ep, i − Eiso relation.
2.4. Analysis in the MVT-T90 plane
Figure 3 shows the S0 candidates in the MVT-T90 plane. The data set of Maccary et al. (2025) was used as a reference. We adopt the MVT definition based on FWHMmin, which is the FWHM of the shortest pulse, following Camisasca et al. (2023), although similar conclusions can be drawn using alternative definitions2. In Appendix E, we studied the impact of using different MVT metrics. Both quantities were not divided by (1 + z) for the reasons explained in Camisasca et al. (2023). All S0 candidates lie at similar locations in the upper left of the plot, with T90 ∼ 30−50 s and MVT ≲ 0.1 s. Notably, some previously identified long type-I GRBs, such as GRB 191019A, GRB 211211A, and GRB 230307A, lie in the same region. In particular, GRB 190415A and GRB 230307A lie very close to each other. Only 0.2% of long bursts exhibit smaller MVT values than GRB 190415A. The MVT and T90 values of GRBs from the S0 set are reported in Table 1.
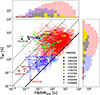 |
Fig. 3. MVT-T90 plane, with MVT defined as FWHMmin (adapted from Maccary et al. 2025). The filled circles represent the type-I GRB candidates (sample S0) identified in the present analysis. The blue and red crosses indicate short (T90 < 2 s) and long (T90 > 2 s) GRBs, respectively. Gold points represent SN-associated GRBs. Magenta, lime, and cyan points represent SEE-GRBs from Lien et al. (2016), Lan et al. (2020), Kaneko et al. (2015), respectively. Three extragalactic magnetar giant flare candidates, 180128A, 200415A, and 231115A are shown in brown. The solid black line represents the equality line, while the dashed, dashed-dotted, and dotted lines represent a factor of 10, 100, and 1000 respectively, deviation from equality. |
3. Discussion and conclusion
We identified nine type-I candidates sharing properties similar to those noted in M26 and analysed their positions in the  plane as a function of (unknown) redshift. Out of 263 bursts selected from the full Fermi/GBM catalogue, the fraction of long, multi-peaked type-I candidates identified via this method is around 3%. We demonstrated, with a confidence level exceeding 3σ, that at least two of these candidates are incompatible with the population of long GRBs lacking measured redshifts.
This suggests that the distinctive properties identified in M26 serve as a promising indicator of a compact object merger (COM) origin. Such findings have practical applications for identifying COM-associated GRBs, as these characteristics can be extracted directly from the prompt-emission light curve. This provides early, direct clues of a COM origin, which can help guide and prioritise the search for multi-wavelength counterparts. Unfortunately, owing to the poor localisations of these events, no afterglow searches were conducted for any of these candidates. Consequently, their redshifts remain unknown. In Appendix D, based on the possible incompatibility of these bursts with the Amati relation, we propose some limiting values for their redshifts. A preliminary search for the best-localised candidate, GRB 230304B3, identifies potential hosts at z ≲ 0.04. This would render the event consistent with other known long mergers in terms of energetics and luminosity, although the precise identification of the host remains unfeasible at this stage. Prospectively, promptly identifying these distinctive properties in future GRBs could help the community to quickly select promising COM candidates and plan dedicated multi-wavelength campaigns aimed at detecting the afterglow, assessing and characterising the progenitor. These distinctive properties are not only observationally significant, but also challenge the stochastic nature predicted by most theoretical models of GRB prompt emission. Specifically, the observed increase in pulse width throughout the burst profile is difficult to reconcile with the internal shock model; previously, the lack of such evolution in various multi-peaked GRBs was used to favour internal shocks over external ones (e.g. Fenimore et al. 1999). However, this reasoning applies neither to GRB 230307A nor to the other GRBs identified in this study. Thus, the observation of these properties opens the door for alternative scenarios, such as the target-shell model introduced in M26, which posits the existence of a primitive shell emitted before the main train of shells from the central engine. Alternatively, we could look to refined versions of the ICMART framework (Zhang & Yan 2011), where an expanding emission region with mini-emitters radiating through magnetic reconnection accounts for the properties of long merger events resembling that of GRB 230307A (Yi et al. 2025).
Acknowledgments
A. Rossi acknowledges financial support from INAF Mini Grant RSN4 (ID: 1.05.24.07.04).
References
- Amati, L. 2006, MNRAS, 372, 233 [Google Scholar]
- Amati, L., Frontera, F., Tavani, M., et al. 2002, A&A, 390, 81 [NASA ADS] [CrossRef] [EDP Sciences] [Google Scholar]
- Band, D., Matteson, J., Ford, L., et al. 1993, ApJ, 413, 281 [Google Scholar]
- Camisasca, A. E., Guidorzi, C., Amati, L., et al. 2023, A&A, 671, A112 [NASA ADS] [CrossRef] [EDP Sciences] [Google Scholar]
- D’Agostini, G. 2005, arXiv e-prints [arXiv:physics/0511182] [Google Scholar]
- Dai, C.-Y., Guo, C.-L., Zhang, H.-M., Liu, R.-Y., & Wang, X.-Y. 2024, ApJ, 962, L37 [Google Scholar]
- Dalessi, S., Veres, P., Hui, C. M., et al. 2025, ApJ, 994, 17 [Google Scholar]
- Fenimore, E. E., Ramirez-Ruiz, E., & Wu, B. 1999, ApJ, 518, L73 [NASA ADS] [CrossRef] [Google Scholar]
- Foreman-Mackey, D., Hogg, D. W., Lang, D., & Goodman, J. 2013, PASP, 125, 306 [Google Scholar]
- Gillanders, J. H., & Smartt, S. J. 2025, MNRAS, 538, 1663 [Google Scholar]
- Golkhou, V. Z., & Butler, N. R. 2014, ApJ, 787, 90 [NASA ADS] [CrossRef] [Google Scholar]
- Golkhou, V. Z., Butler, N. R., & Littlejohns, O. M. 2015, ApJ, 811, 93 [NASA ADS] [CrossRef] [Google Scholar]
- Guidorzi, C. 2015, Astron. Comput., 10, 54 [NASA ADS] [CrossRef] [Google Scholar]
- Kaneko, Y., Bostancı, Z. F., Göğüş, E., & Lin, L. 2015, MNRAS, 452, 824 [NASA ADS] [CrossRef] [Google Scholar]
- Kozyrev, A. S., Golovin, D. V., Litvak, M. L., et al. 2023, GRB Coordinates Network, 33480, 1 [Google Scholar]
- Lan, L., Lu, R.-J., Lü, H.-J., et al. 2020, MNRAS, 492, 3622 [NASA ADS] [CrossRef] [Google Scholar]
- Levan, A. J., Gompertz, B. P., Salafia, O. S., et al. 2024, Nature, 626, 737 [NASA ADS] [CrossRef] [Google Scholar]
- Lien, A., Sakamoto, T., Barthelmy, S. D., et al. 2016, ApJ, 829, 7 [Google Scholar]
- Lysenko, A. L., Svinkin, D. S., Frederiks, D. D., et al. 2025, PASA, 42 [Google Scholar]
- Maccary, R., Guidorzi, C., Camisasca, A. E., et al. 2025, A&A, 702, A95 [NASA ADS] [CrossRef] [EDP Sciences] [Google Scholar]
- Maccary, R., Guidorzi, C., Maistrello, M., et al. 2026, J. High Energy Astrophys., 49, 100456 [Google Scholar]
- MacLachlan, G. A., Shenoy, A., Sonbas, E., et al. 2012, MNRAS, 425, L32 [NASA ADS] [CrossRef] [Google Scholar]
- MacLachlan, G. A., Shenoy, A., Sonbas, E., et al. 2013, MNRAS, 432, 857 [NASA ADS] [CrossRef] [Google Scholar]
- Maistrello, M., Maccary, R., Guidorzi, C., & Amati, L. 2024, A&A, 684, L10 [NASA ADS] [CrossRef] [EDP Sciences] [Google Scholar]
- Planck Collaboration VI. 2020, A&A, 641, A6 [NASA ADS] [CrossRef] [EDP Sciences] [Google Scholar]
- Scargle, J. D., Norris, J. P., Jackson, B., & Chiang, J. 2013, ApJ, 764, 167 [Google Scholar]
- Stratta, G., Nicuesa Guelbenzu, A. M., Klose, S., et al. 2025, ApJ, 979, 159 [Google Scholar]
- Svinkin, D. S., Frederiks, D. D., Aptekar, R. L., et al. 2016, ApJS, 224, 10 [CrossRef] [Google Scholar]
- Tsvetkova, A., Frederiks, D., Golenetskii, S., et al. 2017, ApJ, 850, 161 [NASA ADS] [CrossRef] [Google Scholar]
- Tsvetkova, A., Frederiks, D., Svinkin, D., et al. 2021, ApJ, 908, 83 [NASA ADS] [CrossRef] [Google Scholar]
- Veres, P., Bhat, P. N., Burns, E., et al. 2023, ApJ, 954, L5 [NASA ADS] [CrossRef] [Google Scholar]
- Yang, Y.-H., Troja, E., O’Connor, B., et al. 2024, Nature, 626, 742 [NASA ADS] [CrossRef] [Google Scholar]
- Yi, S.-X., Yorgancioglu, E. S., Xiong, S. L., & Zhang, S. N. 2025, J. High Energy Astrophys., 47, 100359 [Google Scholar]
- Zhang, B. 2006, Nature, 444, 1010 [NASA ADS] [CrossRef] [Google Scholar]
- Zhang, B., & Yan, H. 2011, ApJ, 726, 90 [Google Scholar]
- Zhong, S.-Q., Li, L., Xiao, D., et al. 2024, ApJ, 963, L26 [Google Scholar]
FWHMmin correlates with other MVT metrics (Golkhou et al. 2015; MacLachlan et al. 2013), with values that are on average ∼5 − 6 larger (Maccary et al. 2025). This difference does not affect the results presented here, since the relative position of the bursts in the MVT-T90 plane remains essentially unchanged.
It was localised by the InterPlanetary Network within an error box of about 100 arcmin square (Kozyrev et al. 2023).
Appendix A: Exponential fit of the four temporal properties
We used the following exponential models to describe the temporal behaviour of the PR, WTs, FWHMs, and peak energy.
 (A.1)
(A.1)
 (A.2)
(A.2)
 (A.3)
(A.3)
 (A.4)
(A.4)
PR0, FWHM0, and Ep, 0 are the initial values at t = 0, and τR, τWT, τFWHM, τEp the characteristic evolution timescales. N0 is the number of elementary bunches of energy in the toy model defined in M26 used to model the WTs evolution.
These relations were modelled using the D’Agostini likelihood, in a similar way as for the modelling of the Ep, i − Eiso previously described, and the dispersion of these relations are described by σR, σWT, σFWHM, and σEp, respectively. The evolution of these four properties are displayed in Fig. 1 and Fig. A.1. The parameters of the fit are given in Table A.1, and Table A.2 for the fit of the peak energy.
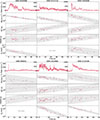 |
Fig. A.1. Temporal evolution of the PR, WTs, FWHM, and Ep for the six remaining GRBs of the sample S0. The grey solid lines represent the best fits of the linear relation and the shaded grey regions represent the 3σ confidence intervals of the fits. |
Best-fit parameters for each GRB of the S0 sample for the three different fits (WTs, FWHM, and PR).
Best-fit results of the exponential evolution of Ep with time for each GRB of the S0 sample.
Appendix B: Statistical tests
Figure B.1 represents the likelihood values of the S0 sample testing the compatibility of these GRBs to the Ep, i − Eiso relation for type-II GRBs. Table B.1 reports the results of the statistical tests.
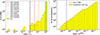 |
Fig. B.1. Left: distribution of likelihoods (given by exp(−ℒ*), ℒ* being the negative log-likelihood) for GRBs from sample SIInz. Vertical lines show the values of S0 candidates. Right: histogram of exp( − ℒ*(tot)), where |


Probabilities for a set of H0 hypotheses, each of which assumes a maximum value of the number of outliers of the Ep, i − Eiso relation in the S0 sample (Sect. 2.3).
Appendix C: Correlation tests
To further assess whether the temporal and spectral properties of the prompt emission evolve during the burst, we tested for correlations between time, described by the peak time of the pulses detected by MEPSA, and the four properties studied in M26, i.e. PR, WTs, pulse FWHM, and, when available, spectral peak energy Ep. For each observable, we evaluated the presence of a linear trend with time using a standard correlation test. Since all four properties show an exponential evolution, the analysis was performed in logarithmic space for the dependent variables. A Pearson test, testing for linear correlation, was performed. We computed the corresponding correlation coefficient and associated p-value, which quantifies the probability of obtaining the observed correlation by chance under the null hypothesis of no temporal trend. The result of this analysis is shown in Figure C.1. Several GRBs (GRB 140306A, GRB 150510A, GRB 170527A, GRB 190415A, GRB 230304B) have all four properties correlated with time (or at least three when the time-integrated spectrum is not available, as for GRB 221121A). In some cases (GRB 211019A, GRB 220408B), for one or two properties the correlation cannot be established. Only for GRB 090831, the faintest GRB considered in sample S0, no correlation can be firmly established.
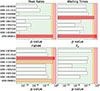 |
Fig. C.1. From top to bottom panels, left to right: p-values from Pearson correlation tests for the PR, WTs, pulse FWHM, and, when available, the spectral peak energy Ep. Horizontal bars indicate the p-values associated with each correlation test. Green-shaded regions (corresponding to white bars) denote p-values below 0.01, for which the null hypothesis of no temporal trend is rejected. Orange bars correspond to p-values between 0.01 and 0.05, indicating marginal detections of temporal trends. Red bars indicate p-values greater than 0.05, for which the null hypothesis of no temporal evolution cannot be rejected. |
Appendix D: Redshift limiting values from the violation of the Amati relation of type-II GRBs
The Ep, i − Eiso plane can be used to estimate the redshift below which a given GRB in the sample S0 becomes incompatible (at 3 or 2σ confidence level) with the Ep, i − Eiso followed by the bulk of collapsar GRBs. This value is obtained by computing the redshift at which the track formed by a given GRB intersects the 3σint line (resp. 2σint line) of the Ep, i − Eiso relation. The results are reported in Table D.1. Although this quantity does not directly provide an upper limit on the GRB redshift (as several type-I GRBs are very close to the Amati relation of type-II GRBs) GRBs, this information could be used to ease the research of an associated host galaxy. In particular, for GRB 090831, GRB 220408B, GRB 230304B, the obtained limits would place these GRBs at very close distances. However, we emphasise that these values should not be taken as direct estimates of the burst redshift. Indeed, as for instance is the case for GRB 230307A, a type-I GRB can perfectly lie within the 3 σ relation of type-II GRBs.
Redshift values below which each GRB becomes incompatible with the Amati relation for type-II GRBs at 2 and 3σ confidence levels.
Appendix E: The impact of using different MVT metrics
Various studies have focused on computing the MVT. Notably, MacLachlan et al. (2012, 2013), and Golkhou & Butler (2014), Golkhou et al. (2015) developed non-parametric, wavelet-based measures of intrinsic variability. These methods are designed to study the temporal power as a function of timescale in a robust and unbiased manner, without relying on pulse fitting procedures or specific assumptions regarding pulse shape. The resulting MVT values are found to be closely related to the shortest rise times in GRB light curves. In contrast, the MVT defined in Camisasca et al. (2023) and in Maccary et al. (2025), computed as the FWHM of the shortest pulse in the light curve, is found to be about 5 − 6 times longer than the MVT derived from the aforementioned studies. However, this discrepancy does not impact the conclusions drawn from Figure 3. In fact, adopting alternative MVT definitions would essentially result into a leftward, roughly uniform, shift of all data points. Consequently, the relative positioning of the 9 candidates against the bulk population remains fundamentally unchanged. This consistency is illustrated in Figure E.1, which compares the MVT-T90 plane using the GRB sample from MacLachlan et al. (2013) (left panel) with values sourced from both that catalogue and Maccary et al. (2025) (right panel).
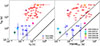 |
Fig. E.1. Left: MVT-T90 plane, with the MVT (denoted as τβ) values taken from MacLachlan et al. (2013), using their GRB sample. Right: MVT-T90 plane for the same bursts using the MVT values (denoted as FWHMmin) from Maccary et al. (2025). Solid and dashed lines show equality and T90 = 10× MVT. Some bursts are shown with coloured filled circles with the only purpose of highlighting the corresponding location in each plot. GRB 090831A, which belongs to the S0 sample, is identified with a purple star. Evidently, the relative positioning of these bursts remains essentially invariant, regardless of the MVT metric employed. |
In spite of subtle differences between the two sets and a significant overlap between the two populations of long and short GRBs, the latter consistently exhibit lower MVT values than the former. Notably, the MVT values of the two populations from MacLachlan et al. (2013) (left panel) appear to be slightly better separated than the corresponding  values (right panel). Ultimately, for the scope of this study, both MVT definitions lend support to the same conclusions.
All Tables
Best-fit parameters for each GRB of the S0 sample for the three different fits (WTs, FWHM, and PR).
Best-fit results of the exponential evolution of Ep with time for each GRB of the S0 sample.
Probabilities for a set of H0 hypotheses, each of which assumes a maximum value of the number of outliers of the Ep, i − Eiso relation in the S0 sample (Sect. 2.3).
Redshift values below which each GRB becomes incompatible with the Amati relation for type-II GRBs at 2 and 3σ confidence levels.
All Figures
|
Fig. 1. Temporal evolution of the PR, WT, FWHM, and Ep for three GRBs selected from the sample S0. The grey solid lines represent the best-fitting exponential evolution and the shaded areas show the 3σ confidence intervals. |
| In the text | |
|
Fig. 2. Tracks of type-I candidates (sample S0) in the Ep,i − Eiso plane as a function of z. The tracks are colour-coded according to their ℒ* values, with darker (lighter) colours corresponding to higher (lower) ℒ*. Blue and brown points represent GRBs from sample SI and SII, respectively. The red line shows the Ep,i − Eiso relation and the shaded areas are the 1-, 2-, and 3-σint regions. The gold star is GRB 230307A. |
| In the text | |
|
Fig. 3. MVT-T90 plane, with MVT defined as FWHMmin (adapted from Maccary et al. 2025). The filled circles represent the type-I GRB candidates (sample S0) identified in the present analysis. The blue and red crosses indicate short (T90 < 2 s) and long (T90 > 2 s) GRBs, respectively. Gold points represent SN-associated GRBs. Magenta, lime, and cyan points represent SEE-GRBs from Lien et al. (2016), Lan et al. (2020), Kaneko et al. (2015), respectively. Three extragalactic magnetar giant flare candidates, 180128A, 200415A, and 231115A are shown in brown. The solid black line represents the equality line, while the dashed, dashed-dotted, and dotted lines represent a factor of 10, 100, and 1000 respectively, deviation from equality. |
| In the text | |
|
Fig. A.1. Temporal evolution of the PR, WTs, FWHM, and Ep for the six remaining GRBs of the sample S0. The grey solid lines represent the best fits of the linear relation and the shaded grey regions represent the 3σ confidence intervals of the fits. |
| In the text | |
|
Fig. B.1. Left: distribution of likelihoods (given by exp(−ℒ*), ℒ* being the negative log-likelihood) for GRBs from sample SIInz. Vertical lines show the values of S0 candidates. Right: histogram of exp( − ℒ*(tot)), where |
| In the text | |
|
Fig. C.1. From top to bottom panels, left to right: p-values from Pearson correlation tests for the PR, WTs, pulse FWHM, and, when available, the spectral peak energy Ep. Horizontal bars indicate the p-values associated with each correlation test. Green-shaded regions (corresponding to white bars) denote p-values below 0.01, for which the null hypothesis of no temporal trend is rejected. Orange bars correspond to p-values between 0.01 and 0.05, indicating marginal detections of temporal trends. Red bars indicate p-values greater than 0.05, for which the null hypothesis of no temporal evolution cannot be rejected. |
| In the text | |
|
Fig. E.1. Left: MVT-T90 plane, with the MVT (denoted as τβ) values taken from MacLachlan et al. (2013), using their GRB sample. Right: MVT-T90 plane for the same bursts using the MVT values (denoted as FWHMmin) from Maccary et al. (2025). Solid and dashed lines show equality and T90 = 10× MVT. Some bursts are shown with coloured filled circles with the only purpose of highlighting the corresponding location in each plot. GRB 090831A, which belongs to the S0 sample, is identified with a purple star. Evidently, the relative positioning of these bursts remains essentially invariant, regardless of the MVT metric employed. |
| In the text | |
Current usage metrics show cumulative count of Article Views (full-text article views including HTML views, PDF and ePub downloads, according to the available data) and Abstracts Views on Vision4Press platform.
Data correspond to usage on the plateform after 2015. The current usage metrics is available 48-96 hours after online publication and is updated daily on week days.
Initial download of the metrics may take a while.