Fig. B.1.
Download original image
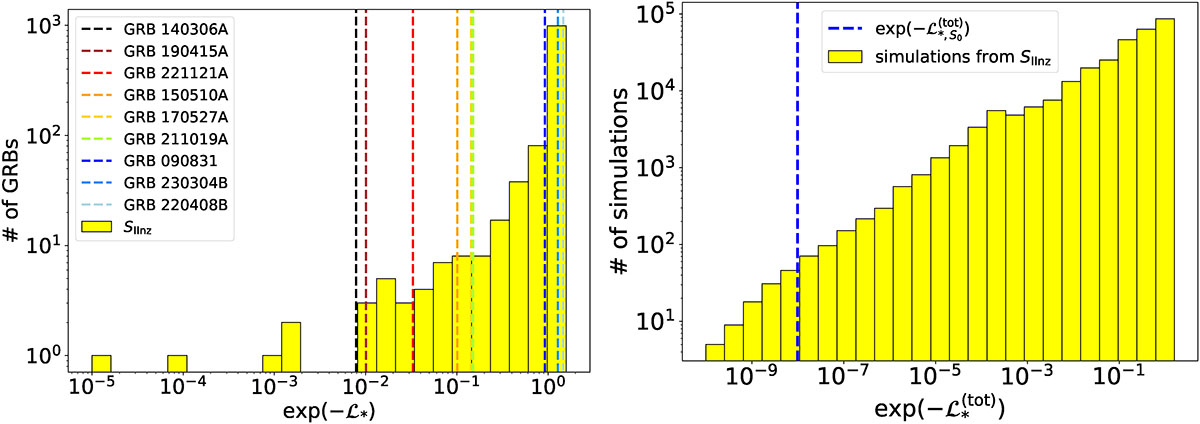
Left: distribution of likelihoods (given by exp(−ℒ*), ℒ* being the negative log-likelihood) for GRBs from sample SIInz. Vertical lines show the values of S0 candidates. Right: histogram of exp( − ℒ*(tot)), where  obtained from 106 realisations of random selection of 9 GRBs from SIInz (Sec. 2.3). The vertical blue line shows the value obtained from the sample S0,
 ![]() . The fraction of simulations for which is it
. The fraction of simulations for which is it ![]() is the joint probability that all 9 GRBs from S0 are consistent with the Ep, i − Eiso for type-II GRBs. This fraction turns out to be 1.2 × 10⁻⁴, equivalent to 3.7σ (Gaussian).
is the joint probability that all 9 GRBs from S0 are consistent with the Ep, i − Eiso for type-II GRBs. This fraction turns out to be 1.2 × 10⁻⁴, equivalent to 3.7σ (Gaussian).
Current usage metrics show cumulative count of Article Views (full-text article views including HTML views, PDF and ePub downloads, according to the available data) and Abstracts Views on Vision4Press platform.
Data correspond to usage on the plateform after 2015. The current usage metrics is available 48-96 hours after online publication and is updated daily on week days.
Initial download of the metrics may take a while.